. 2015 Jan 19:4:e05048.
doi: 10.7554/eLife.05048.

Global biogeographic sampling of bacterial secondary metabolism

Affiliations

Global biogeographic sampling of bacterial secondary metabolism

Zachary Charlop-Powers et al. Elife. .

Abstract

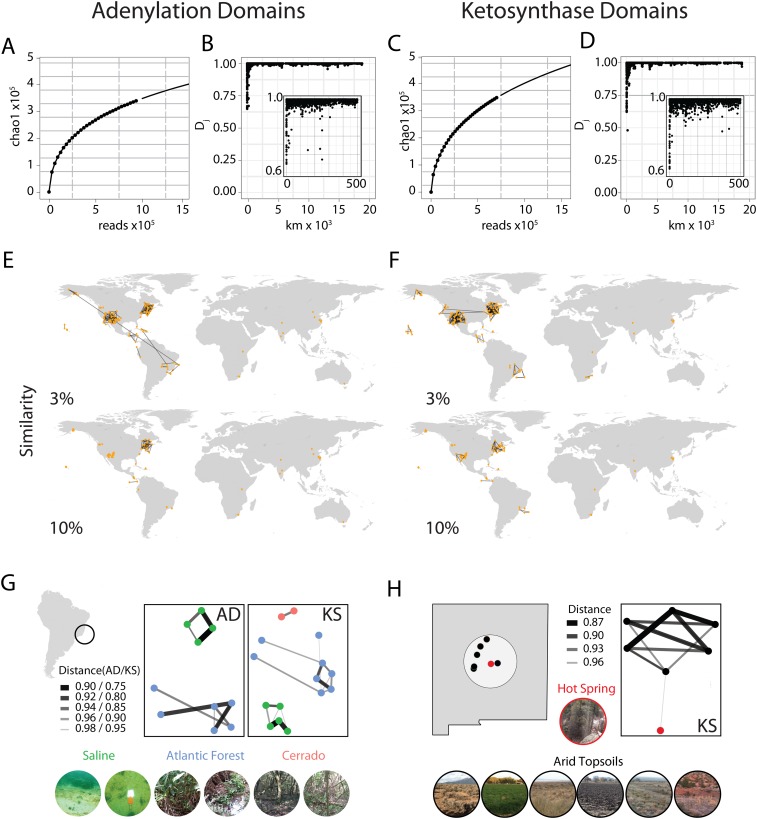
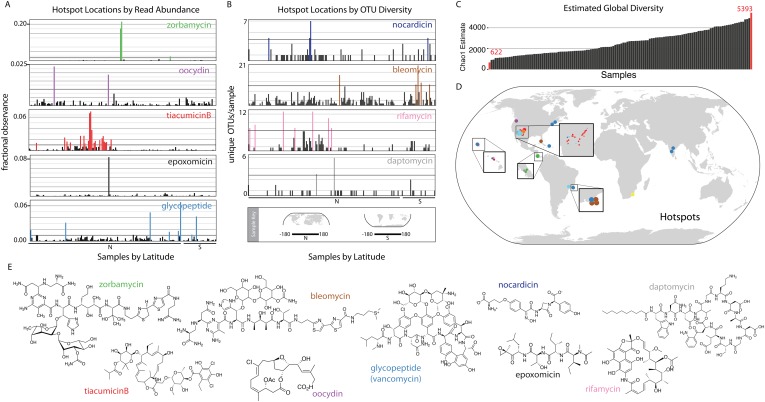
Recent bacterial (meta)genome sequencing efforts suggest the existence of an enormous untapped reservoir of natural-product-encoding biosynthetic gene clusters in the environment. Here we use the pyro-sequencing of PCR amplicons derived from both nonribosomal peptide adenylation domains and polyketide ketosynthase domains to compare biosynthetic diversity in soil microbiomes from around the globe. We see large differences in domain populations from all except the most proximal and biome-similar samples, suggesting that most microbiomes will encode largely distinct collections of bacterial secondary metabolites. Our data indicate a correlation between two factors, geographic distance and biome-type, and the biosynthetic diversity found in soil environments. By assigning reads to known gene clusters we identify hotspots of biomedically relevant biosynthetic diversity. These observations not only provide new insights into the natural world, they also provide a road map for guiding future natural products discovery efforts.

Keywords: biogeography; biosynthesis; evolutionary biology; genomics; infectious disease; metagenomics; microbiology; natural products; none.


Conflict of interest statement

The authors declare that no competing interests exist.

Figures

Figure 1.
Figure 1.. Global abundance and comparative distribution of AD/KS sequences.
The global abundance (A and C), sample-to-sample variation (B and D), and geographic distribution (E, F, G, and H) of adenylation domains (AD) and ketosynthase domains (KS) were assessed by pyro-sequencing of amplicons generated using degenerate primers targeting AD and KS domains found in 185 soils/sediments from around the world. (A and C) Global AD (A) or KS (C) domain diversity estimates were obtained by rarefying the global OTU table (de novo clustering at 95%) for AD and KS sequences and calculating the average Chao1 diversity metric at each sampling depth. (B and D) The ecological distance (i.e., Jaccard dissimilarity) between AD (B) or KS (D) domain populations sequenced from each metagenome was determined as a function of the great circle distance between sample collection sites (km). Insets show local relationships (<500 km) in more detail. (E and F) All sample collection sites are shown on each world map and lines are used to connect sample sites that share at least the indicated fraction (3%, 10%) of AD (E) or KS (F) OTUs. (G and H) Biome-specific relationships within domain OTU populations sequenced from geographically proximal samples assessed by Jaccard similarity. Samples were collected from (G) Atlantic forest, saline or cerrado environments or from the (H) New Mexican desert topsoils or hot springs sediments. DOI: http://dx.doi.org/10.7554/eLife.05048.003
Figure 2.
Figure 2.. Biomedically relevant natural product hotspots and diversity.
Hotspot analysis of natural product biosynthetic diversity to identify samples with a high total proportion of reads corresponding to a natural product family of interest (A and D), the maximum unique OTUs corresponding to a natural product family of interest (B and D), or the estimated sample biodiversity (C and D). In A and B samples are arranged by longitude and hemisphere as is shown in the Sample Key. (A) For each sample, sequence reads assigned by eSNaPD are expressed as a percentage of total reads obtained for that sample. A sample is designated a hotspot if more than one percent (0.01; horizontal line) of its reads map to a specific gene cluster. Fractional observance data for five representative gene clusters or gene cluster families (zorbamycin, oocydin, tiacumicinB, epoxomicin, glycopeptides) that show significant sample dependent difference in read frequency are shown. (B) Hotspots of elevated gene cluster family diversity can be identified by determining the number of unique OTUs occurring in each sample that, by eSNaPD, map to a natural product gene cluster of interest. Sample specific OTU counts for nocardicin, rifamycin, bleomycin, and daptomycin clusters are shown. Samples containing greater than 50% of the maximum observed OTU value are colored and mapped in (C). OTU diversity measurements do not predict the abundance of a specific cluster in a metagenome [as predicted in (A)], but instead are used to identify locations where the largest number of congener-encoding clusters may be found. These sites are predicted to be most useful for increasing the structural diversity and therefore potential clinical utility of these medically important families of natural products. (C) Estimated diversity of AD/KS reads by sample. AD and KS OTU tables were combined and for each sample the Chao1 diversity metric was calculated at 5000 reads, providing a baseline metric for comparing sample biosynthetic diversity. The average number of unique OTUs observed over 10 rarefactions analyses is shown (also see Supplementary file 7). (D) Hotspot map of samples identified in A, B and C. (E) Representative structures of target molecule families highlighted in A and B. DOI: http://dx.doi.org/10.7554/eLife.05048.004

Comment in

References

    1. Ayuso-Sacido A, Genilloud O. New PCR primers for the screening of NRPS and PKS-I systems in actinomycetes: detection and distribution of these biosynthetic gene sequences in major taxonomic groups. Microbial Ecology. 2005;49:10–24. doi: 10.1007/s00248-004-0249-6. - DOI - PubMed
    1. Bentley SD, Chater KF, Cerdeño-Tárraga AM, Challis GL, Thomson NR, James KD, Harris DE, Quail MA, Kieser H, Harper D, Bateman A, Brown S, Chandra G, Chen CW, Collins M, Cronin A, Fraser A, Goble A, Hidalgo J, Hornsby T, Howarth S, Huang CH, Kieser T, Larke L, Murphy L, Oliver K, O'Neil S, Rabbinowitsch E, Rajandream MA, Rutherford K, Rutter S, Seeger K, Saunders D, Sharp S, Squares R, Squares S, Taylor K, Warren T, Wietzorrek A, Woodward J, Barrell BG, Parkhill J, Hopwood DA. Complete genome sequence of the model actinomycete Streptomyces coelicolor A3(2) Nature. 2002;417:141–147. doi: 10.1038/417141a. - DOI - PubMed
    1. Bivand RS, Pebesma EJ. Classes and methods for spatial data in R. R News. 2005;5:9.
    1. Brady SF. Construction of soil environmental DNA cosmid libraries and screening for clones that produce biologically active small molecules. Nature Protocols. 2007;2:1297–1305. doi: 10.1038/nprot.2007.195. - DOI - PubMed
    1. Brady SF, Clardy J. Palmitoylputrescine, an antibiotic isolated from the heterologous expression of DNA extracted from bromeliad tank water. Journal of Natural Products. 2004;67:1283–1286. doi: 10.1021/np0499766. - DOI - PubMed

Publication types