

Nuclear matrix protein Matrin3 regulates alternative splicing and forms overlapping regulatory networks with PTB
- PMID: 25599992
- PMCID: PMC4365034
- DOI: 10.15252/embj.201489852
Nuclear matrix protein Matrin3 regulates alternative splicing and forms overlapping regulatory networks with PTB
Abstract
Matrin3 is an RNA- and DNA-binding nuclear matrix protein found to be associated with neural and muscular degenerative diseases. A number of possible functions of Matrin3 have been suggested, but no widespread role in RNA metabolism has yet been clearly demonstrated. We identified Matrin3 by its interaction with the second RRM domain of the splicing regulator PTB. Using a combination of RNAi knockdown, transcriptome profiling and iCLIP, we find that Matrin3 is a regulator of hundreds of alternative splicing events, principally acting as a splicing repressor with only a small proportion of targeted events being co-regulated by PTB. In contrast to other splicing regulators, Matrin3 binds to an extended region within repressed exons and flanking introns with no sharply defined peaks. The identification of this clear molecular function of Matrin3 should help to clarify the molecular pathology of ALS and other diseases caused by mutations of Matrin3.
Keywords: Matrin3; PTB; alternative splicing.
© 2015 The Authors. Published under the terms of the CC BY 4.0 license.
Figures
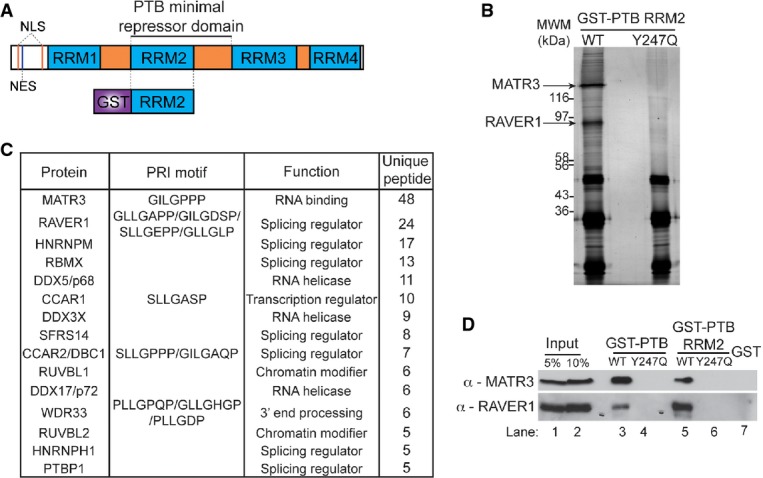
A Schematic representation of PTB (top) and the GST-PTB RRM2 (below), with the limits of the PTB minimal repressor domain indicated. PTB is composed of four RNA recognition motifs (RRM) with three linker regions in between them. It also contains a N-terminus bipartite nuclear localization signal (NLS) as well as a nuclear export signal (NES). The GST-PTB RRM2 is composed of the second RRM fused to a GST tag in the N-terminus.
B Silverstain of the GST-PTB RRM2 pull-down of the wild-type RRM2 and the Y247Q mutant. Five microlitre of the pull-down was run on a 15% SDS–PAGE and silver-stained. Three strong bands can be seen which are due to the recombinant protein and the beads used for the pull-down. The region encompassing 50 kDa to the top of the gel was sliced and subjected to in-gel digestion and mass spectrometry. The two strongest bands visible in this region are labelled as Matrin3 and Raver1.
C Proteins identified in the GST-PTB RRM2 pull-down ranked by their unique peptide number. The table shows the different proteins we found binding to RRM2, as well as when present, the sequence of the PRI motif. The indicated function is only a guideline as many have more functions than shown.
D Western blot of the GST pull-down using antibodies against Matrin3 and Raver1. Lanes 1 and 2 show 5 and 10% of input, respectively, lanes 3 and 4 show GST-PTB full-length pull-down of wild-type and Y247Q mutant, respectively, and lanes 5 and 6 show GST-PTB RRM2 pull-down of wild-type and Y247Q mutant, respectively, and lane 7 with pull-down using GST alone.
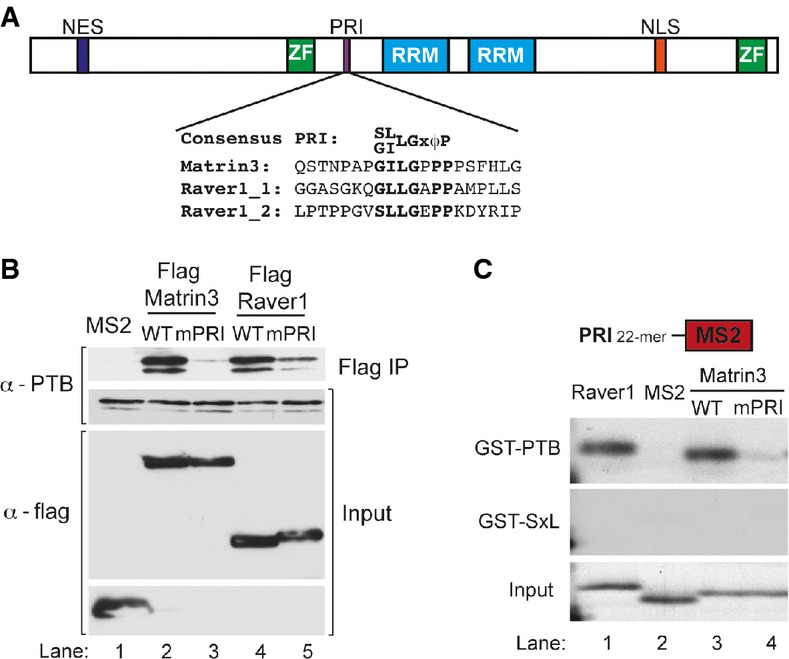
A Schematic representation of Matrin3. Matrin3 is composed by two zinc finger (ZF) domains, two tandem RNA recognition motifs (RRM), as well as a N-terminal nuclear export signal (NES) and a C-terminal nuclear localization signal (NLS). A PRI motif is localized between the first ZF and the first RRM, and the sequence is aligned with the sequence from the two functional PRIs from Raver1. Conserved PRI residues are in bold.
B FLAG immunoprecipitation of Matrin3 and Raver1, both with wild-type and with PRI mutated, and FLAG-MS2 as a negative control. The immunoprecipitated complex was separated in a SDS–PAGE and subjected to Western blot using antibody against PTB which showed interaction to wild-type Matrin3 (lane 2) and Raver1 (lane 4). The input was also analysed by Western blot with antibodies against PTB as a loading control and against the FLAG tag to ensure equal expression of proteins.
C The 20-residue Raver1 491–511 (lane 1) and the Matrin3 346–365 (lane 3) peptide fused to MS2 were transcribed and translated in vitro (Input) and then pulled down with GST-PTB or with GST-SXL as a control. Effects of single mutation of the Matrin3 PRI GILPPP to GIAPPP were also tested (lane 4).
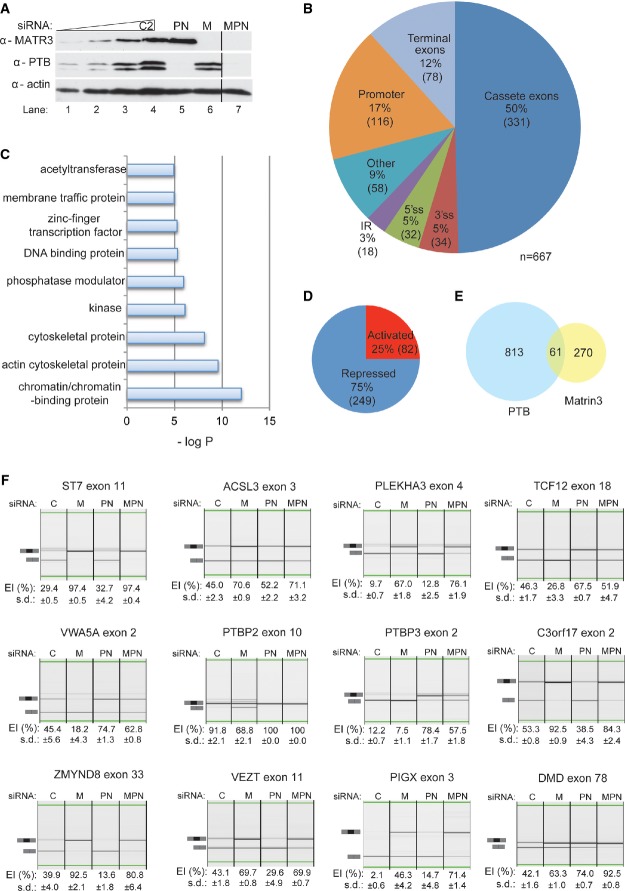
A Western blot probed for Matrin3 (top panel), PTB (middle panel) and actin (lower panel). Lanes 1–4 contain a twofold dilution of the control C2 sample (lane 1—12.5%, lane 2—25%, lane 3—50%, lane 4—100%). Lanes 4–7 contain equal amount of proteins, as can be confirmed by the anti-actin (lower panel), of control sample (lane 4), double-PTB and nPTB siRNA-treated sample (lane 5), Matrin3 siRNA-treated sample (lane 6) and triple knockdown of Matrin3, PTB and nPTB (lane 7). Lane 7 is from the same gel and exposure, but some lanes present in the original gel were cropped for clarity, and a black line to indicate cropping was placed.
B Pie chart of the different categories of Matrin3-regulated alternative splicing events (ASEs), 330 cassette exons (50%), 116 alternative promoter usage (17%), 78 terminal exons (11%), 32 alternative 5′ (5%) and 34 3′ (5%) splice site and 18 intron retention (IR; 3%) events.
C Gene ontology (GO) analysis of the Matrin3-regulated cassette exons. The x-axis represents the P-value in a logarithmic scale as shown.
D Pie chart of the activated and repressed cassette exons by Matrin3.
E Venn diagram of the overlap between the PTB- (blue) and Matrin3- (yellow) regulated cassette exons, showing the 813 events regulated only by PTB, 270 by Matrin3 only and the 61 that overlap.
F RT–PCR validation of Matrin3-regulated alternative spicing events in the ST7, ACSL3, PLEKHA3, TCF12, VWA5A, PTBP2, PTBP3, C3orf17, ZMYND8, VEZT, PIGX and DMD genes. In each case, triplicates for each condition (C—control, M—Matrin3, PTB/nPTB and Matrin3/PTB/nPTB siRNA transfection samples) were analysed and exon inclusion (EI) percentage is shown beneath the corresponding lane, along with the standard deviation (s.d.).
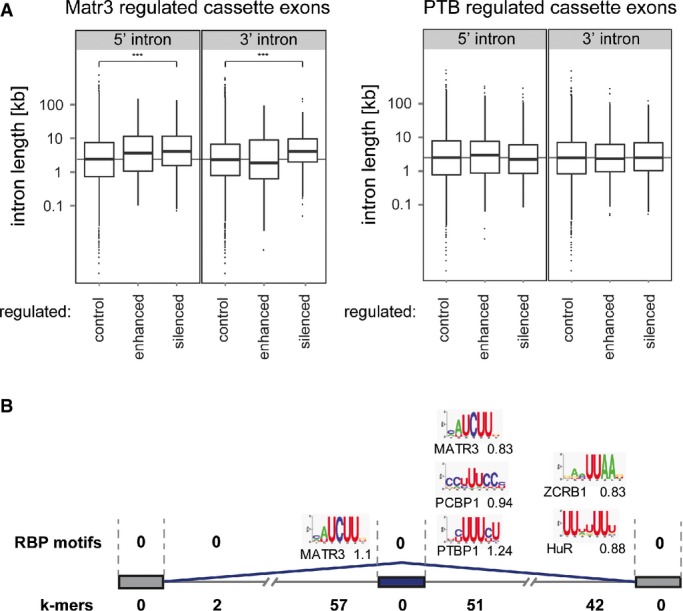
A Intron lengths flanking exons regulated by Matrin3, PTB or control exons. Kruskal–Wallis rank-sum test was used to test for significant changes (Matr3 P-value = 3.947e−15, PTB P-value = 0.3896). ***P < 0.001.
B Diagram of Matrin3-repressed cassette exons with enriched RBP motifs for human proteins (Ray et al, 2013) shown above and the number of enriched pentamers shown below in each of 7 locations. The RBP motifs are shown with their consensus binding site logo (Ray et al, 2013) and the respective motif enrichment score (odds ratio). The significant enriched k-mers are shown in Supplementary Table S4, and all enriched RBP motifs (multiple species) are shown in Supplementary Table S5.
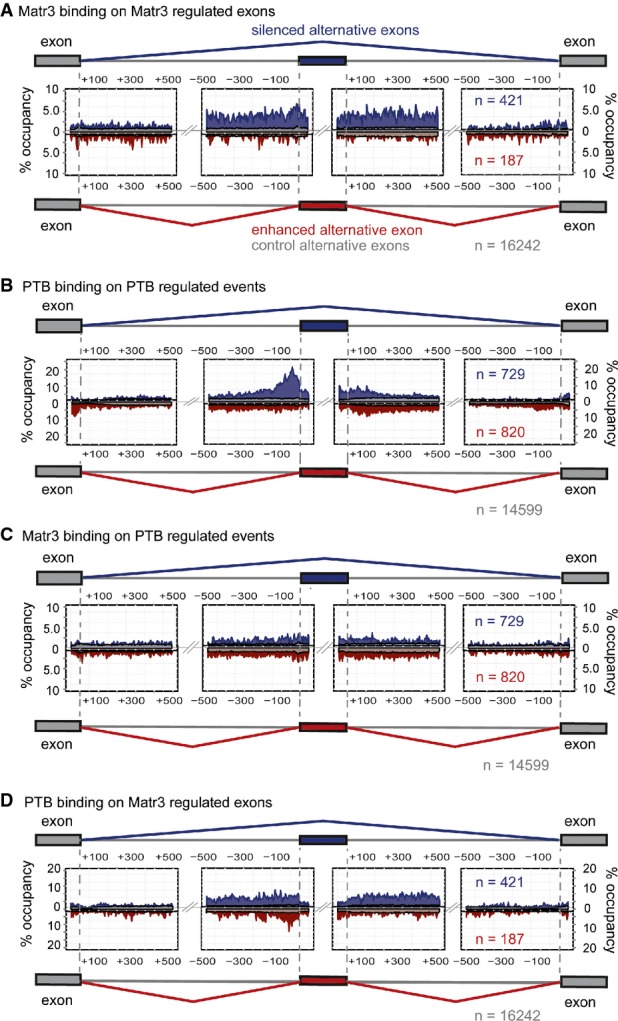
A Matrin3 crosslinking in Matrin3-regulated pre-mRNAs where position of crosslinked nucleotides was mapped onto the regulated exon and the 500 nucleotides upstream and downstream of its 3′ss and 5′ss, respectively, the upstream flanking exon and 500 nucleotides downstream of its 5′ss and the downstream flanking exon with 500 nucleotides upstream of its 5′ss. The iCLIP tags were mapped onto silenced ASE (blue, n = 421), enhanced ASE (red, n = 187) and to control ASE (grey, n = 16,242), and percentage of occupancy is plotted.
B Same as in (A) but using iCLIP tags obtained from PTB iCLIP and mapped onto PTB/nPTB-regulated ASE, silenced ASE (blue, n = 729), enhanced (red, n = 820) and control ASE (grey, n = 14,599).
C Matrin3 crosslinked nucleotides mapped onto PTB-regulated ASE.
D PTB crosslinked nucleotides mapped onto Matrin3-regulated ASE.

A Schematic representation of Matrin3 with its domains in the wild-type construct (WT) and the mutants used in overexpression, mPRI which has corresponding domain deleted in each one of the mutants, mPRI where the PRI motif is mutated from GILGPPP to GAAAPPA, ΔZ1 where the first zinc finger is deleted, ΔRRM where both the RRM domains are deleted and ΔZ2 where the second zinc finger is deleted.
B Western blot of the overexpressed Matrin3 and its mutants probed with anti-FLAG and anti-actin antibodies.
C, D RT–PCR analysis using primers specific to the ST7 exon 11 (C) and ABI2 exon 8 (D) splicing reporters, respectively, of samples where FLAG-tagged Matrin3 and its mutants have been overexpressed. Quantification of at least three replicates for each condition is shown as a histogram of the percentage of exon inclusion. *P < 0.01 compared with control sample (−).
E Western blot of overexpressed FLAG-tagged Matrin3 and PTB, in control siRNA and PTB/nPTB siRNA-transfected cells, probed with anti-FLAG to detect overexpressed proteins, anti-PTB to detect the knockdown levels and anti-actin to confirm protein loading. A titration of control sample (lane 1—12.5%, lane 2—25%, lane 3—50% and lane 4—100%) is also included to assess the levels of knockdown. The band present above the PTB doublet in lane 6 is FLAG-tagged PTB.
F, G RT–PCR analysis using primers specific to the ST7 exon 11 (F) and ABI2 exon 8 (G) splicing reporters, respectively, of samples where Matrin3 or PTB expression vectors were co-transfected, in control siRNA and PTB/nPTB siRNA-transfected cells. Quantification of at least three replicates for each condition is shown as a histogram of the percentage of exon inclusion. *P < 0.01 when compared with control sample in each condition (-).
References
-
- Barash Y, Calarco JA, Gao W, Pan Q, Wang X, Shai O, Blencowe BJ, Frey BJ. Deciphering the splicing code. Nature. 2010;465:53–59. - PubMed
-
- Bernert G, Fountoulakis M, Lubec G. Manifold decreased protein levels of matrin 3, reduced motor protein HMP and hlark in fetal Down's syndrome brain. Proteomics. 2002;2:1752–1757. - PubMed
Publication types
MeSH terms
Substances
Grants and funding
LinkOut - more resources
Full Text Sources
Other Literature Sources
Research Materials
Miscellaneous
