. 2015 Mar 26;519(7544):460-3.
doi: 10.1038/nature14030. Epub 2015 Jan 19.

A temporal shift in the circuits mediating retrieval of fear memory

Affiliations

A temporal shift in the circuits mediating retrieval of fear memory

Fabricio H Do-Monte et al. Nature. .

Abstract

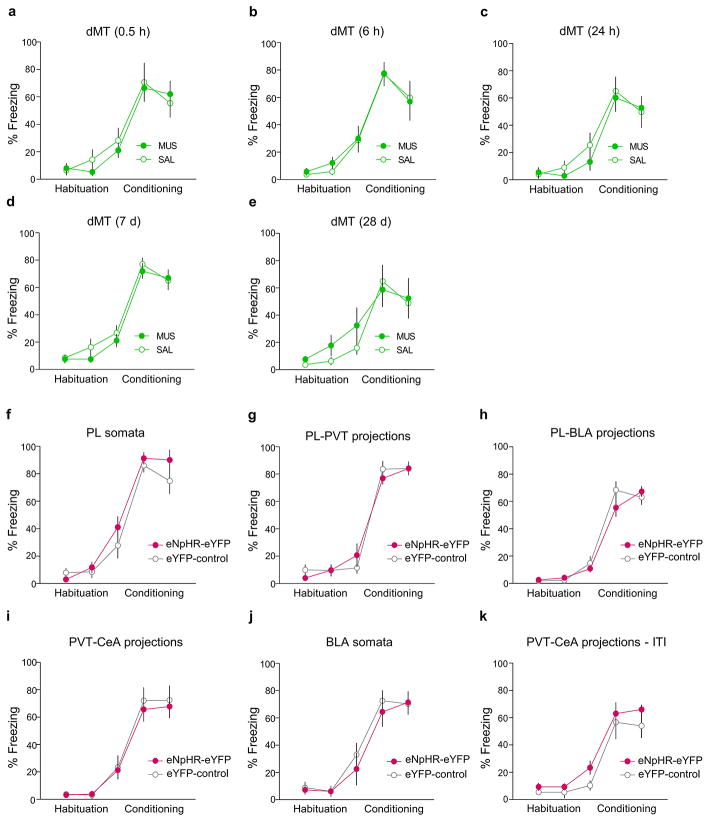
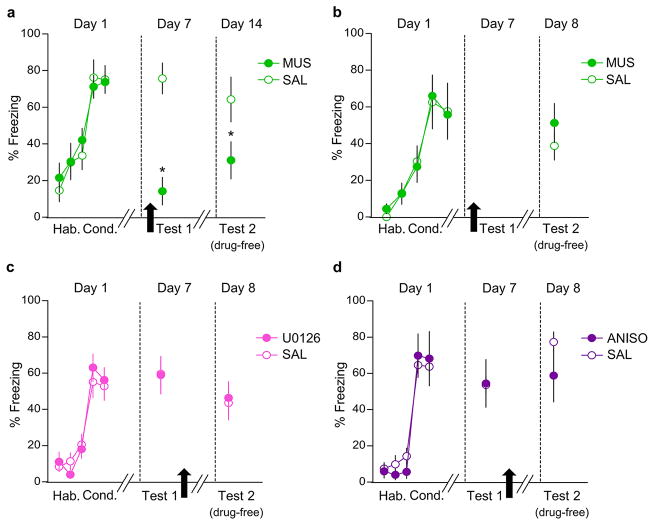
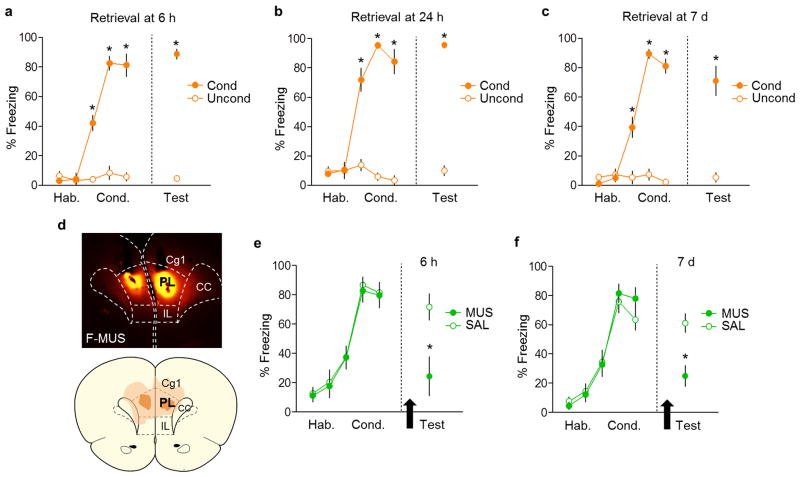
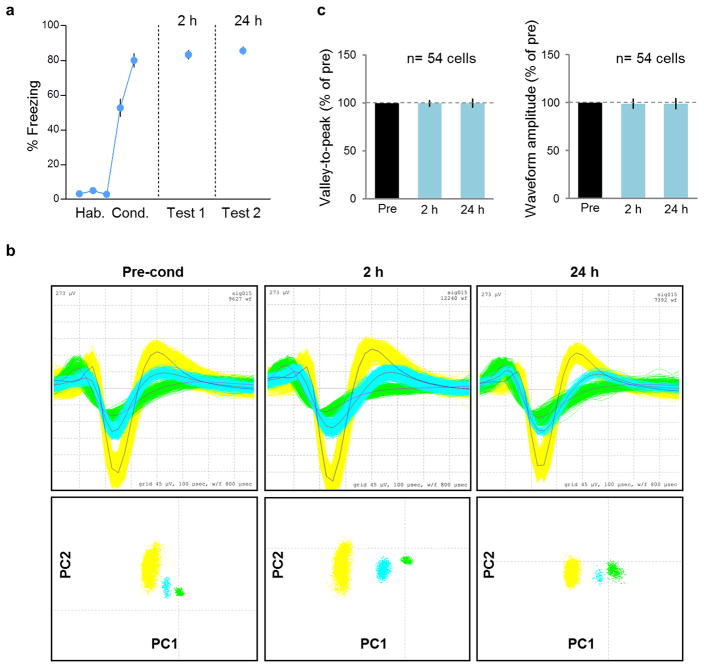
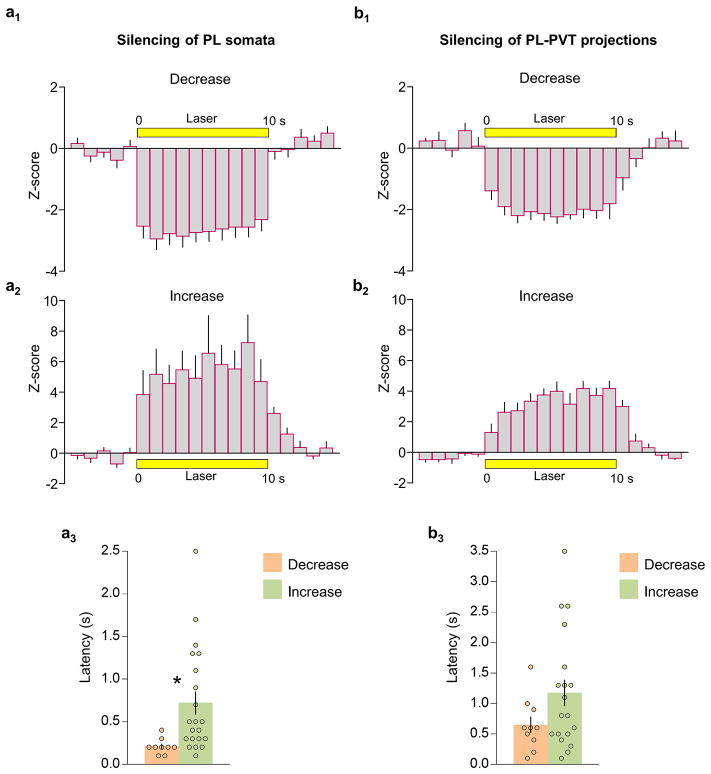
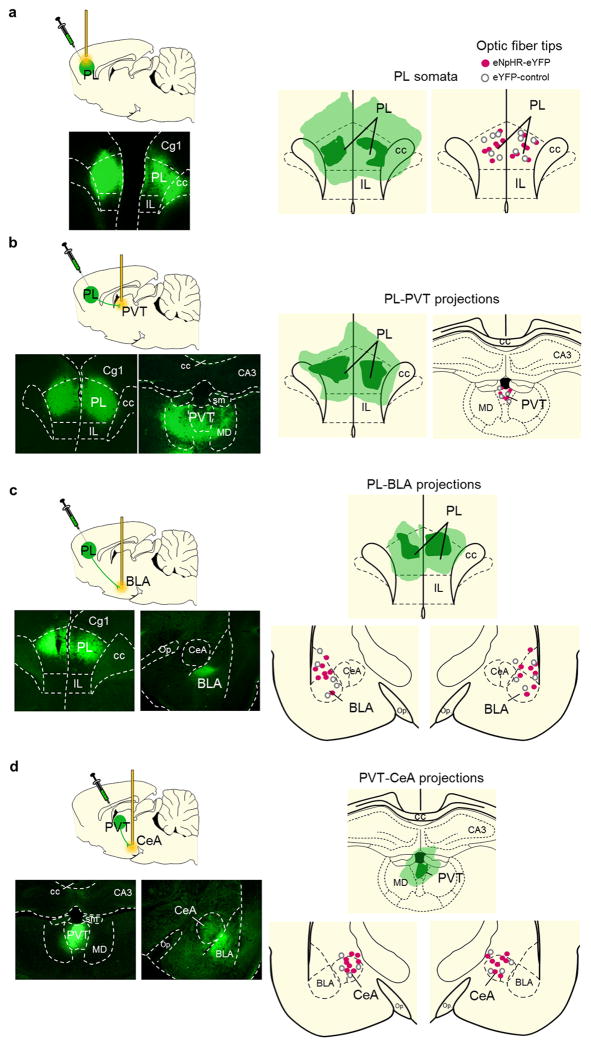
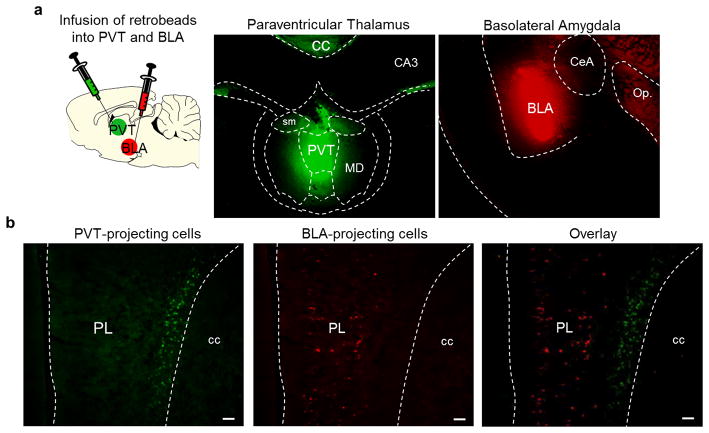
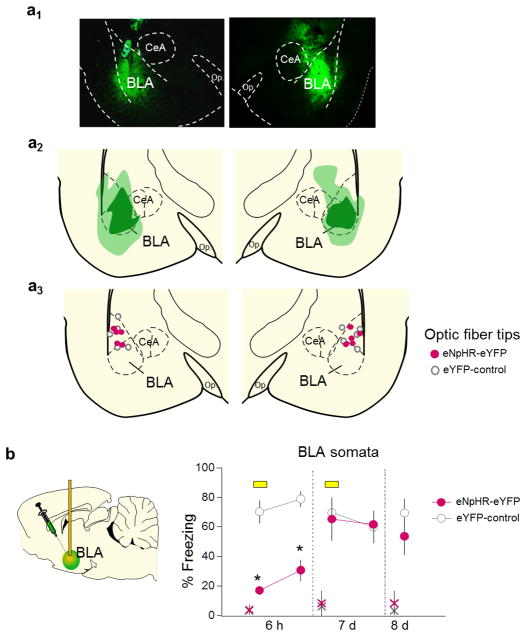
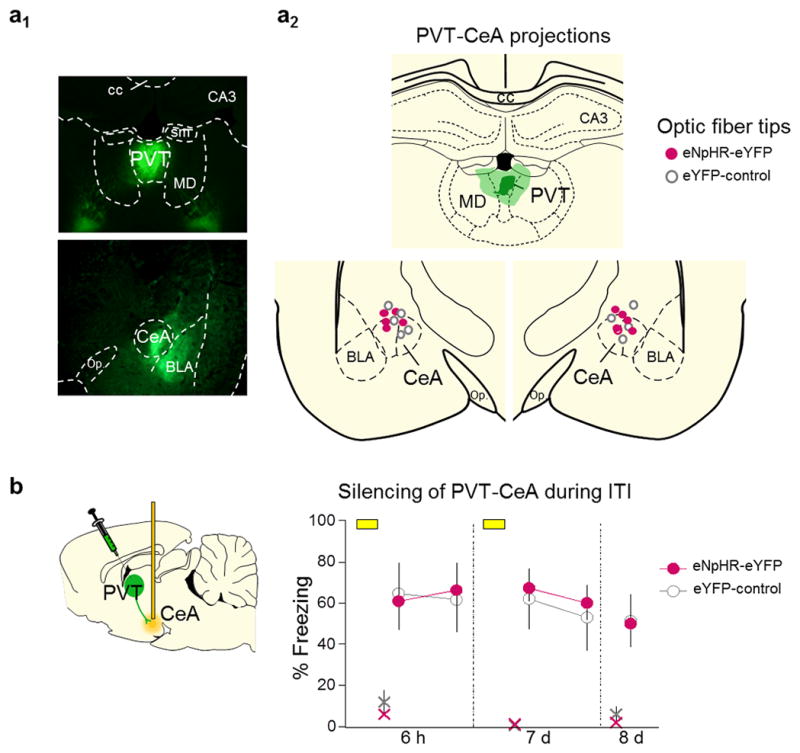
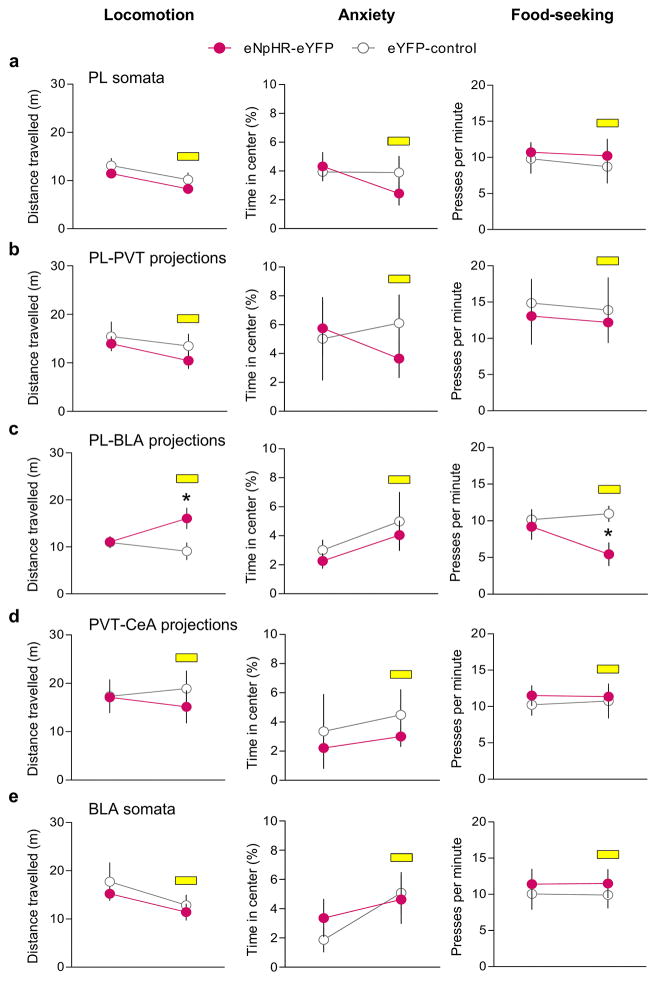
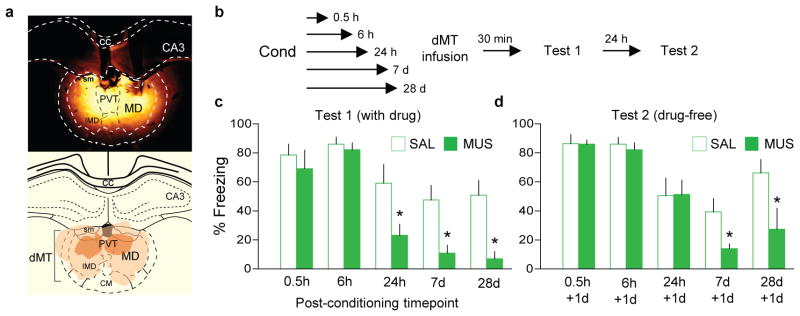
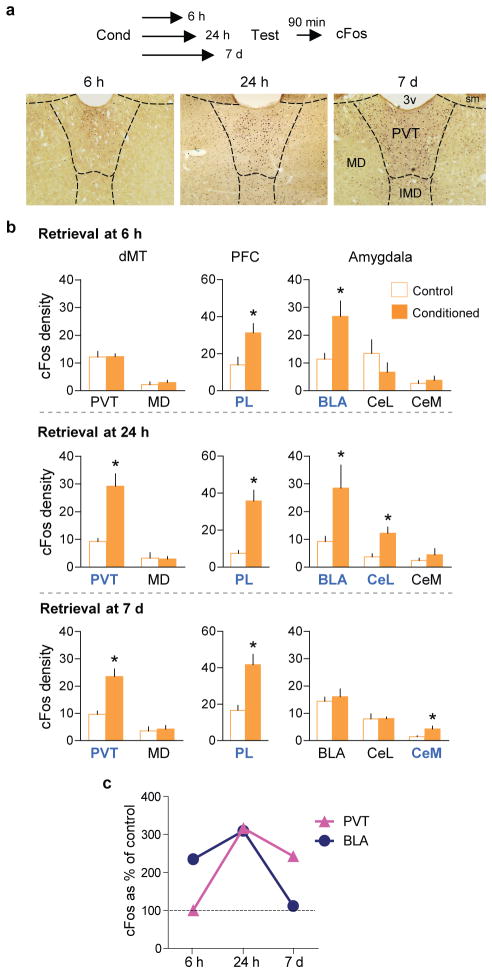
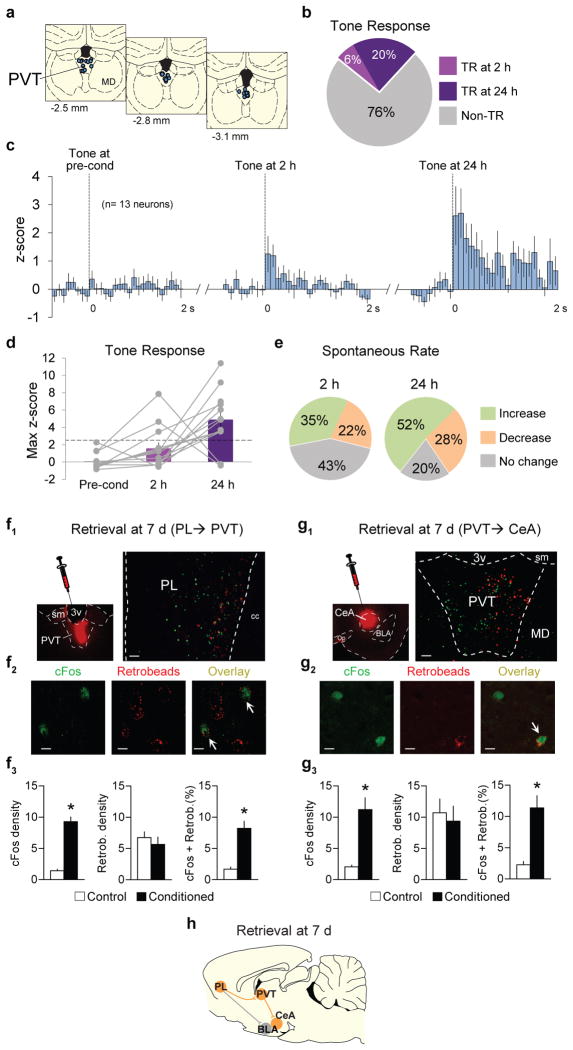
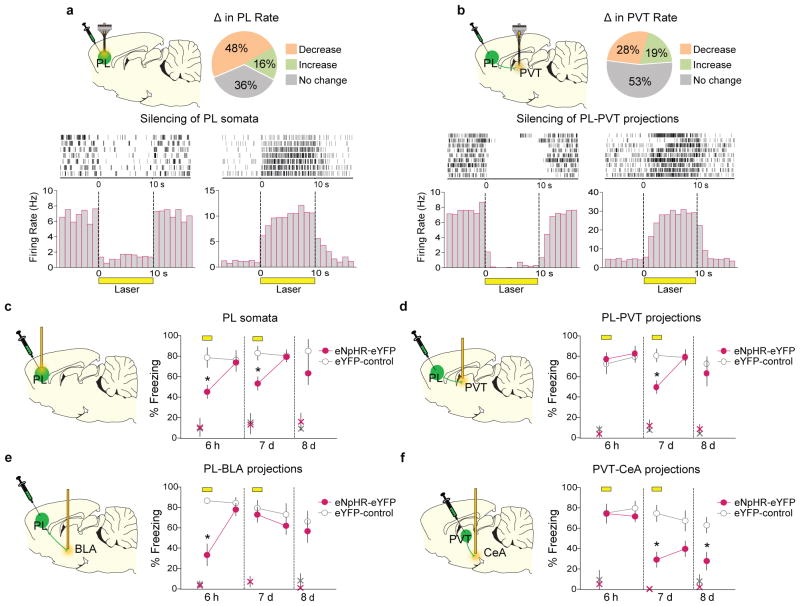
Fear memories allow animals to avoid danger, thereby increasing their chances of survival. Fear memories can be retrieved long after learning, but little is known about how retrieval circuits change with time. Here we show that the dorsal midline thalamus of rats is required for the retrieval of auditory conditioned fear at late (24 hours, 7 days, 28 days), but not early (0.5 hours, 6 hours) time points after learning. Consistent with this, the paraventricular nucleus of the thalamus (PVT), a subregion of the dorsal midline thalamus, showed increased c-Fos expression only at late time points, indicating that the PVT is gradually recruited for fear retrieval. Accordingly, the conditioned tone responses of PVT neurons increased with time after training. The prelimbic (PL) prefrontal cortex, which is necessary for fear retrieval, sends dense projections to the PVT. Retrieval at late time points activated PL neurons projecting to the PVT, and optogenetic silencing of these projections impaired retrieval at late, but not early, time points. In contrast, silencing of PL inputs to the basolateral amygdala impaired retrieval at early, but not late, time points, indicating a time-dependent shift in retrieval circuits. Retrieval at late time points also activated PVT neurons projecting to the central nucleus of the amygdala, and silencing these projections at late, but not early, time points induced a persistent attenuation of fear. Thus, the PVT may act as a crucial thalamic node recruited into cortico-amygdalar networks for retrieval and maintenance of long-term fear memories.


Conflict of interest statement

The authors declare no competing financial interests.

Figures

Extended Data Fig. 1
Extended Data Fig. 1. Conditioning levels in muscimol and optogenetic experiments
In the muscimol experiments, levels of freezing to tones (pre-treatment) for the habituation phase (first two blocks) and conditioning phase (last three blocks) were similar for saline (SAL, white circles) and muscimol (MUS, green circles) groups at 0.5 h (a), 6 h (b), 24 h (c), 7 d (d) and 28 d (e). In the optogenetic experiments, freezing levels were similar for the eNpHR-eYFP groups (red circles) and the control groups (white circles) prior to manipulation of the following regions or pathways: PL-somata (f), PL-PVT projections (g), PL-BLA projections (h), PVT-CeA projections (i), BLA somata (j) and PVT-CeA projections during ITI (k). Data are shown as mean ± SEM in blocks of two trials.
Extended Data Fig. 2
Extended Data Fig. 2. Neural activity in dMT, but not MAP-Kinase cascade or protein synthesis, is necessary for memory maintenance following reactivation
(a) Freezing to tones during habituation (Hab.; first two blocks of day 1), conditioning (Cond.; last three blocks of day 1), test 1 (day 7), and test 2 (drug-free test; day 14) performed 7 days after dMT infusion of saline (SAL, white circles, n= 10) or muscimol (MUS, green circles, n= 14), in rats never given bar-press training. Infusion of MUS into the dMT impaired fear retrieval during test 1 (t= −4.35, P< 0.001), and also one week later during test 2 (t= −2.14, P= 0.04). (b) Freezing to tones during habituation (Hab.; first three blocks of day 1), conditioning (Cond.; last three blocks of day 1) and drug-free test (day 8) performed 24 h after dMT infusion of saline (SAL, n= 5) or muscimol (MUS, n= 7). Rats were infused in their home cage without fear reactivation. MUS infused this way had no effect on fear retrieval the following day (t= −0.88, P= 0.39). (c) Intra-dMT infusion of MAP-Kinase inhibitor U0126 (1 μg/0.5μl/side, n= 11) immediately after a two-tone test on day 7 did not alter freezing levels during a drug-free test performed the following day, compared to a vehicle control (VEH, n= 9, t= 0.37, P= 0.71). (d) Intra-dMT infusion of the protein synthesis inhibitor anisomycin (ANISO, 62.5μg/0.5μl/side, n= 7) immediately after a two-tone test on day 7 did not alter freezing levels during a drug-free test performed the following day, compared to vehicle control (VEH, n= 5, t=1.33, P=0.21). One-way ANOVA repeated measures was used on day 1. Unpaired t-test between SAL and MUS groups were used on days 7, 8, and 14. Data are shown as mean ± SEM in blocks of two trials; *P< 0.05.
Extended Data Fig. 3
Extended Data Fig. 3. Conditioning levels for cFos experiments, and the effects of PL inactivation at early vs. late timepoints
(a) Freezing levels for conditioned (n= 4) and unshocked control (n= 5) groups during fear conditioning and retrieval at 6 h timepoint. The conditioned group showed a significant increase in freezing compared to controls (F(5,35)= 76.12, P< 0.001). (b) Freezing levels for conditioned (n= 3) and control (n= 4) groups during fear conditioning and retrieval at 24 h timepoint. The conditioned group showed a significant increase in freezing compared to controls (F(5,25)= 40.07, P< 0.001). (c) Freezing levels for conditioned (n= 5) and control (n= 6) groups during fear conditioning and retrieval at 7 d timepoint. The conditioned group showed a significant increase in freezing compared to controls (F(5,45)= 49.88, P< 0.001). Rats were sacrificed and perfused for cFos immunocytochemistry 90 min after the fear retrieval test. Repeated-measures ANOVA followed by Tukey post hoc test. (d, upper) Representative micrograph showing the site of fluorescent MUS injection into PL. (d, lower) Orange areas represent the minimum (darker) and the maximum (lighter) spread of muscimol into PL. (e) PL inactivation impaired fear retrieval at 6 h (F(1,11)= 7.92, P= 0.01, SAL: n= 6; MUS: n= 7) (f) In separate animals, PL inactivation also impaired fear retrieval at 7 d after conditioning (F(1,14)= 13.8, P= 0.002, SAL: n= 8; MUS: n= 8). The retrieval test was performed 30 min after infusion of SAL or MUS (black arrows). One-way ANOVA followed by Tukey post hoc test. Data are shown as mean ± SEM in blocks of two trials; *P< 0.05. Legend: Hab= habituation, Cond= conditioning.
Extended Data Fig. 4
Extended Data Fig. 4. Conditioning levels for unit recording experiments, and waveform characteristics across recording sessions
(a) Freezing levels to tones during habituation (first two blocks), conditioning (last three blocks), test 1 (2 h) and test 2 (24 h) in rats never given bar-press training. Rats showed similar levels of freezing during retrieval at 2 h and 24 h after conditioning (n= 11). Data are shown as mean ± SEM in blocks of two trials. (b, top) Waveforms of three representative PVT neurons recorded during pre-conditioning (left), 2 h postconditioning (middle), and 24 h post-conditioning (right). (b, bottom) Principal component analysis of these cells’ waveforms at all three timepoints. (c, left) Average valley-to-peak time, and (c, right) average waveform amplitude for all neurons (n= 54), shown as percent of preconditioning values. 53/54 neurons were unchanged (100% of pre-conditioning value) at both timepoints (2 h, 24 h) for one or both waveform parameters. One neuron showed 90% of preconditioning valley-to-peak time at both 2h and 24h, and ranged from 88–100% of preconditioning amplitude.
Extended Data Fig 5
Extended Data Fig 5. Average firing rate and latency data for laser illumination of PL somata and PL terminals in PVT expressing eNpHR-eYFP
(a1) Average peri-stimulus time histogram (PSTH) of PL neurons that decreased (24 out of 50) or increased (8 out of 50) (a2) their firing rate during laser illumination of PL somata. (a3) Latency of PL neuronal responses to laser illumination of PL somata (Paired Student’s t-test, P= 0.02). (b1) Average PSTH of PVT neurons that decreased (13 out of 47) or increased (9 out of 47) (b2) their firing rate during laser illumination of PL terminals in PVT. (b3) Latency of PVT neuronal responses to laser illumination of PL terminals in PVT (Paired Student’s t-test, P= 0.11). PSTHs are shown in bins of 1 s. Response latency was measured in bins of 100 ms; *P< 0.05.
Extended Data Fig. 6
Extended Data Fig. 6. Location of eNpHR-eYFP expression and optical fibers
(a, left) Representative micrograph showing eNpHR-eYFP expression in PL. (a, right) Placements of optic fiber tips in PL. (b, left) Representative micrograph showing the expression of eNpHR-eYFP in PL and its terminals in dMT. (b, right) Placement of optic fiber tips in PVT. (c, left) Representative micrograph showing the expression of eNpHR-eYFP in PL and its terminals in the amygdala. (c, right) Placement of optic fiber tips in BLA. (d, left) Representative micrograph showing the expression of eNpHR-eYFP in PVT and its terminals in the amygdala. (d, right) Placement of optic fiber tips in CeA. Micrographs were obtained 8–10 weeks after virus infusion. Legend: PL- prelimbic cortex, IL- infralimbic cortex, dMT- dorsal midline thalamus, BLA- basolateral nucleus of the amygdala, PVT- paraventricular thalamus; MD- mediodorsal thalamus, CeA- central nucleus of the amygdala, CA3- hippocampal region, cc- corpus callosum, op.- optical tract.
Extended Data Fig. 7
Extended Data Fig. 7. PL neurons projecting to PVT vs. BLA are located in distinct layers
(a, left) Schematic of retrobead injections. (a, middle) Micrograph showing the site of retrobeads infusion into PVT (green) and BLA (red) (a, right) in the same rat. (b, left) PL neurons retrogradely labeled from PVT infusion (green). (b, middle) PL neurons retrogradely labeled from BLA infusion (red). (b, right) Overlay image showing absence of co-labeling between PL neurons projecting to PVT (green, deep layers) and PL neurons projecting to BLA (red, superficial layers). Scale bar, 100 μm.
Extended Data Fig. 8
Extended Data Fig. 8. Silencing BLA somata impaired fear retrieval at early, but not late, timepoints after conditioning
(a1) Representative micrograph showing eNpHR-eYFP expression in BLA. (a2) Green areas represent the minimum (darker) and the maximum (lighter) expression of eNpHR-eYFP in BLA. (a3) Dots represent the location of optic fiber tips within BLA. (b) Illumination of BLA soma (yellow bar) reduced freezing at 6 h (F(1,9)= 54.6, P< 0.001), but not at 7 d (F(1,9)= 10.1, P= 0.91) or 8 d (P= 0.33), in the eNpHR-eYFP group (n= 5) compared to eYFP-control group (n= 6). Repeated-measures ANOVA followed by Tukey post hoc test. Data are shown as mean ± SEM in blocks of 2 trials; *P< 0.05. Small “x” indicates baseline (pre-tone) freezing levels.
Extended Data Fig. 9
Extended Data Fig. 9. Silencing PVT projections to CeA during the inter-trial interval did not impair fear retrieval
(a1) Representative micrograph showing the expression of eNpHR-eYFP in PVT and its terminals in the amygdala. (a2,upper) Green areas represent the minimum (darker) and the maximum (lighter) expression of eNpHR-eYFP in PVT. (a2, lower) Dots represent the location of optic fiber tips within CeA. (b) Illumination (40 s) of PVT inputs to CeA during the interval between tones (3 min) did not affect freezing at 6 h (F(1,8)= 0.75, P= 0.40), 7 d (F(1,8)= 0.04, P= 0.84), or 8 d (P= 0.93), compared to eYFP-control group (n= 5 per group). Repeated-measures ANOVA followed by Tukey post hoc test. Data are shown as mean ± SEM in blocks of 2 trials; *P< 0.05. Small “x” indicates baseline (pre-tone) freezing levels.
Extended Data Fig. 10
Effects of laser illumination on locomotion, anxiety and food-seeking behavior, in rats expressing eNpHR-eYFP. Rats were tested in an open field during a 9 min session (3 min acclimation, 3 min laser off, 3 min laser on). We measured the total distance travelled (a–e, left) and the percentage of time spent in the center of the apparatus (a–e, middle) to assess locomotor activity and anxiety, respectively. We also compared the rate of pressing for food (a–e, right) in a 15 min session (5 min acclimation, 5 min laser off, 5 min laser on). Silencing of (a) PL somata (eNpHR-eYFP: n= 7, control: n= 5), (b) PL inputs to PVT (eNpHR-eYFP: n= 5; control: n=5), (d) PVT inputs to CeA (eNpHR-eYFP: n= 7, control: n= 5), or (e) BLA somata (eNpHR-eYFP: n= 5, control: n= 6) did not affect locomotion, anxiety or food-seeking. However, silencing (c) PL-BLA projections increased locomotion (F(1,12)= 12.4, P=0.004, eNpHR-eYFP: n= 6, control: n= 8) and decreased food-seeking (F(1,15)= 6.0, P=0.02, eNpHR-eYFP: n= 7, control: n= 10). Repeated measures ANOVA followed by Tukey post hoc test. Data are shown as mean ± SEM; *P< 0.05.
Figure 1
Figure 1. The dorsal midline thalamus (dMT) is necessary for retrieval of fear at late, but not early, timepoints after conditioning
(a, upper) Representative micrograph showing the site of fluorescent muscimol (MUS) injection into dMT. (a, lower) Orange areas represent the minimum (dark) and the maximum (light) spread of muscimol into dMT. (b) Experimental design. (c, left) Freezing to conditioned tones after infusion of saline (SAL, white bars) or MUS (green bars) at different post-conditioning timepoints. MUS impaired freezing (F(4,73)= 3.31, P= 0.01) at 24 h (P= 0.002, n= 8 per group), 7 d (P= 0.002, n= 14 per group) and 28 d (P< 0.001, n= 10 for SAL group, n= 6 for MUS group), but not at 0.5 h or 6 h (P’s > 0.99, n= 6 per group). (c, right) The following day, persistent attenuation of freezing (F(2,54)= 4.78, P= 0.011) was observed at 7 d (P= 0.013) and 28 d (P= 0.04), but not at 24 h (P= 0.35). Two-way ANOVA followed by Tukey post hoc test. Data are shown as mean ± SEM in blocks of two trials; *P < 0.05.
Figure 2
Figure 2. cFos expression induced by fear retrieval at different timepoints after conditioning
(a, upper) Schematic for cFos experiments. (a, lower) Micrographs showing cFos expression in dMT in the conditioned groups following fear retrieval at 6 h, 24 h, and 7 d timepoints. (b, upper) Fear retrieval at 6 h (n= 4–5 per group) increased the number of cFos positive neurons (per 0.1 mm2) in the prelimbic prefrontal cortex (PL; P= 0.03, t= 2.65) and basolateral nucleus of the amygdala (BLA; P= 0.02, t= 2.85), but not in the paraventricular nucleus of the thalamus (PVT; P= 0.96, t= 0.04). (b, middle) Fear retrieval at 24 h (n= 3–4 per group) increased the number of cFos positive neurons in PL (P= 0.002, t= − 5.43), PVT (P= 0.007, t= 3.22), BLA (P= 0.04, t= −2.67) and lateral portion of the central nucleus of the amygdala (CeL; P= 0.01, t= −3.80). (b, lower) Fear retrieval at 7 d (n= 5–6 per group) increased the number of cFos positive neurons in PL (P= 0.002, t= 4.21), PVT (P< 0.001, t= 4.83) and medial portion of the central nucleus of the amygdala (CeM; P= 0.02, t= 2.69). (c) cFos levels (as percentage of control) in PVT and BLA following fear retrieval at 6 h, 24 h and 7 d timepoints. Data are shown as mean ± SEM; Unpaired t-test between control and conditioned groups; *P < 0.05.
Figure 3
Figure 3. Time-dependent increases in tone responses of PVT neurons following fear conditioning
(a) Diagram of recording placements in PVT. Coordinates from bregma. (b) Percentage of tone responsive (TR) neurons at 2 h and 24 h following conditioning (n= 54 neurons, 6% tone responsive at 2 h, 20% tone responsive at 24 h, Fisher exact test, P= 0.04). (c) Average peri-stimulus time histograms of all PVT neurons that were significantly tone responsive at either 2 h or 24 h after conditioning (n=13 neurons). (d) Maximum z-score for group data (bars) or individual data (gray lines, n=13 neurons). Dashed line indicates a z-score criterion of 2.58. (e) Changes in spontaneous firing rates of PVT neurons at 2 h (left) and 24 h (right) after conditioning, compared to pre-conditioning. Changes at 24 h were significantly greater than 2 h (n= 54 neurons; 24 h= 80%; 2 h= 57%, Fisher exact test, P= 0.02). (f1,left) Micrograph showing the site of retrobeads infusion into PVT. (f1, right) Micrograph showing PL neurons projecting to PVT (retrogradely labeled, red) expressing immunoreactivity for cFos (green) following fear retrieval at 7 d. Scale bar,100 μm. (f2) Confocal images showing cFos labeling (left), retrobeads labeling (middle), and overlay (right) of PVT-projecting PL neurons (white arrows). Scale bar,10 μm. (f3) Fear retrieval at 7 d increased the number of cFos positive neurons (per 0.1 mm2) in PL (left, P= 0.003, t= 8.74), but the number of retrogradely labeled PL neurons was the same between groups (middle, P= 0.51, t= −0.7). Retrieval increased the percentage of retrogradely labeled PL neurons expressing cFos (right, P= 0.004, t= 4.83; n=3–4 per group). (g1,left) Micrograph showing the site of retrobeads infusion into CeA. (g1,right) Micrograph showing PVT neurons projecting to CeA (retrogradely labeled, red) expressing immunoreactivity for cFos (green) after fear retrieval at 7 d. Scale bar,100 μm. (g2) Confocal images showing cFos labeling (left), retrobeads labeling (middle), and overlay (right) of CeA-projecting PVT neurons (white arrow). Scale bar,10 μm. (g3) Fear retrieval at 7 d increased the number of cFos positive neurons (per 0.1 mm2) in PVT (left, P= 0.03, t= 3.71), but the number of retrogradely labeled PVT neurons was the same between groups (middle, P= 0.79, t= −0.28). Retrieval increased the percentage of retrogradely labeled PVT neurons expressing cFos (right, P= 0.03, t= 3.61; n=2–3 per group). (h) Schematic of potential circuit mediating fear retrieval at 7d timepoint. Data are shown as mean ± SEM; Unpaired t-test between control and conditioned groups; *P < 0.05.
Figure 4
Figure 4. Time-dependent shift of retrieval circuits after conditioning
(a, upper) Changes in PL firing rate with illumination of PL in rats expressing eNpHR-eYFP in PL (n= 50 neurons; 48% decreased, 16% increased; 36% did not change; Unpaired t-test; all P’s < 0.05). (a, lower) Raster plot and peri-stimulus time histogram (PSTH) of representative PL neurons responding to illumination in rats expressing eNpHR-eYFP in PL. PL neurons showed inhibition (left) or excitation (right). (b, upper) Changes in PVT firing rate following illumination of PL terminals in PVT in rats expressing eNpHR-eYFP in PL (n= 47 neurons; 28% decreased, 19% increased; 53% did not change; Unpaired t-test; all P’s < 0.05). (b, lower) Raster plot and PSTH of representative PVT neurons responding to illumination of PL inputs in PVT in rats infused with eNpHR-eYFP in PL. PVT units showed inhibition (left) or excitation (right). (c) Illumination (yellow bar) of PL somata reduced freezing to tones at both 6 h (F(1,10)= 15.1, P= 0.003) and 7 d (F(1,10)= 20.3, P= 0.002) in the eNpHR-eYFP group (n= 7), compared to the eYFP-control group (n= 5). (d) Illumination of PL inputs in PVT significantly reduced freezing at 7 d (F(1,9)= 18.7, P= 0.002), but not 6 h (F(1,10)= 0.06, P= 0.81) (eNpHR-eYFP: n= 7; control: n= 4). (e) Illumination of PL inputs in BLA significantly reduced freezing at 6 h (F(1,16)= 26.0, P< 0.001), but not 7 d (F(1,16)= 0.64, P= 0.43) (eNpHR-eYFP: n= 8; control: n= 10). (f) Illumination of PVT inputs in CeA significantly reduced freezing at 7d (F(1,11)= 11.9, P= 0.005), but not 6 h (F(1,11)= 0.19, P= 0.67) (eNpHR-eYFP: n= 8; control: n= 5). Freezing remained reduced the day following illumination (P= 0.018). Repeated-measures ANOVA followed by Tukey post hoc test. Data are shown as mean ± SEM in blocks of 2 trials; *P< 0.05. Small “x” indicates baseline (pre-tone) freezing levels.

Comment in

References

    1. Jasnow AM, Cullen PK, Riccio DC. Remembering another aspect of forgetting. Front Psychol. 2012;3:175. doi: 10.3389/fpsyg.2012.00175. - DOI - PMC - PubMed
    1. Wiltgen BJ, Tanaka KZ. Systems consolidation and the content of memory. Neurobiol Learn Mem. 2013;106:365–371. doi: 10.1016/j.nlm.2013.06.001. - DOI - PubMed
    1. Sacco T, Sacchetti B. Role of secondary sensory cortices in emotional memory storage and retrieval in rats. Science. 2010;329:649–656. doi: 10.1126/science.1183165. - DOI - PubMed
    1. Restivo L, Vetere G, Bontempi B, Ammassari-Teule M. The formation of recent and remote memory is associated with time-dependent formation of dendritic spines in the hippocampus and anterior cingulate cortex. J Neurosci. 2009;29:8206–8214. doi: 10.1523/JNEUROSCI.0966-09.2009. - DOI - PMC - PubMed
    1. Sierra-Mercado D, Padilla-Coreano N, Quirk GJ. Dissociable roles of prelimbic and infralimbic cortices, ventral hippocampus, and basolateral amygdala in the expression and extinction of conditioned fear. Neuropsychopharmacology. 2011;36:529–538. doi: 10.1038/npp.2010.184. - DOI - PMC - PubMed

Publication types

Substances