. 2015 Mar 26;519(7544):455-9.
doi: 10.1038/nature13978. Epub 2015 Jan 19.

The paraventricular thalamus controls a central amygdala fear circuit

Affiliations

The paraventricular thalamus controls a central amygdala fear circuit

Mario A Penzo et al. Nature. .

Abstract

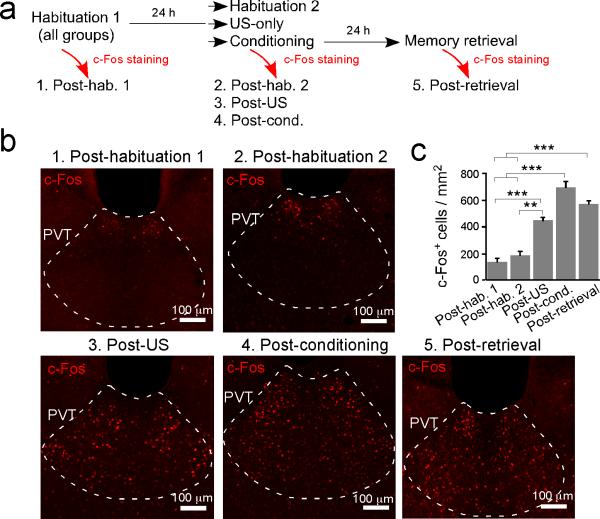
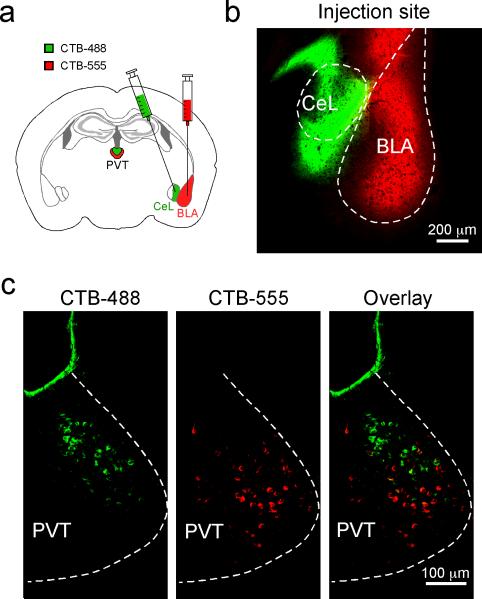
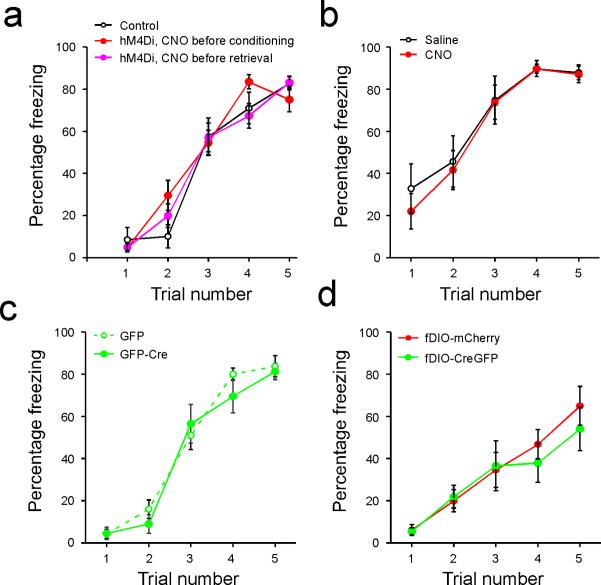
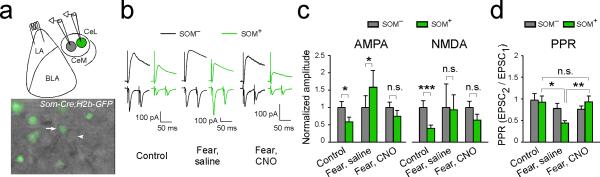
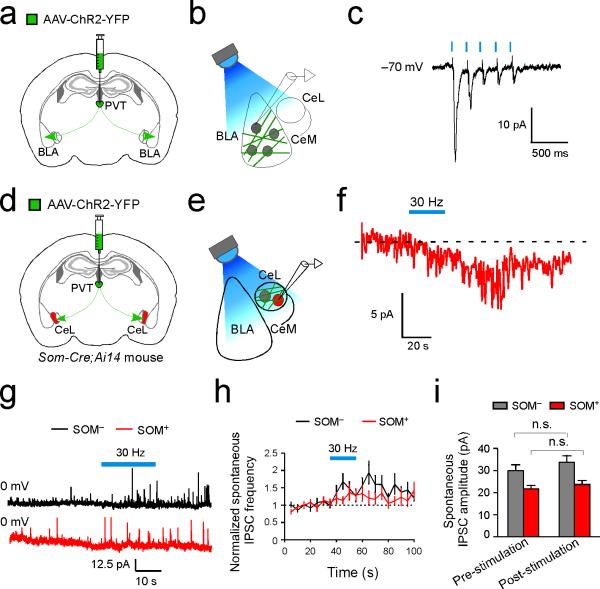
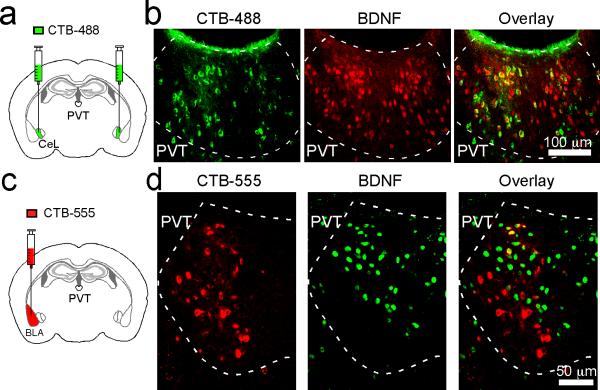
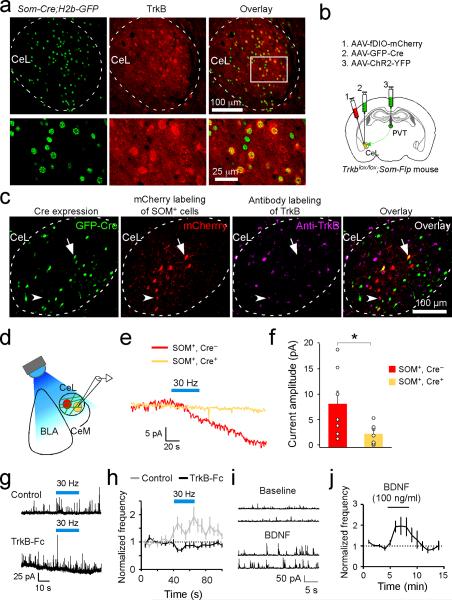
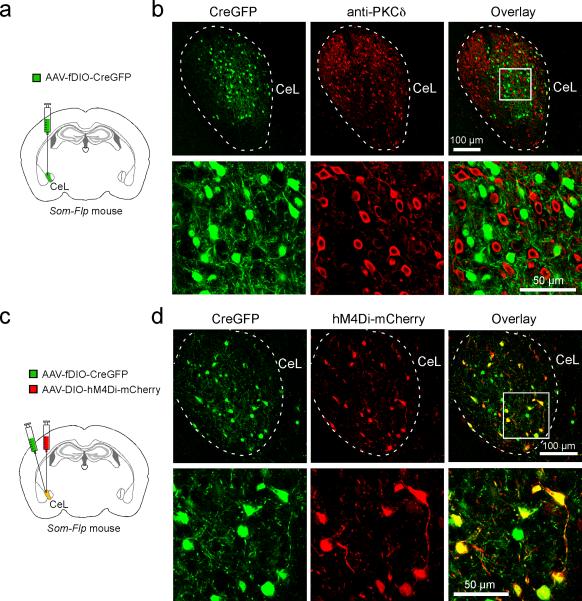
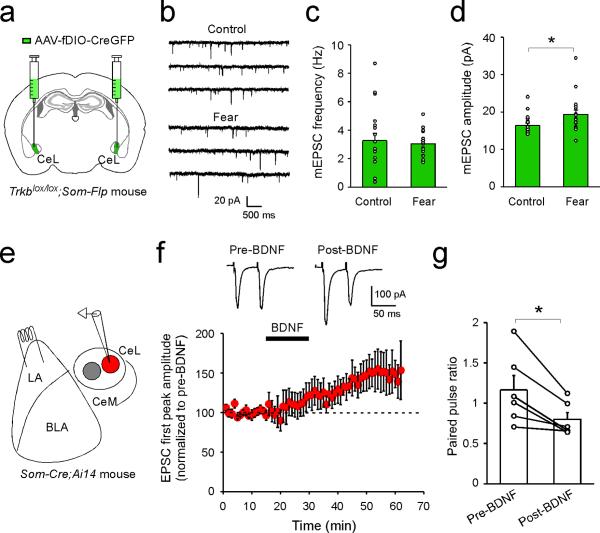
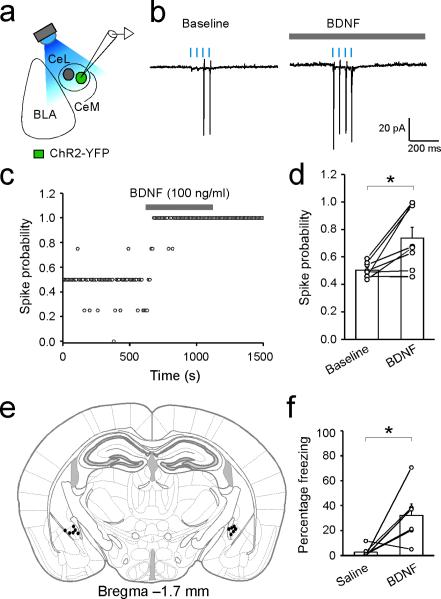
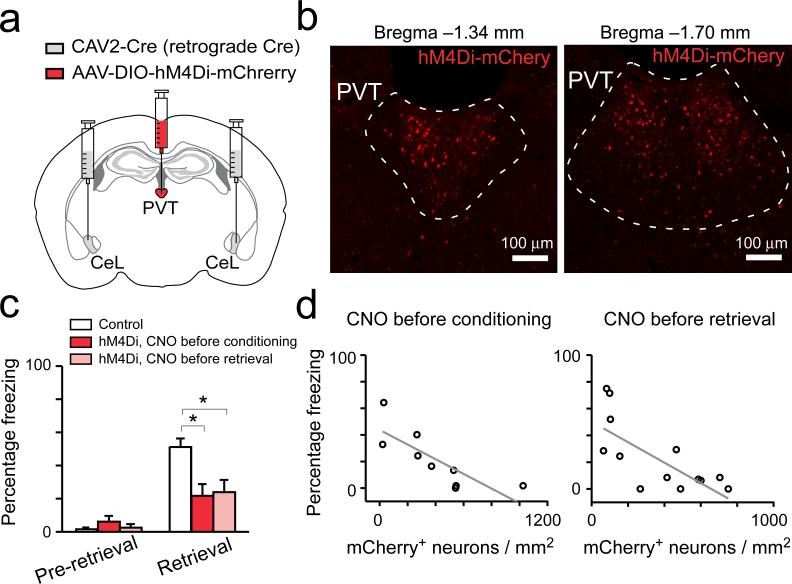
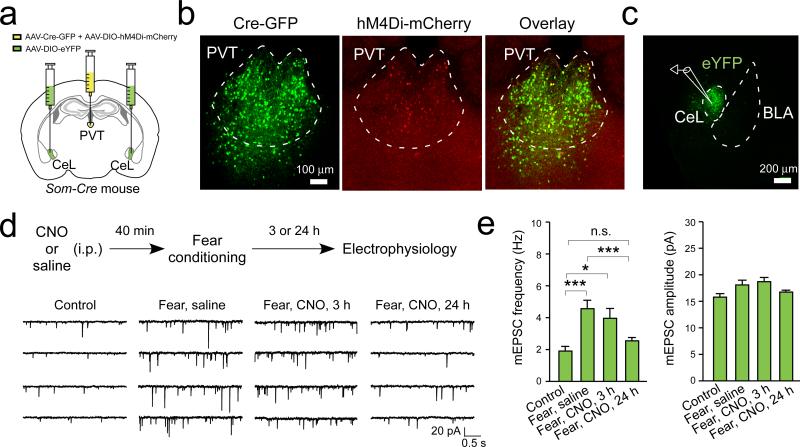
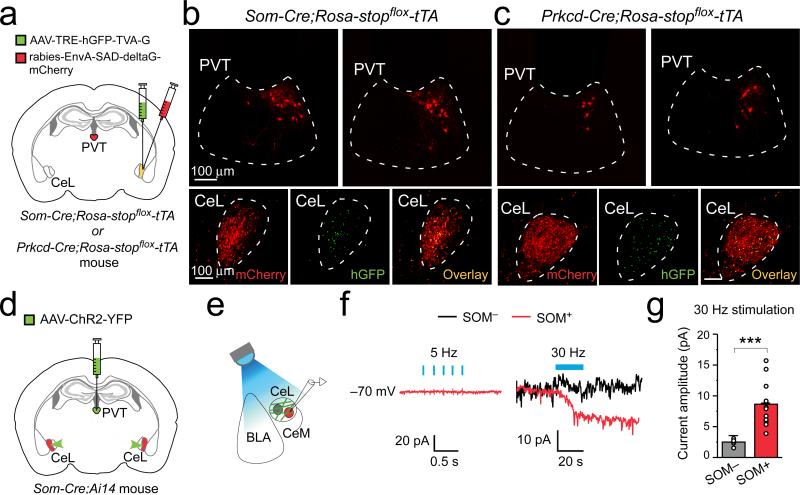
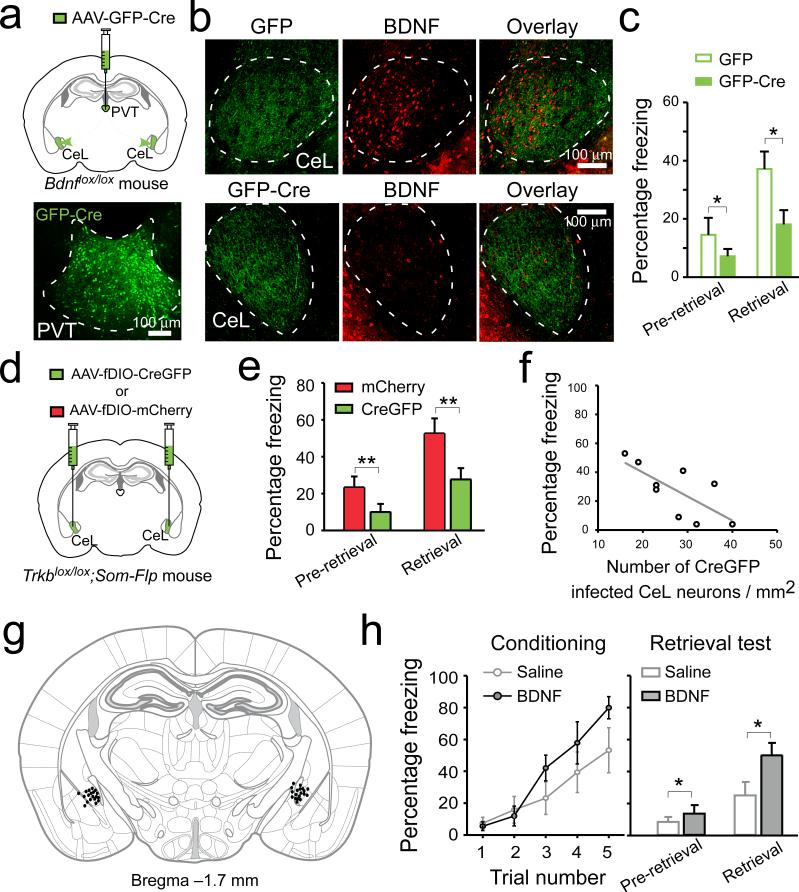
Appropriate responses to an imminent threat brace us for adversities. The ability to sense and predict threatening or stressful events is essential for such adaptive behaviour. In the mammalian brain, one putative stress sensor is the paraventricular nucleus of the thalamus (PVT), an area that is readily activated by both physical and psychological stressors. However, the role of the PVT in the establishment of adaptive behavioural responses remains unclear. Here we show in mice that the PVT regulates fear processing in the lateral division of the central amygdala (CeL), a structure that orchestrates fear learning and expression. Selective inactivation of CeL-projecting PVT neurons prevented fear conditioning, an effect that can be accounted for by an impairment in fear-conditioning-induced synaptic potentiation onto somatostatin-expressing (SOM(+)) CeL neurons, which has previously been shown to store fear memory. Consistently, we found that PVT neurons preferentially innervate SOM(+) neurons in the CeL, and stimulation of PVT afferents facilitated SOM(+) neuron activity and promoted intra-CeL inhibition, two processes that are critical for fear learning and expression. Notably, PVT modulation of SOM(+) CeL neurons was mediated by activation of the brain-derived neurotrophic factor (BDNF) receptor tropomysin-related kinase B (TrkB). As a result, selective deletion of either Bdnf in the PVT or Trkb in SOM(+) CeL neurons impaired fear conditioning, while infusion of BDNF into the CeL enhanced fear learning and elicited unconditioned fear responses. Our results demonstrate that the PVT-CeL pathway constitutes a novel circuit essential for both the establishment of fear memory and the expression of fear responses, and uncover mechanisms linking stress detection in PVT with the emergence of adaptive behaviour.


Figures

Extended Data Figure 1
Extended Data Figure 1. PVT is activated following both fear conditioning and fear memory retrieval
a. A schematic of the experimental design. All mice were sacrificed for the detection of c-Fos at 90 min after the last behavioral session. b. Representative images of c-Fos immunohistochemistry in pPVT for the five groups indicated in a. c. Quantification of c-Fos expression (post-habituation 1 (mice that were subjected to one session of habituation), 131.17 ± 34.25, n = 4 mice; post-habituation 2 (mice that were subjected to two sessions of habituation), 180.68 ± 30.42, n = 5 mice; post-US (mice that were only exposed to five foot shocks), 443.3 ± 25.7, n = 3 mice; post-conditioning, 692.61 ± 46.68, n = 4 mice; post-retrieval, 565.51 ± 28.71, n = 3 mice; F(4,14) = 49.3, P < 0.001; **P < 0.01, ***P < 0.001; one-way analysis of variance (ANOVA) followed by Tukey's test). Data are presented as mean ± s.e.m.
Extended Data Figure 2
Extended Data Figure 2. pPVT neurons projecting to BLA and CeL are non-overlapping
a. A schematic of the approach to simultaneously label BLA- and CeL-projecting pPVT neurons. b. A representative image of the injection sites, where CTB-488 and CTB-555 were injected into CeL and BLA, respectively. c. Representative images of pPVT cells labeled by CTB-488 (left) and CTB-555 (middle). These two populations were largely non-overlapping (right). Data was replicated in 4 mice.
Extended Data Figure 3
Extended Data Figure 3. Performance during conditioning
Freezing levels during conditioning are shown for mice used in Figure 1c (a), Figure 2 (b), Figure 4c (c), and Figure 4e (d). a. There was no significant difference in performance among groups (F(2,155) = 0.51, P > 0.05, two-way ANOVA). b. There was no significant difference in performance between saline-treated mice and CNO-treated mice (F(1,70) = 0.43, P > 0.05, two-way ANOVA). c. There was no significant difference in performance between the two groups (F(1,85) = 0.73, P > 0.05, two-way ANOVA). d. There was no significant difference in performance between the two groups (F(1,75) = 0.45, P > 0.05, two-way ANOVA). Data are presented as mean ± s.e.m.
Extended Data Figure 4
Extended Data Figure 4. pPVT is required for fear conditioning-induced synaptic plasticity in the LA-CeLSOM pathway
a. Top: a schematic of the whole-cell paired-recording configuration. A pair of SOM+ and SOM CeL neurons was simultaneously recorded, and EPSCs were evoked by stimulation of the LA. We used the Som-Cre;H2b-GFP mice, in which the SOM+ neurons were tagged with H2b-GFP and the pPVT neurons were infected with hM4Di as in Figure 2a & b. Bottom: a representative image of a slice used for recording, in which a SOM+ (arrow) and an adjacent SOM (arrowhead) neuron were recorded. b. Sample EPSC traces obtained from the simultaneous paired-recording experiment. Naïve control mice (left) and fear conditioned mice treated with either saline (middle) or CNO (right) were used. Saline or CNO were administered 40 min prior to, and recording were performed 24 hours following conditioning. Upper and lower traces represent EPSCs recorded at +40 mV and –70 mV holding potentials, respectively. c. Quantification of AMPA (left) and NMDA (right) currents (Control, n = 9 pairs (2 mice); “Fear, saline”, n = 8 pairs (3 mice); “Fear, CNO”, n = 14 pairs (3 mice); *P < 0.05, **P < 0.001, n.s., non-significant, paired t test). EPSC values are normalized to the average EPSC value of SOM cells for each group. d. Quantification of paired-pulse ratio (PPR) (see Methods) of EPSCs measured at –70 mV (comparing “control”, “Fear, saline”, and “Fear, CNO” groups for SOM+ neurons: *P < 0.05, **P < 0.01, n.s., non-significant; one-way ANOVA followed by Tukey's test). Control mice for all experiments were injected with the same viral vectors as the experimental groups. Data are presented as mean ± s.e.m.
Extended Data Figure 5
Extended Data Figure 5. A different mode of communication at the pPVT– CeL pathway compared with the pPVT–BLA pathway
(ac) Optogenetic stimulation of pPVT afferents in BLA drives fast synaptic transmission onto BLA neurons. a & b. Schematics of the experimental approach. c. Sample trace (average of 20) of the synaptic responses onto a BLA neuron following brief (5-Hz 1-ms pulses) photo-stimulation of pPVT afferents expressing ChR2. Similar responses were observed in 5 out of 6 BLA neurons recorded. Data was obtained from the same mice as those in Fig. 3d–g. (df) Slow recovery of the pPVT-driven current in a SOM+ CeL neuron. d & e. Schematics of the experimental approach. f. Sample trace of the synaptic response onto a SOM+ neuron following prolonged (30-Hz 1-ms pulses for 20 s) photo-stimulation of pPVT afferents expressing ChR2, showing slow recovery after stimulus offset. (gi) Optogenetic stimulation of the pPVT–CeL pathway promotes intra-CeL inhibition. g. Representative traces of IPSCs onto SOM (black) and SOM+ (red) CeL neurons. Blue bar indicates the 30-Hz photo-stimulation of pPVT afferents. h. Quantification of IPSC frequency, comparing pre- and post-photostimulation (SOM, n = 14 neurons (6 mice), P < 0.001, t test; SOM+, n = 11 neurons (6 mice), P > 0.05, t test). i. Quantification of IPSC amplitude, comparing pre- and post-photostimulation (n.s., non-significant (P > 0.05), paired t test). Data are presented as mean ± s.e.m.
Extended Data Figure 6
Extended Data Figure 6. CeL-projecting neurons in pPVT express BDNF
a. A schematic of the experimental approach to retrogradely label CeL-projecting pPVT cells. b. Representative images of pPVT cells, which were labeled by CTB (left) and an antibody recognizing BDNF (middle). CTB-labeled neurons largely overlapped with BDNF-positive somatas (see overlay in right). (c, d) BLA-projecting neurons and BDNF-expressing neurons in pPVT are largely non-overlapping. c. A schematic of the method used to label BLA-projecting neurons in pPVT. d. Representative images of pPVT cells labeled by either CTB-555 (left) or the antibody recognizing BDNF (middle). These two populations were largely non-overlapping (see overlay in right).
Extended Data Figure 7
Extended Data Figure 7. BDNF/TrkB mediates pPVT–CeL communication
a. The TrkB receptor is selectively expressed by SOM+ CeL neurons. Top,representative images of CeL in Som-Cre;H2b-GFP mice, showing SOM+ neurons tagged with H2b-GFP (left) and TrkB expression recognized by an antibody (middle). Bottom, higher-magnification images of the boxed area in the top panel. TrkB labeled cells largely overlap with SOM+ neurons (see overlay on right). (bf) TrkB mediates the pPVT–CeL transmission. b. A schematic of the experimental approach using the Trkblox/lox;Som-Flp mice to: 1) tag SOM+ CeL neurons with mCherry; 2) sparsely infect CeL neurons with GFP-Cre to delete Trkb; and 3) express ChR2 in pPVT. c. Representative images resulting from the approach in b, showing CeL neurons expressing (from left to right) Cre-GFP, mCherry, and TrkB. Neurons that expressed both mCherry and GFP-Cre represent SOM+ neurons in which Trkb was deleted (arrow; see overlay in right), whereas neurons that expressed mCherry, but not GFP-Cre, represent SOM+ neurons with intact Trkb (arrowhead; see overlay in right). d. A schematic of the whole-cell recording configuration. e. Sample traces of synaptic currents in mCherry-only (SOM+,Cre; red) and mCherry/GFP-Cre double positive (SOM+,Cre+; yellow) neurons in response to prolonged high frequency stimulation of pPVT afferents. f. Quantification of the synaptic responses (SOM+,Cre, 8.06 ± 2.58 pA, n = 7 neurons (3 mice); SOM+,Cre+, 2.10 ± 0.76 pA, n = 7 neurons (3 mice); *P < 0.05, t test). (gj) The pPVT input to CeL promotes intra-CeL inhibition through BDNF/TrkB signaling. g. Representative traces of IPSCs recorded from SOM CeL neurons in response to the 30-Hz photo-stimulation (Blue bars) of pPVT afferents, in control condition (top panel) or in the presence of the BDNF scavenger TrkB-Fc (bottom panel). h. Quantification of the frequency of IPSCs recorded from SOM CeL neurons (comparing pre- and post-photostimulation: control, n = 14 neurons (6 mice; repetition of data from the SOM cells in Extended Data Fig. 5h), P < 0.001, paired t test; TrkB-Fc, n = 17 neurons (2 mice), P > 0.05, paired t test). i. Representative traces showing the effect of BDNF bath application on spontaneous IPSCs recorded from CeL neurons. j. Quantification of the effect of BDNF on spontaneous IPSC frequency. Black line indicates the timing of BDNF application (n = 7; P < 0.05 comparing baseline and BDNF application, paired t test). Data are presented as mean ± s.e.m.
Extended Data Figure 8
Extended Data Figure 8. Characterization of the AAV-fDIO-CreGFP
a. A schematic of the experimental approach to selectively target SOM+ CeL neurons in the Som-Flp mice with the AAV-fDIO-CreGFP. b. Representative images of CeL neurons expressing CreGFP (left), and PKC-δ+ CeL neurons (as surrogate for SOM neurons) that were recognized by an antibody (middle). In lower panel are high magnification images of the boxed region in the upper panel. These two cell populations were largely non-overlapping (see overlay on right), indicating that the AAV-fDIO-CreGFP selectively infects SOM+ neurons (data from one mouse). c. A schematic of the experimental approach to test the function of AAV-fDIO-CreGFP, whereby the CeL of Som-Flp mice was injected with a mixture of AAV-fDIO-CreGFP and AAV-DIO-hM4Di-mCherry. As the latter virus expresses mCherry in a Cre-dependent manner, observation of selective mCherry expression in GFP+ neurons would indicate that the AAV-fDIO-CreGFP is effective. d. Sample images of CeL neurons expressing CreGFP (left) and mCherry (middle). In lower panel are high magnification images of the boxed region in the upper panel. Essentially, all mCherry+ neurons co-expressed GFP (see overlay on right), indicating selective expression of Cre by the GFP-labeled cells (data from one mouse).
Extended Data Figure 9
Extended Data Figure 9. BDNF/TrkB regulates synaptic plasticity onto SOM+ CeL neurons
(ad) Selective deletion of Trkb in SOM+ CeL neurons impairs fear conditioning-induced synaptic plasticity. a. A schematic of the experimental approach to specifically delete Trkb in SOM+ CeL neurons. b. Representative traces of mEPSCs recorded from SOM+ CeL neurons in which Trkb was deleted, in naïve control (top) and fear-conditioned (bottom) mice. c & d. Deletion of Trkb blocked the fear conditioning-induced increase in mEPSC frequency (Control, n = 19 neurons (3 mice); Fear n = 18 neurons (3 mice); P > 0.05, t test) (c), but not amplitude (Control, n = 19 neurons (3 mice); Fear n = 18 neurons (3 mice); *P < 0.05, t test) (d). (eg) BDNF induces LTP at the LA– CeLSOM synapses. e. A schematic of the whole-cell recording configuration. f. Top: sample EPSC traces recorded before (pre-BDNF) and after (post-BDNF) bath application of BDNF. Bottom: summary plot showing the effect of BDNF on EPSC peak amplitude, for which the first peak in the paired-pulse was measured and normalized to the baseline (that is, the average pre-BDNF amplitude). BDNF significantly enhanced EPSC amplitude (pre-BDNF, 98 ± 1.74%, post-BDNF, 146 ± 17.6%, n = 6 neurons (3 mice), P < 0.05, paired t test). g. BDNF application decreased paired-pulse ratio (PPR) (see Methods) of the EPSCs (pre-BDNF, 1.17 ± 0.18; post-BDNF, 0.80 ± 0.09; n = 6 neurons (3 mice), *P < 0.05, paired t test). Data are presented as mean ± s.e.m.
Extended Data Figure 10
Extended Data Figure 10. Exogenous application of BDNF in CeL increases the excitability of SOM+ neurons and elicits unconditioned freezing response
(ad) BDNF increases the excitability of SOM+ CeL neurons. a. A schematic of the experimental approach, in which photostimulation was used to assess the excitability of SOM+ CeL neurons expressing ChR2. b. Sample traces of photostimulation-evoked spikes recorded in cell-attached mode, before (baseline; left) and after (right) bath application of BDNF (100 ng/ml). Light intensity was adjusted to evoke spikes with ~50% probability at baseline. c. A sample recording, in which the spike probability of a SOM+ CeL neuron was followed before, during, and after BDNF application. d. Quantification of the effect of BDNF on spike probability (baseline, 0.50 ± 0.02; BDNF, 0.74 ± 0.08; n = 8 neurons (4 mice), *P < 0.05, paired t test). (e, f) Infusion of BDNF into CeL elicits unconditioned freezing response. e. Drawing of the cannula sites. Each dot denotes where the tip of the injection cannula was located in each mouse. f. Quantification of freezing levels following CeL infusion of saline and BDNF (saline, 2.93 ± 1.84 %; BDNF, 32.22 ± 9.19 %; n = 6 mice, *P<0.05, paired t test). Data are presented as mean ± s.e.m.
Figure 1
Figure 1. CeL-projecting pPVT neurons are essential for both learning and expression of conditioned fear
a. A schematic of the experimental approach. b. Representative images showing the expression of hM4Di-mCherry in CeL-projecting pPVT neurons. c. Quantification of freezing levels in memory retrieval test (control, n = 15 mice; hM4Di with CNO before conditioning, n = 9 mice; hM4Di with CNO before retrieval, n = 13 mice; effect of treatments, F(2,68) = 5.14, P < 0.01; effect of CS presentation, F(1,68) = 51.27, P < 0.001; interaction, F(2,68) = 7.42, P < 0.01; *P < 0.05; two-way analysis of variance (ANOVA) followed by Tukey's test). The control group contains mice that were injected only with CAV2-Cre bilaterally in CeL and were treated with CNO either before conditioning (n = 7 mice) or before retrieval (n = 8 mice). d. Correlation between viral infection efficiency in pPVT and the behavioral effect (CNO before conditioning, R2 = 0.59, P < 0.01, n = 9 mice; CNO before retrieval, R2 = 0.47, P < 0.05, n = 13 mice; linear regression lines are shown in gray). Data are presented as mean ± s.e.m.
Figure 2
Figure 2. pPVT is required for the maintenance of fear conditioning-induced synaptic plasticity in CeL
a. A schematic of the experimental approach. b. Representative images showing the expression of Cre-GFP and hM4Di-mCherry in pPVT. c. SOM+ (eYFP+) CeL neurons in acute slices were targeted for recording. d. Top: a schematic of the experimental procedure. Bottom, representative traces of mEPSCs recorded from SOM+ CeL neurons in mice of the following groups (from left to right): 1) naïve control; 2) fear conditioned, treated with saline and sacrificed 24 hours following conditioning; 3) fear conditioned, treated with CNO and sacrificed 3 hours following conditioning; and 4) fear conditioned, treated with CNO and sacrificed 24 hours following conditioning. e. Quantification of mEPSC frequency (left) and amplitude (right). Frequency, F(3,89) = 8.4, *P < 0.05, ***P < 0.001, n.s., non-significant (P > 0.05) (Control, n = 16 neurons (3 mice); “Fear, saline”, n = 27 neurons (4 mice); “Fear, CNO, 3 h”, n = 16 neurons (3 mice); “Fear, CNO, 24 h”, n = 34 neurons (3 mice)); Amplitude, F(3,89) = 2.9, P < 0.05 (no significant difference was detected in the post-hoc analysis); one-way ANOVA followed by Tukey's test. Data are presented as mean ± s.e.m.
Figure 3
Figure 3. pPVT neurons preferentially innervate SOM+ cells in CeL
a. A schematic of the experimental approach (see Methods). b & c. Representative images of the tracing result for SOM+ (b) and PKC-δ+ (c) CeL neurons. Upper panels: retrogradely labeled neurons in pPVT. Lower panels: starter neurons in CeL are identified by their co-expression of mCherry (left) and hGFP (middle) (overlay in right). d & e. Schematics of the experimental approach. f. Sample traces of synaptic responses to brief (5-Hz 5-ms pulses; left) or prolonged high frequency (30-Hz 5-ms pulses; right) photostimulation of pPVT afferents. Holding potential was –70 mV. g. Quantification of the synaptic responses induced by the 30-Hz stimulation of pPVT afferents (SOM, n = 7 neurons (5 mice); SOM+, n =12 neurons (5 mice); ***P < 0.001, t test). Data are presented as mean ± s.e.m.
Figure 4
Figure 4. BDNF/TrkB-mediated pPVT–CeL communication is essential for fear conditioning
a. Top: a schematic of the experimental approach. Bottom: a representative image of pPVT infected with AAV-GFP-Cre. b. Representative images of CeL from Bdnflox/lox mice in which the pPVT was injected with either AAV-GFP (upper panels) or AAV-GFP-Cre (lower panels). Mice injected with AAV-GFP-Cre in pPVT showed marked reduction of BDNF labeling in CeL (middle and right panels). c. Deletion of Bdnf in pPVT significantly reduced freezing levels during memory retrieval test (n = 16 mice for both groups; effect of treatments, F(1,60) = 6.91, P < 0.05; effect of CS presentation, F(1,60) = 11.17, P < 0.01; interaction, F(1,60) = 1.34, P > 0.05; *P < 0.05; two-way ANOVA followed by Tukey's test). d. A schematic of the experimental approach. e. Selective deletion of Trkb in SOM+ CeL neurons significantly reduced freezing levels during memory retrieval test (n = 9 and 10 mice for CreGFP and mCherry, respectively; effect of treatments, F(1,30) = 9.59, P < 0.01; effect of CS presentation, F(1,30) = 14.37, P < 0.001; interaction, F(1,30) = 0.88, P > 0.05; **P < 0.01; two-way ANOVA followed by Tukey's test). f. The bilateral infection rate in CeL significantly correlated with freezing levels during retrieval (R2 = 0.44, P < 0.05, n = 9 mice; linear regression is indicated by a gray line). g. Drawing of the cannula sites. Each dot denotes where the tip of the injection cannula was located in each mouse. h. BDNF infusion into CeL promotes fear learning. Left: performance of mice during a mild conditioning procedure (see Methods). BDNF infusion had a trend to improve performance (F(1,55) = 3.65, P = 0.06, two-way ANOVA). Right: BDNF infusion enhanced freezing levels during memory retrieval test (n = 9 and 10 mice for saline and BDNF, respectively; effect of treatment, F(1,34) = 5.63, P < 0.05; effect of CS, F(1,34) = 17.35, P < 0.001; interaction, F(1,34) = 2.44, P > 0.05; *P < 0.05; two-way ANOVA followed by Tukey's test). Data are presented as mean ± s.e.m.

Comment in

References

    1. Spencer SJ, Fox JC, Day TA. Thalamic paraventricular nucleus lesions facilitate central amygdala neuronal responses to acute psychological stress. Brain Res. 2004;997:234–237. - PubMed
    1. Chastrette N, Pfaff DW, Gibbs RB. Effects of daytime and nighttime stress on Fos-like immunoreactivity in the paraventricular nucleus of the hypothalamus, the habenula, and the posterior paraventricular nucleus of the thalamus. Brain Res. 1991;563:339–344. - PubMed
    1. Cullinan WE, Herman JP, Battaglia DF, Akil H, Watson SJ. Pattern and time course of immediate early gene expression in rat brain following acute stress. Neuroscience. 1995;64:477–505. - PubMed
    1. Wilensky AE, Schafe GE, Kristensen MP, LeDoux JE. Rethinking the fear circuit: the central nucleus of the amygdala is required for the acquisition, consolidation, and expression of Pavlovian fear conditioning. J. Neurosci. 2006;26:12387–12396. - PMC - PubMed
    1. Ciocchi S, et al. Encoding of conditioned fear in central amygdala inhibitory circuits. Nature. 2010;468:277–282. - PubMed

Publication types

MeSH terms

LinkOut - more resources