

Growth responses of the mangrove Avicennia marina to salinity: development and function of shoot hydraulic systems require saline conditions
- PMID: 25600273
- PMCID: PMC4332612
- DOI: 10.1093/aob/mcu257
Growth responses of the mangrove Avicennia marina to salinity: development and function of shoot hydraulic systems require saline conditions
Abstract
Background and aims: Halophytic eudicots are characterized by enhanced growth under saline conditions. This study combines physiological and anatomical analyses to identify processes underlying growth responses of the mangrove Avicennia marina to salinities ranging from fresh- to seawater conditions.
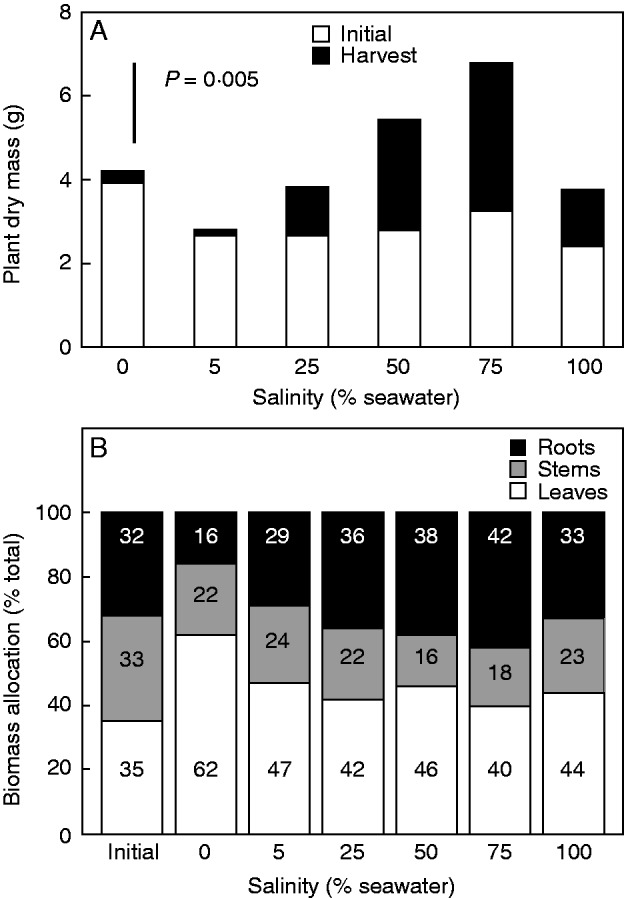
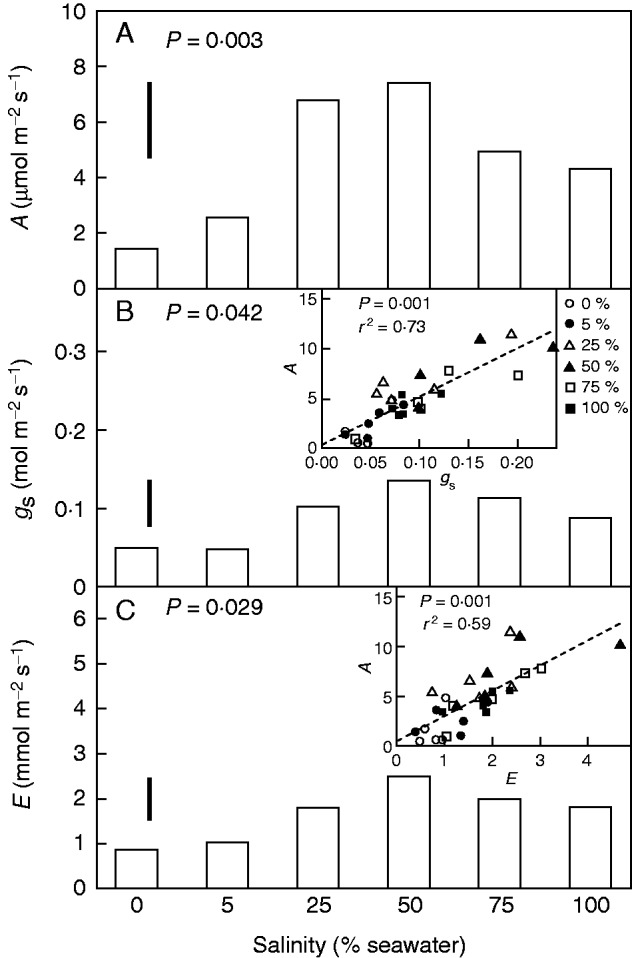
Methods: Following pre-exhaustion of cotyledonary reserves under optimal conditions (i.e. 50% seawater), seedlings of A. marina were grown hydroponically in dilutions of seawater amended with nutrients. Whole-plant growth characteristics were analysed in relation to dry mass accumulation and its allocation to different plant parts. Gas exchange characteristics and stable carbon isotopic composition of leaves were measured to evaluate water use in relation to carbon gain. Stem and leaf hydraulic anatomy were measured in relation to plant water use and growth.
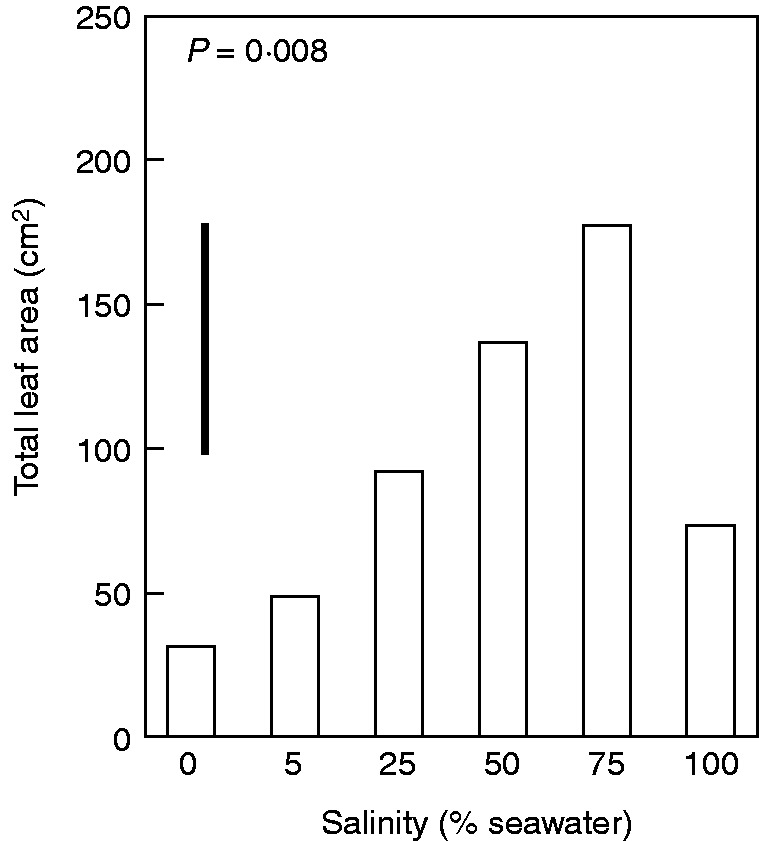
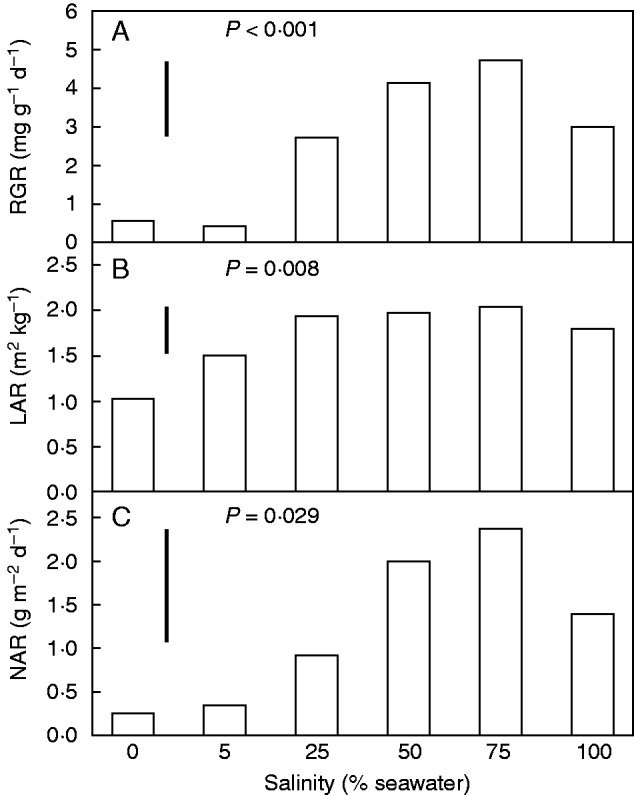
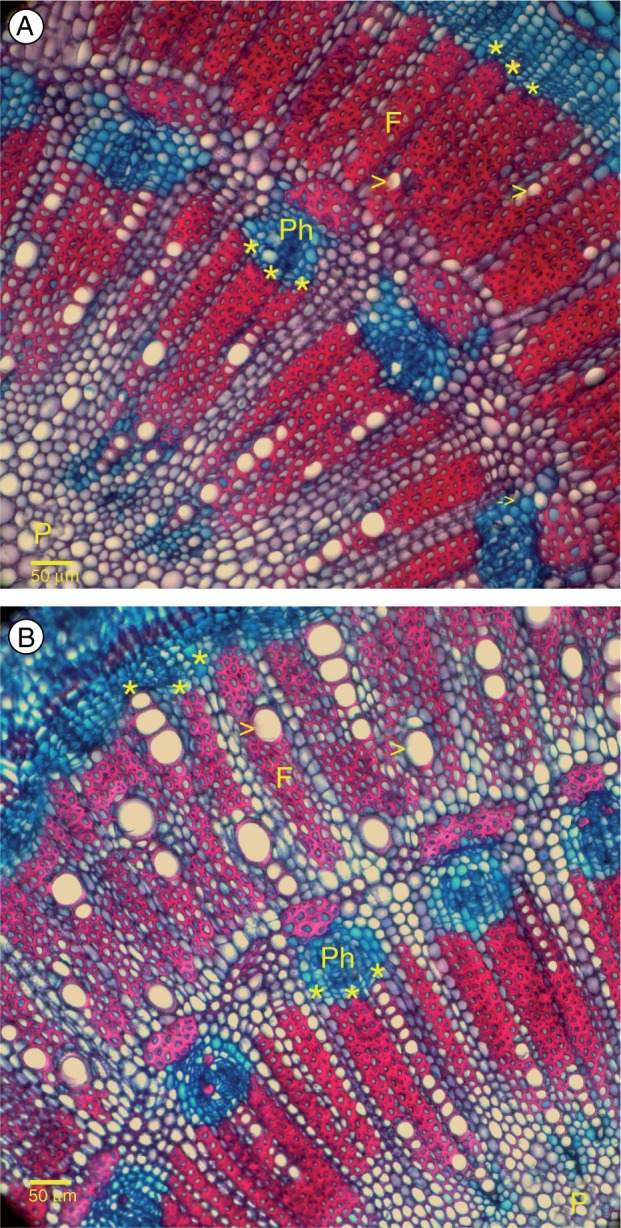
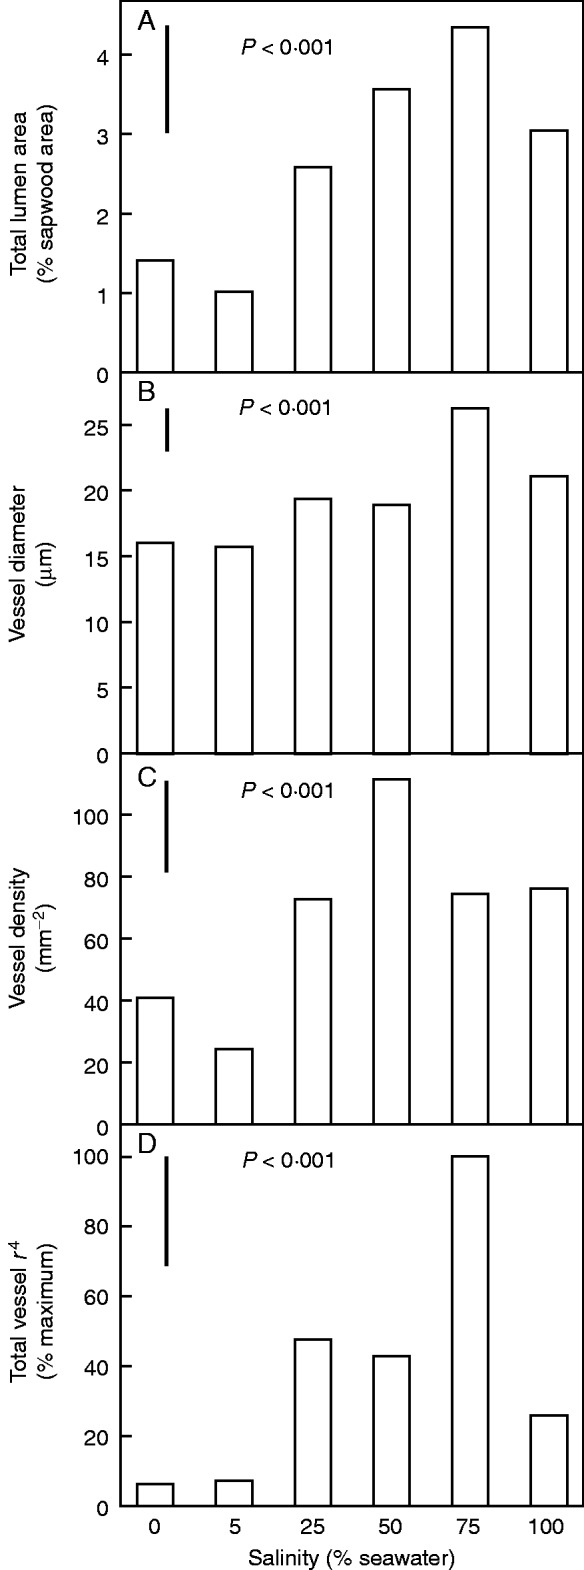
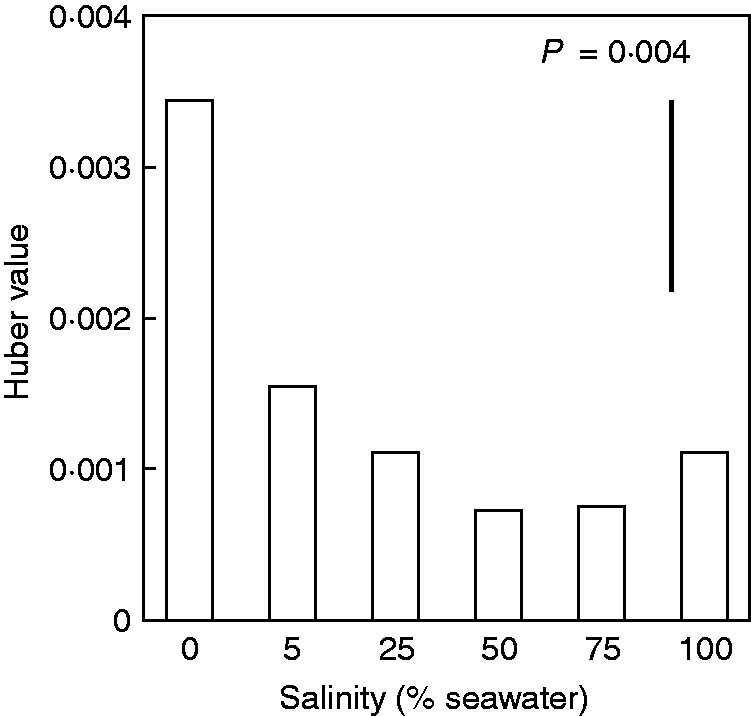
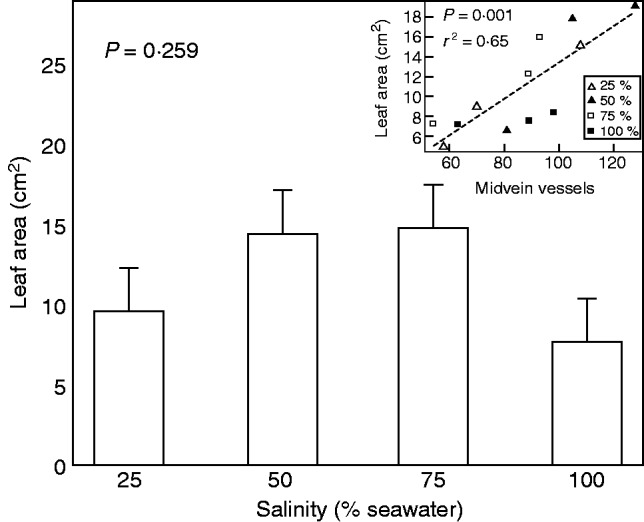
Key results: Avicennia marina seedlings failed to grow in 0-5% seawater, whereas maximal growth occurred in 50-75% seawater. Relative growth rates were affected by changes in leaf area ratio (LAR) and net assimilation rate (NAR) along the salinity gradient, with NAR generally being more important. Gas exchange characteristics followed the same trends as plant growth, with assimilation rates and stomatal conductance being greatest in leaves grown in 50-75% seawater. However, water use efficiency was maintained nearly constant across all salinities, consistent with carbon isotopic signatures. Anatomical studies revealed variation in rates of development and composition of hydraulic tissues that were consistent with salinity-dependent patterns in water use and growth, including a structural explanation for low stomatal conductance and growth under low salinity.
Conclusions: The results identified stem and leaf transport systems as central to understanding the integrated growth responses to variation in salinity from fresh- to seawater conditions. Avicennia marina was revealed as an obligate halophyte, requiring saline conditions for development of the transport systems needed to sustain water use and carbon gain.
Keywords: Avicennia marina; hydraulic anatomy; mangrove; obligate halophyte; plant growth; salinity.
© The Author 2015. Published by Oxford University Press on behalf of the Annals of Botany Company. All rights reserved. For Permissions, please email: journals.permissions@oup.com.
Figures
References
-
- Antunez I, Retamosa EC, Villar R. 2001. Relative growth rate in phylogenetically related deciduous and evergreen woody species. Oecologia 128: 172–180. - PubMed
-
- Ball M. 1988a. Ecophysiology of mangroves. Trees 2: 129–142.
-
- Ball M. 1988b. Salinity tolerance in the mangroves Aegiceras corniculatum and Avicennia marina I. Water use in relation to growth, carbon partitioning, and salt balance. Australian Journal of Plant Physiology 15: 447–64.
-
- Ball M. 1996. Comparative ecophysiology of mangrove forest and tropical lowland moist rainforest. In: Mulkey S, Chazdon R, Smith A, eds. Tropical forest plant ecophysiology. New York: Springer, 461–496.
-
- Ball M. 2002. Interactive effects of salinity and irradiance on growth: implications for mangrove forest structure along salinity gradients. Trees 16: 126–139.
Publication types
MeSH terms
Substances
LinkOut - more resources
Full Text Sources
Other Literature Sources
Miscellaneous
