. 2015 Feb 9;27(2):193-210.
doi: 10.1016/j.ccell.2014.11.017. Epub 2015 Jan 15.

The osteogenic niche promotes early-stage bone colonization of disseminated breast cancer cells

Affiliations

The osteogenic niche promotes early-stage bone colonization of disseminated breast cancer cells

Hai Wang et al. Cancer Cell. .

Abstract

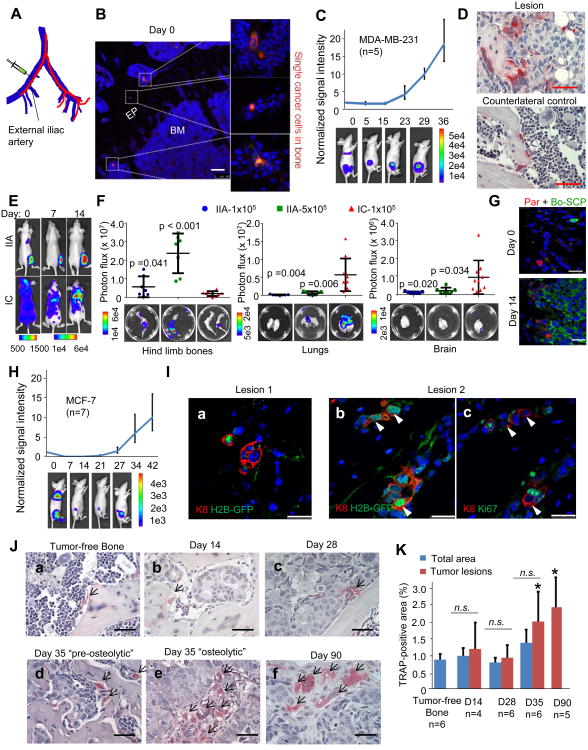
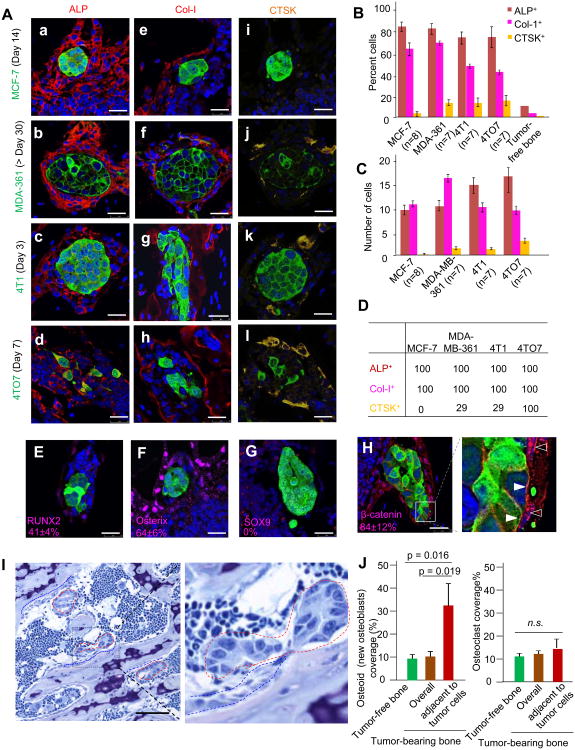
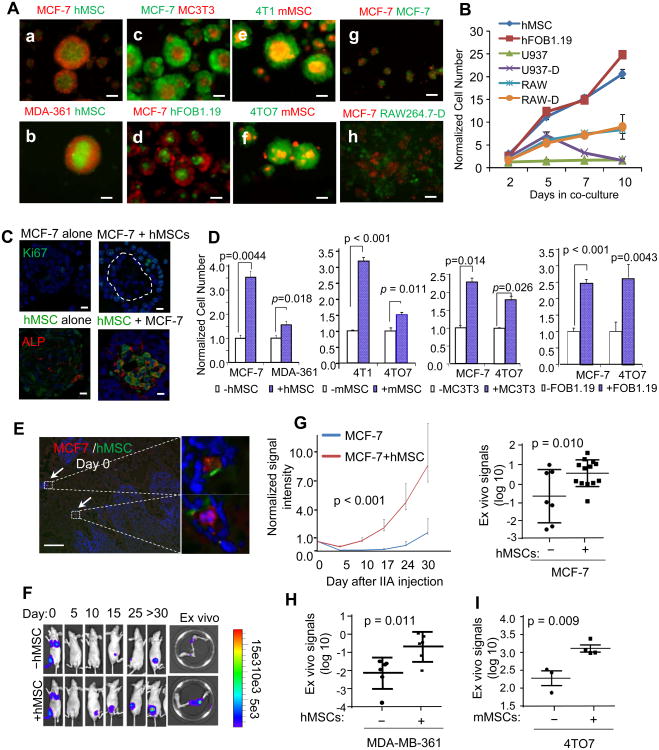
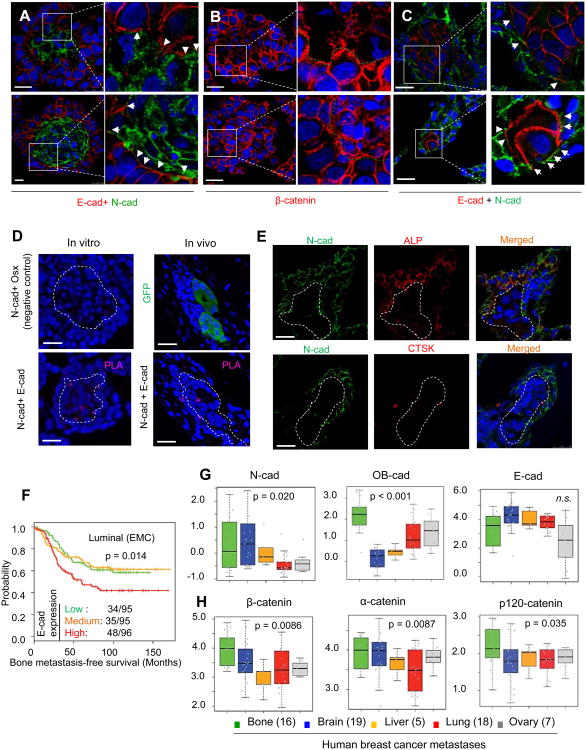
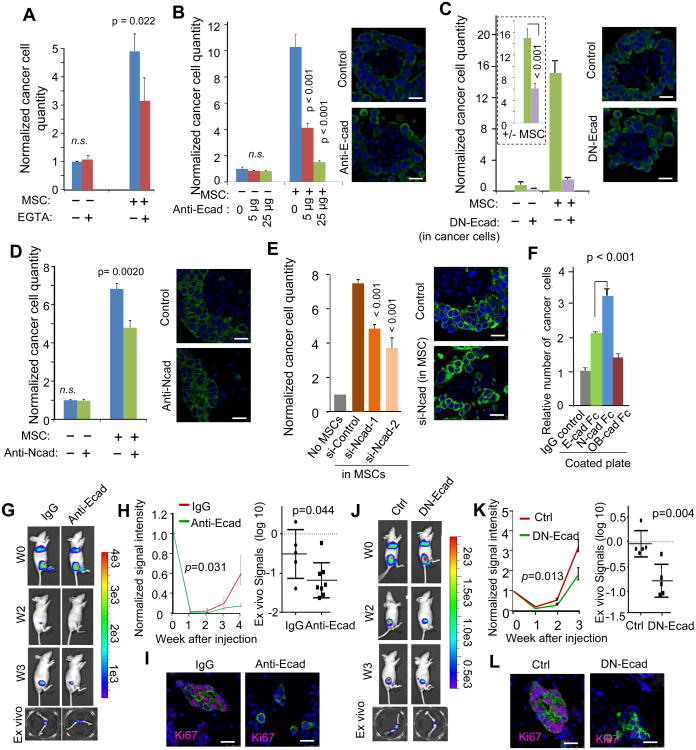
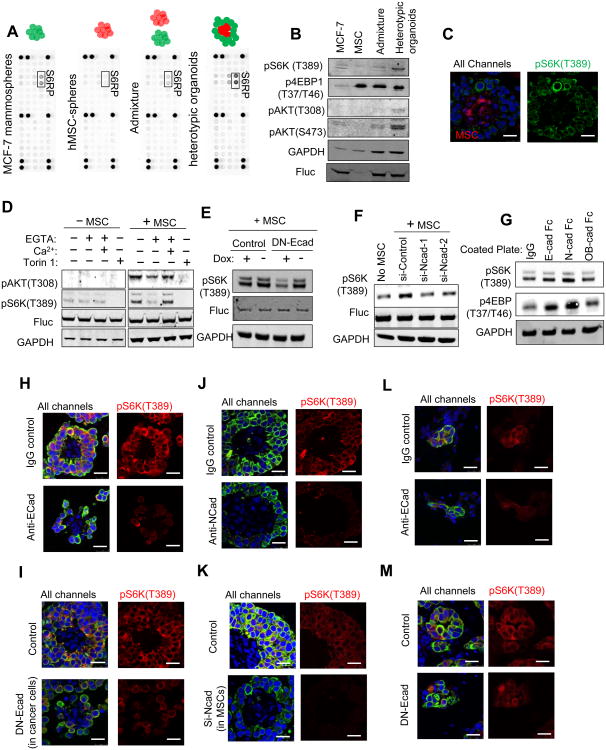
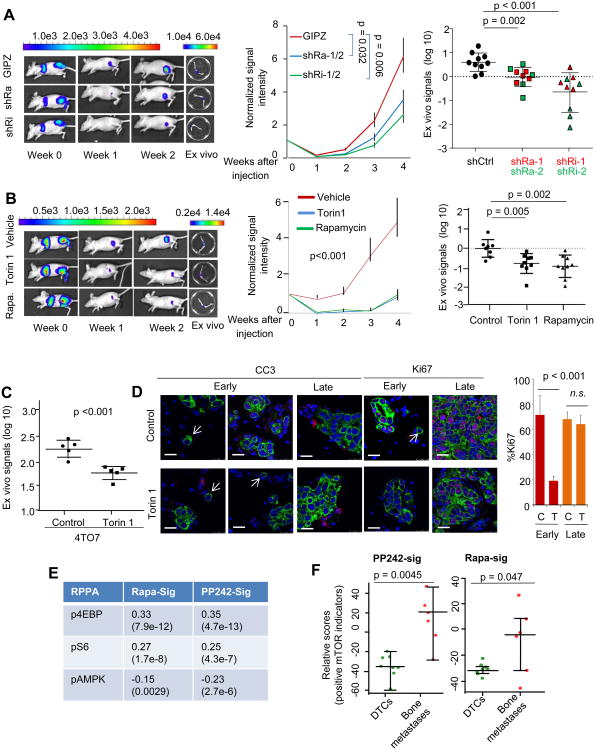
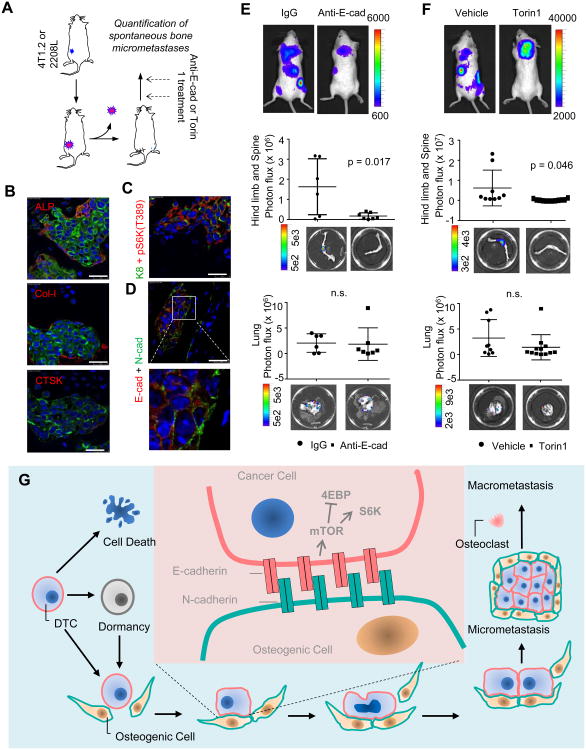
Breast cancer bone micrometastases can remain asymptomatic for years before progressing into overt lesions. The biology of this process, including the microenvironment niche and supporting pathways, is unclear. We find that bone micrometastases predominantly reside in a niche that exhibits features of osteogenesis. Niche interactions are mediated by heterotypic adherens junctions (hAJs) involving cancer-derived E-cadherin and osteogenic N-cadherin, the disruption of which abolishes niche-conferred advantages. We elucidate that hAJ activates the mTOR pathway in cancer cells, which drives the progression from single cells to micrometastases. Human data set analyses support the roles of AJ and the mTOR pathway in bone colonization. Our study illuminates the initiation of bone colonization, and provides potential therapeutic targets to block progression toward osteolytic metastases.


Figures

Figure 1
Figure 1. Intra-Iliac Artery (IIA) Injection to Introduce and Model Indolent Bone Lesions
(A) Diagram illustrates IIA injection. Red and blue lines indicate arteries and veins, respectively. (B) Fluorescence imaging shows RFP-labeled MDA-MB-231 cells in bone 4 hours after IIA injection. Blue: DAPI, Red: RFP. EP: epiphyseal plate, BM: bone marrow. Scale 100 μm. (C) MDA-MB-231 bone colonization kinetics after IIA injection. Top, bone colonization growth curves of a representative experiment of 1 × 10⁵ cells injected. Bottom: representative BL images at indicated time points. Error bars 95% Confidence Interval (C.I.). (D) TRAP staining of the osteolytic bone lesions or counterlateral tumor-free control of MDA-MB-231 IIA model. (E) Representative BL images showing the organ-distribution of MDA-MB-231 cells introduced by IIA vs. IC. (F) Quantification of BL signals from hind limb bones, lungs, and brain, respectively, in animals receiving IIA injection of 1×10⁵ cells (IIA-1×10⁵), IIA injection of 5×10⁵ cell (IIA-5×10⁵), or IC injection of 1×10⁵ cell (IC-1×10⁵). Bottom: ex vivo BL imaging. p values were computed between IIA and IC models. Error bars SD. (G) Bone colonization of admixed MDA-MB-231 parental cells (Par, RFP+) and a bone-tropicsingle cell population (Bo-SCP, GFP+) at indicated time points after IIA injection. (H) Same as (C) except that 2 × 10⁵ MCF-7 cells were examined. Error bars 95% C.I. (I) IF co-staining of Keratin 8 (K8, red) and H2B-GFP (green) (a) and (b), or Ki67 (green) (c) on two MCF-7 bone lesions on Day 14. (b) and (c) are consecutive sections. (J) TRAP staining of normal bone or MCF-7 osteolytic bone lesions after IIA injection. (a) Tumor-free control, (b) Day 14, (c) Day 28, (d) Day 35 “pre-osteolytic”, (e) Day 35 “post-osteolytic”, and (f) Day 90. (K) Quantification of the TRAP staining of different time points after IIA injection. *: TRAP staining coverage is significantly higher in lesions on Day 35 (p=0.01) and Day 90 (p=0.002) than that of tumor-free control. On Day 90, the bone lesions occupied almost all metaphysis area. Error bars SD. Scale 25 μm except (B). See also Figure S1.
Figure 2
Figure 2. The Microenvironment Niche of Microscopic Lesions Is Primarily Comprised of Cells of the Osteoblast Lineage and Exhibits Active Osteogenesis
(A) IF co-staining of cancer cells (green) and ALP (a-d), Col-I (e-h), or CTSK (i-l). Cancer cell lines are indicated to the left of images. Time points are indicated in parentheses. (B) Quantification of indicated cell types in the osteogenic niche. Y axis: percent of indicated cell types that directly contact bone microscopic lesions (first four series) or in tumor-free metaphysis area (the last series). (C) Same as (B) except that the absolute numbers of indicated cell types are quantified. (D) Percent microscopic bone lesions that have in their niche at least two cells of the indicated type directly contacting cancer cells. (E-G) IF staining of RUNX2 (E), Osterix (F) and Sox9 (G) in vicinity of MCF-7 lesions (green) is shown. The frequency of the cells expressing these markers in the microenvironment niche is shown in the corresponding figure in the form of percent ± SD. (H) IF staining MCF-7 cells (green) and β-catenin (red) on bone lesions is shown. Open arrows point to β-catenin staining localized to nucleus, and solid arrows indicate the membrane localization of this protein. (I) Representative picture of toluidine blue staining and bone histomorphometry analysis. Red dotted lines enclose bone lesions, and blue dotted lines indicate osteoid. Scale 50 μm (J) Quantification (n=3 mice) of osteoid (left) and osteoclast (right) coverage based on histomorphometry analyses shown in (I) and Figure S2D, respectively. Error bars SD. Scale 25 μm except (I). See also Figure S2.
Figure 3
Figure 3. Osteogenic Cells Directly Contact Cancer Cells to Confer Proliferative Advantages and Accelerate Bone Colonization
(A)(a-h) Fluorescence imaging of the mammosphere or heterotypic organoid structures in 3D cultures (Day 3). Cell names are indicated in each panel in respective fluorescence colors. (g) the admixture of the same MCF-7 cells tagged with two different colors. hMSC: human MSCs; mMSCs mouse (Balb/c) MSCs; RAW264.7-D: differentiated mouse osteoclasts derived from RAW264.7 cells; hFOB1.19: human osteoblast cell line. Scale 50 μm. (B) Quantification of growth advantages conferred by different cells 3D cultures as a function of time. U937: human monocytes; U937-D: differentiated human monocytes (osteoclasts); RAW264.7: mouse monocytes; RAW264.7-D: differentiated RAW264.7 cells (osteoclast). The data were then normalized to the values of control group for each well (n=3-5). (C) Upper: IF staining of Ki67 on MCF-7 mammospheres and heterotypic organoids (MCF-7+ hMSCs). The dotted line indicates the border between the two cell types. Bottom: IF staining of GFP (green) and ALP (red) on MSC-spheres (GFP-labeled MSCs alone) and the heterotypic organoids (unlabeled MCF-7+GFP-labeled MSCs). Scale 25 μm. (D) Quantification of firefly luciferase-labeled cancer cells (as indicated below the x-axes) with or without co-culturing with equal numbers of osteogenic cells (indicated by white/blue boxes) in 3D cultures. The BL signal intensity was measured on Day 3 to reflect the alteration of cancer cell quantities. The data were then normalized to the values of control group for each well (n=3-5). (E) IF co-staining of RFP (MCF-7 cells) and GFP (hMSCs) within 4 hours after IIA injection. Arrows indicate co-localization of the two cell types. Scale 100 μm. (F) Representative in vivo and ex vivo BL images showing the bone colonization processes at the indicated time points. 2 × 10⁵ MCF-7 cells with or without equal amounts of MSCs were injected. (G) Left: BL signal intensity as a function of time after IIA injection of MCF-7 cells, with or without co-injection of human MSCs (n=7, 13 for mono- and co-injection, respectively). Error bars 95% C.I. Right: Quantification of ex vivo BL signals at the terminal time point. The intensity is normalized to the Day 0 values followed by log-transformation. (H) Same as (G) except that 5 × 10⁵ MDA-MB-361 cells were used for IIA injection. (I) Same as (G) except for 5 × 10³ 4TO7 cells and mouse (Balb/c) MSCs were used for IIA injection. Error bars SD unless otherwise noted. See also Figure S3.
Figure 4
Figure 4. The Heterotypic Adherens Junctions Are Comprised of E-cad of Cancer Cells and N-cads of the Osteogenic Cells
(A) IF co-staining of E-cad and N-cad on heterotypic organoids between MCF-7 cells and MSCs (upper) or osteoblasts (lower) is shown. Signals from three channels (blue=DAPI, green=N-cad,red=E-cad) are merged. Arrows indicate close proximity or overlap between E- and N-cad signals. (B) IF staining of β-catenin (red) on heterotypic organoids between MCF-7 cells and MSCs (upper) or osteoblasts (lower). The green dashed line indicates the border between the two cell types. (C) IF co-staining of E-cad and N-cad on bone lesions of different sizes. Signals are merged from three channels (blue=DAPI, green=N-cad, red=E-cad). Arrows indicate close proximity or overlap between E- and N-cad signals. (D) Proximity Ligation Assays (PLAs) showing the interaction between E-cad and N-cad. Left: PLAs performed on heterotypic organoids in 3D culture. Right: PLAs performed on bone lesions in vivo. Upper left: a negative control experiment using antibodies against N-cad (membrane) and Osterix (nuclear). Lower left: PLA using N-cad and E-cad antibodies. Purple dots indicate successful reactions. Upper right: GFP staining on bone lesions shows the presence of a metastasis. Lower right: PLA using N-cad and E-cad antibodies. Dashed lines indicate the border of cancer cell cores and microscopic lesions. (E) IF staining of N-cad (green) and ALP or CTSK on microscopic bone lesions. MCF-7 lesions are unlabeled but indicated by the dashed line. Signals merged from three channels are shown on the right. Blue=DAPI, green=N-cad, red=ALP (upper) or CTSK (lower). (F) Kaplan-Meier plot of the probability of cumulative bone metastasis-free survival Erasmus (EMC) dataset (GSE5327, GSE2034, and GSE12276) in relationship to the expression of E-cad (CDH1). The numbers of bone metastases and total patients in each group are indicated. p value was calculated by log rank test. (G-H) Box-whisker plots show the relative expression of indicated genes in breast cancer metastases at different anatomical sites. Grey dots superimposed on each box indicate individual specimen. Sample sizes are shown in parentheses. p values are between bone metastases and all other metastases combined. Scale 25 μm. See also Figure S4.
Figure 5
Figure 5. Disruption of the Heterotypic Adherens Junctions Abolishes the Promoting Effects of the Osteogenic niche
(A) Quantification of firefly luciferase-labeled MCF-7 cells cultured with or without equal amount of MSCs in 3D cultures under treatments of 1mM EGTA. EGTA treatment started on Day 0. BL signals were measured on Day 3 and normalized to untreated MCF-7 cells without MSCs (n=3-5). p values between treated and untreated conditions are indicated. n.s.: not significant (B-E) Quantification of firefly luciferase-labeled MCF-7 cells with or without co-culture of equal amount of MSCs in under different treatments with neutralizing antibody against E-cad (Anti-Ecad) (B), doxycycline (Dox) to induce the expression of dominant negative E-cad (DN-Ecad) in cancer cells (C), neutralizing antibody against N-cad (anti-Ncad) (D) or siRNAs against N-cad in MSCs (siNcad) (E). BL signals were measured on Day 5 to allow the treatments to take effects, and normalized to untreated MCF-7 cells without MSCs (n=3-5). For (C), the ratio between +MSC and −MSC conditions (+/- MSC) is calculated for each condition and shown in the box of dotted line, and a p value is calculated and shown for the ratios (C). Pictures to the right of the bar graphs show the representative fluorescent imaging of the heterotypic organoids formed by GFP-labeled MCF-7 cells and unlabeled MSCs with or without the corresponding treatment. (F) Quantification of MCF-7 cells growing in plates coated with the indicated recombinant proteins (n=5). (G) Representative BL images of mice that were subjected to IIA injection of 5 × 10⁵ MCF-7 cells and treated with E-cad neutralizing antibody (Anti-Ecad) or control IgG are shown. The images at the bottom show extracted bones examined after resection. W0-W3: Week 0 to 3 after IIA injection. (H) Left: BL intensity (normalized to Day 0 values) as a function of time after IIA injection of 5 × 10⁵ MCF-7 cells with or without treatment of anti-Ecad (n=5 and 8 for IgG and anti-Ecad, respectively). Error bars 95% C.I. p value was determined by fitting a generalized linear model as implemented by R. Right: dot plots show ex vivo BL signal intensity of hind limb bones from the same experiment described in (G). (I) IF staining of Ki67 and cancer cells in microscopic bone lesions (GFP-tagged MCF-7 cells) with or without the treatment of E-cad neutralizing antibody (Anti-Ecad). Blue=DAPI, Purple=Ki67, and Green=GFP. (J-L) The same as (G)-(I), respectively, except that doxycycline induction of DN-Ecad was used to treat mice instead of anti-Ecad (n=5 for each group). Error bars 95% C.I. Error bars SD except (H) and (K). Scale 25 μm. See also Figure S5.
Figure 6
Figure 6. The hAJs between Cancer Cells and the Osteogenic Niche Activate the mTOR Pathway in Cancer Cells
(A) Phospho-antibody arrays hybridized with protein lysates of MCF-7 mammospheres, MSC-spheres, admixture of pre-formed mammospheres and MSC-spheres, and heterotypic organoids. (B) Western blots show the expression level of indicated proteins and phospho-proteins in the cell lysates after 4 hour co-culturing with or without equal amount of MSCs. (C) IF staining of RFP (red) and pS6K(T389) (green) in the heterotypic organoids of RFP-labeled MSCs and unlabeled MCF-7 cells. Left: signals from all three channels (blue=DAPI); Right: signals from green channel only. (D) Western blots show the level of indicated proteins and phospho-proteins in MCF-7 mammospheres or heterotypic organoids of MCF-7 cells and equal number of MSCs. The protein lysates were prepared 4 hours after the cultures began. MCF-7 cells were tagged with firefly luciferase (Fluc), which was used as the control of cancer cell quantities. Torin 1 is an mTOR inhibitor. (E) Western blots show the impact of doxycycline (Dox)-induced expression of dominant negative E-cad (DN-Ecad) on pS6K(T389). (F) Western blots show the impact of the expression of siRNA against N-cad in MSCs on pS6K(T389). (G) Western blot shows the effects of coated cadherin proteins on pS6K(T389) and p4EBP (T37/T46) in MCF-7 cells. (H-K) IF staining of GFP and pS6K(T389) of heterotypic organoids formed between MCF-7 cells and MSCs with or without treatment of an E-cad neutralizing antibody (Anti-Ecad) (H), inducible expression of dominant negative E-cad in cancer cells (DN-Ecad) (I), an N-cad neutralizing antibody (anti-Ncad) (J) or expression of siRNA against N-cad in MSCs (K). All channels:blue=DAPI, green=GFP, red =pS6K(T389] (L-M) IF staining of GFP-labeled MCF-7 cells (green) and pS6K(T389) (red) of microscopic lesions in bones with or without treatment of Anti-Ecad (L) or DN-Ecad (M). All channels: blue=DAPI, green=GFP, red=pS6K(T389], Scale 25 μm. See also Figure S6.
Figure 7
Figure 7. The mTOR Pathway Mediates the Initiation of Bone Colonization
(A) Left: Representative BL pictures of mice receiving IIA injection of 5 × 10⁵ MCF-7 cells expressing shRNAs against Raptor (shRa) or Rictor (shRi) or control vectors (GIPZ). Middle: BL signal intensity (normalized to Day 0 values) as a function of time after IIA injection of 5 × 10⁵ MCF-7 cells expressing shRNAs against Raptor (shRa) or Rictor (shRi), or vehicle control (n=10 for each group). Mice with cancer cells expressing shRNAs against the same gene were pooled together in this plot (shRa-1/2 or shRi1/2)). The statistical significance was assessed by fitting a generalized linear model as implemented by R. Error bars SEM. Right: Quantification of BL signal intensity of bone lesions at the terminal time point (Week 4). Different shRNAs against the same gene (shRa-1/2 or shRi1/2) were distinguished by color. Error bars SD. (B) Left: Representative BL pictures of mice that were subjected to IIA injection of 5 × 10⁵ MCF-7 cells and treated with indicated drugs are shown. Middle: BL signal intensity (normalized to Day 0 values) as a function of time after IIA injection of 5 × 10⁵ MCF-7 cells under the treatment of Torin 1, rapamycin, and vehicle control (n=8-9 for each group). The statistical significance was assessed by fitting a generalized linear model as implemented by R. Error bars SEM. Right: Dot plots show BL signal intensity of bone lesions at the terminal time point (Week 4) in the same experiment. Error bars SD. (C) Same as (B) except that 5 × 10³ 4TO7 cells are used instead of MCF-7 cells. Error bars SD. (D) Left: Cleaved Caspase 3 (CC3, red) and Ki67 (red) staining of bone metastases at different time points is shown. Cancer cells are stained with Keratin 8 (green). Arrows indicate solitary cancer cells. Scale 25 μm. Right: Quantification of Ki67-positive cells in bone lesions at different stages with or without treatment of Torin 1 is shown (n=5, Error bars SD). C=control, T= Torin 1 treatment, Early: Day 21 after injection. Late: Day 42 after injection. (E) Validation of the rapamycin-responsive signature (Rapa-Sig) and PP242-responsive signature (PP242-Sig.) in TCGA dataset. The signature scores were calculated as specified in Experimental Procedures. Pearson correlation coefficients were computed between the scores and the level of phospho-proteins in Reverse Phase Protein Array (RPPA). The p values were determined based on Student's t-tests and are shown in parentheses below the correlation coefficients. (F) PP242-Sig. and Rapa-Sig were applied to GSE14776. The scores are tabulated by the sample type (DTC vs overt bone metastases). Error bars SD. See also Figure S7.
Figure 8
Figure 8. The Osteogenic Niche and the mTOR pathway Mediate Spontaneous Bone Metastases
(A) Schematic showing the experimental design to investigate spontaneous bone metastases in the 4T1.2 or 2208L models. (B)-(D) 4T1.2 spontaneous bone micrometastasis. (B) IF co-staining of Keratin 8 (for cancer cells, green) and ALP, Col-I, or CTSK (red). (C) IF co-staining of Keratin 8 (K8) (green) and pS6K(T389) (red). (D) IF co-staining of E-cad (red) and N-cad (green). (E) Top: Representative BL pictures show spontaneous metastases arising from orthotopic 4T1.2 tumors with or without treatment of anti-E-cad antibody. Middle: Quantification of spontaneous 4T1.2 bone metastases with treatment of anti-E-cad antibody or the IgG control. Bottom: representative ex vivo BL images. Bottom: lung metastases of the same mice are quantified and shown. n=6 and 7 for IgG and anti-Ecad, respectively. n.s.: not significant. (F) Same as (E), except that Torin 1 or its vehicle were used instead of E-cad antibody or IgG.n=9 and 12 for Vehicle and Torin 1 treatment, respectively. n.s.: not significant. (G): A model of osteogenic niche-dependent early-stage bone colonization. DTC: disseminated tumor cells. Error bars SD. Scale 25 μm. See also Figure S8.

Comment in

References

    1. Aguirre-Ghiso JA. Models, mechanisms and clinical evidence for cancer dormancy. Nat Rev Cancer. 2007;7:834–846. - PMC - PubMed
    1. Bakewell SJ, Nestor P, Prasad S, Tomasson MH, Dowland N, Mehrotra M, Scarborough R, Kanter J, Abe K, Phillips D, et al. Platelet and osteoclast beta3 integrins are critical for bone metastasis. Proc Natl Acad Sci U S A. 2003;100:14205–14210. - PMC - PubMed
    1. Baron R, Kneissel M. WNT signaling in bone homeostasis and disease: from human mutations to treatments. Nat Med. 2013;19:179–192. - PubMed
    1. Baselga J, Campone M, Piccart M, Burris HA, 3rd, Rugo HS, Sahmoud T, Noguchi S, Gnant M, Pritchard KI, Lebrun F, et al. Everolimus in postmenopausal hormone-receptor-positive advanced breast cancer. N Engl J Med. 2012;366:520–529. - PMC - PubMed
    1. Boulay A, Rudloff J, Ye J, Zumstein-Mecker S, O'Reilly T, Evans DB, Chen S, Lane HA. Dual inhibition of mTOR and estrogen receptor signaling in vitro induces cell death in models of breast cancer. Clin Cancer Res. 2005;11:5319–5328. - PubMed

Publication types