. 2015 Feb 9;27(2):240-56.
doi: 10.1016/j.ccell.2014.11.018. Epub 2015 Jan 15.

Tunable-combinatorial mechanisms of acquired resistance limit the efficacy of BRAF/MEK cotargeting but result in melanoma drug addiction

Affiliations

Tunable-combinatorial mechanisms of acquired resistance limit the efficacy of BRAF/MEK cotargeting but result in melanoma drug addiction

Gatien Moriceau et al. Cancer Cell. .

Abstract

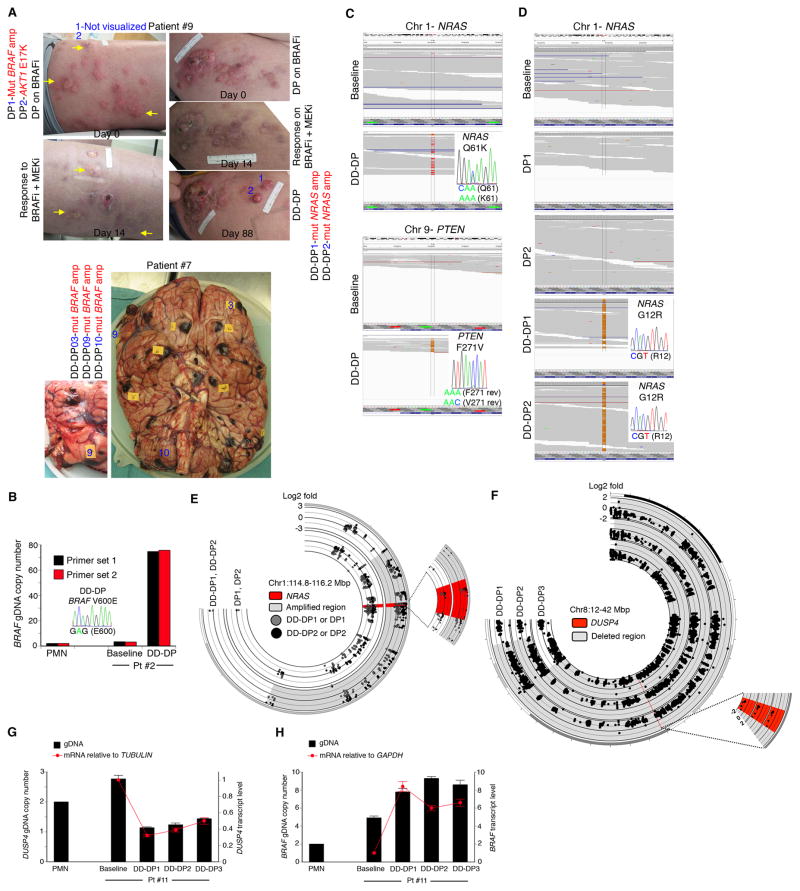
Combined BRAF- and MEK-targeted therapy improves upon BRAF inhibitor (BRAFi) therapy but is still beset by acquired resistance. We show that melanomas acquire resistance to combined BRAF and MEK inhibition by augmenting or combining mechanisms of single-agent BRAFi resistance. These double-drug resistance-associated genetic configurations significantly altered molecular interactions underlying MAPK pathway reactivation. (V600E)BRAF, expressed at supraphysiological levels because of (V600E)BRAF ultra-amplification, dimerized with and activated CRAF. In addition, MEK mutants enhanced interaction with overexpressed (V600E)BRAF via a regulatory interface at R662 of (V600E)BRAF. Importantly, melanoma cell lines selected for resistance to BRAFi+MEKi, but not those to BRAFi alone, displayed robust drug addiction, providing a potentially exploitable therapeutic opportunity.


Conflict of interest statement

No author declared conflicts of interest.

Figures

Figure 1
Figure 1. Melanomas Resistant to BRAF/MEK Inhibitors Display Exaggerated Genetic Mechanisms of BRAF Inhibitor Resistance
(A) Clinical photos denoting specific genetic mechanisms (red) of drug resistance detected within specific tumors (blue). For patient #9, BRAFi-disease progressive melanomas responded to BRAFi+MEKi (yellow arrows) on day 14 with disease progression ensuing as evident on day 88. DP, disease progression on BRAFi; DD-DP, double drug-disease progression. (B) Quantitative PCR (Q-PCR) and Sanger sequencing of gDNAs extracted from melanoma samples from patient #2 and peripheral mononuclear cells (PMN) as a control. The bar graph shows averages of duplicates. (C) DD-DP melanoma from patient #6 with concurrent heterozygous Q61KNRAS (exomeSeq) and compound heterozygous of K197*PTEN (not shown) and F271VPTEN (RNASeq). Display by Integrative Genome Viewer with Sanger validation. (D) G12RNRAS homozygosity in patient #9 DD-DP tumors. (E) Circos plot showing NRAS copy number gains in patient #9 DD-DP tumors. (F) Hemizygous DUSP4 deletions in all three DD-DP tumors from patient #11. (G–H) DUSP4 (G) and BRAF (H) gDNA copy numbers and mRNA expression levels by Q-PCR and Q-RT-PCR, respectively, in tumors from patient #11. Error bars, +/− SD. See also Figure S1, Table S1, and Table S2.
Figure 2
Figure 2. Melanoma Cells with Acquired BRAFi Resistance Further Resist BRAFi+MEKi by Augmenting Existing or Combining Distinct Mechanisms
(A) Relative drug exposure times required to achieve resistance to BRAFi+MEKi in three isogenic groups of V600EBRAF melanoma cell lines comparing progression from SDR->DDR vs. P->DDR (P, parental, SDR, Single Drug or BRAFi Resistant; DDR, Double Drug Resistant). [inhibitor], 0.1 to 2.0 μM. (B) gDNA and cDNA BRAF copy numbers (average of duplicates) by Q-PCR or Q-RT-PCR (top) and by semi-quantitative PCR (bottom). (C) gDNA and cDNA NRAS levels in the M249 P, SDR, and SDR-DDR cell lines in A and B. (D) Sanger sequencing of cDNAs from cell lines in C with chromatograms showing detection of the WT vs. mutant NRAS transcripts (ratio estimated by peak heights). (E) Western blot (WB) of indicated total and phospho-protein levels from three isogenic triplets (SDR sub-lines annotated with known BRAFi resistance mechanisms; FL, full-length, TR, truncated; TUBULIN, loading control). Treatments with BRAFi (SDR) or BRAFi+MEKi (DDR) (1 μM), 16 hr prior to lysate preparation. BRAF WB, both short and long exposures shown. Quantification of WBs for NRAS (M249 triplet): 1, 0.98, 1.65; for p61 BRAF (M397 triplet): 1, 2.55, 7.33; and for FL BRAF (M395 triplet): 1, 10.89, 13.63 (normalization to TUBULIN and then parental values). (F) NRAS knockdown in the M249 SDR and SDR-DDR lines by shRNA as shown by WB 72 hr after lentiviral infections. Inhibitors were at 1 μM each. shSCR, shScrambled. (G) Three-day MTT assays using M249 cell lines from F. [inhibitor] in μM. (H) Ten-day clonogenic assays using M249 cell lines from F. BRAFi or BRAFi+MEKi treatments every two days were started 24 hr after plating. (I) cDNA Sanger sequencing showing WT vs. mutant NRAS transcripts and the estimated ratio in M238 AR (SDR) cells. (J) Stable knockdown of PTEN by lentiviral shRNA in M238 AR (SDR) (BRAFi, 1 μM) showing the levels of indicated phospho- and total proteins by WB of cellular lysates 72 hr post-transduction, compared to protein levels in the M238 parental cell line (P) treated with DMSO. GAPDH, loading control. (K) Long-term clonogenic assays of indicated cells from J. (L) WB showing the DUSP4 protein levels in control and stable knockdown M395 SDR. (M) Three-day MTT assays of indicated cells from L. Error bars, +/− SEM; n=5; normalized to DMSO as 100%. BRAFi, vemurafenib; MEKi, selumetinib.
Figure 3
Figure 3. Melanoma Cells Clonally Develop Resistance to Upfront BRAFi+MEKi via Alternative Genetic Configurations
(A) Three-day MTT assays (error bars, +/− SEM, n=5; top, relative raw values; bottom, normalized to DMSO vehicle as 100%). Cells were plated 16 hr without inhibitors prior to treatment with indicated inhibitor(s) (in μM). (B) Western blot (WB) of indicated total and phospho-proteins. M249 cell lines were plated 16 hr without inhibitors prior to BRAFi+MEKi treatments for 1 hr (0–10 μM in 10-fold increments). TUBULIN, loading control. (C) BRAF copy number by gDNA Q-PCR (averages of duplicates). (D) Sanger sequencing showing BRAF and MEK1 mutational status of M249 cell lines. (E) Integrated Genome View snapshots of reference and mutant/variant allelic frequencies (MAFs) centered on the A to T mutation (chromsome 7:140453136; V600EBRAF) and on the C to G mutation (chromosome 15:66729179; F129LMEK1) in indicated M249 cell lines. Mutant:WT estimated from the MAFs. Note a low MAF of F129LMEK1 in M249 P. (F) CNV display by Circos (with respect to M249 P) showing distinct BRAF amplicons in DDR4 vs. DDR5 (top) and MEK1 copy number gain in DDR5 (bottom). (G–H) WB of indicated total and phospho-proteins from M249 cell lines plated 16 hr without inhibitors prior to ERKi treatments for 1 hr (0–10 μM) without or with BRAFi+MEKi co-treatment (1 μM) (G) or prior to BRAFi+MEKi treatment (1 μM, 1 hr) (H). BRAFi, vemurafenib; MEKi, selumetinib; ERKi, SCH772984. See also Figure S2.
Figure 4
Figure 4. Achieving BRAF/MEK Inhibitor Resistance via Tuning V600EBRAF Gene Dosage with or without MEK Mutations
(A) M249 DDR4 and DDR5 plated 16 hr with BRAFi+MEKi (1 μM each), transduced with lentiviral shVector or shBRAF for 48 hr, and treated with (+) or without (−) inhibitors at 1 μM (1 hr) were analyzed by Western blot (WB). TUBULIN, loading control. (B) WB for CRAF or BRAF in M249 triplet 48 hr after without (−) or with (+) CRAF or BRAF knockdown, as indicated. (C) Cells from B plated for clonogenic assays. (D) Whole exome-based phylogenetic relationships of the M249 triplet cell lines. Branch lengths proportional to the number of heterozygous (het) single nucleotide variants (SNVs) and small insertion-deletions (INDELs) private to each cell line with respect to the theoretical common ancestral cell sub-population (#1). The DDR-unique copy number variations of indicated genes also shown. (E, F) WB of total and phospho-protein levels in M249 triplet and M249 P engineered to express V600EBRAF and F129LMEK1 (E) or Q56PMEK1 (F). Selected cell lines treated with BRAFi+MEKi (1 μM) for 16 hr and then washed free of inhibitors for 8 hr. (G) WB analysis of M249 P engineered to express vector, WTBRAF, or V600E/R509HBRAF (without inhibitors) or M249 DDR4 (BRAFi+MEKi, 1 μM, 16 hr). (H) Clonogenic assays of M249 P engineered to express the indicated levels of WT vs. mutant BRAF and/or MEK1 and their relative resistance to BRAFi+MEKi over inhibitor concentrations and time. (I) Temporal genetic clonal evolution of MAPKi resistance with magnitudes matching graded selective pressures and with augmented gene dosage vs. combinatorial genetic alterations proposed as distinct pathways. Distinct V600EBRAF amplicons indicative of convergent evolution. Each circle, dominant sub-clone. BRAFi, vemurafenib; MEKi, selumetinib. See also Figures S3 and Table S3.
Figure 5
Figure 5. Distinct MEK Mutants Share Enhanced Interaction with V600EBRAF
(A–C) The M249 triplet cell lines were plated without (P) or with (DDR4 and DDR5) BRAFi+MEKi (1 μM, 16 hr), and lysates were subjected to immunoprecipitation (IP) using a control antibody (IgG) or BRAF− (A), MEK1- (B), or MEK2- (C) specific antibodies. The IP and total fractions were probed by Western blot (WB). TUBULIN, loading control. (D) WB analysis of total and phospho-MEK1/MEK2 and -ERK levels in the M249 triplet cell lines. (E) Structure of MEK1 (two views, 180° rotated) with the locations of MEK1 mutations, or residues homologous to MEK2 mutations, indicated in yellow, except that Q56 and F129 are indicated in green. All mutations, except I111S and P124S, have been detected in melanomas with clinical acquired MAPKi resistance. (F) M249 P engineered to express vector or FLAG-WTMEK1, -F129LMEK1, -Q56PMEK1 concurrent with over-expression of either HA-WTBRAF or HA-V600EBRAF were plated with BRAFi+MEKi (1 μM, 16 hr; except vector control), and the lysates were subjected to IP (anti-IgG or -FLAG). WB of IP and total fractions. BRAFi, vemurafenib; MEKi, selumetinib. See also Figure S4 and Movie S1.
Figure 6
Figure 6. A BRAF-MEK Interface Critical for V600EBRAF-MUTMEK1 Interaction and Cooperative Double Drug Resistance
(A) A predicted MEK1 kinase domain (KD)-V600EBRAF KD complex with yellow color highlighting the locations of (i) MEK1 residues mutated in melanomas with acquired MAPKi resistance, (ii) V600EBRAF R509, critical for RAF-RAF dimerization, (iii) V600EBRAF R662, structurally homologous to KSR2 A879 critical for MEK1-KSR2 interaction, and (iv) V600EBRAF I617, critical for MEK-BRAF dimerization. (B) Zoomed-in details of a MEK1-V600EBRAF interfaces, highlighting MEK1 activation segment residues (blue, M219, S222, and V224) interacting with V600EBRAF R662 (yellow), I617 (magenta) and I666 (magenta) and interactions predicted to be abolished by a R662L (red) mutation. (C) Western blot of indicated proteins in human 293T cells transfected with vector or indicated HA-tagged BRAF constructs. TUBULIN, loading control. (D) M249 P engineered to moderately over-express HA-BRAF or the indicated BRAF mutants along with either FLAG-MEK1 mutant (F129L or Q56P). Experiments were performed as described for Figure 5F. (E) Clonogenic assays of M249 P engineered to express WT or indicated mutant BRAF, MEK1 mutants, and/or their empty vectors (Vec). Relative resistance to BRAFi+MEKi assessed over the indicated concentration range and time points. Three repeats (for 0.1 and 1.0 μM) are shown for the longest time points (28 and 32 days), and growths were quantified (1 μM; n=3; normalization relative to V600EBRAF+MUTMEK1 transduced cells as 100%; means and error bars, +/− SD; *p < 0.05, ***p < 0.001, ns, not significant based on ANOVA). BRAFi, vemurafenib; MEKi, selumetinib. See also Figure S5.
Figure 7
Figure 7. Resistance to Combined BRAF/MEK Inhibition Results in Exquisite Drug Addiction
(A) Clonogenic survival of M249 DDR cell lines plated in BRAFi+MEKi, 1 μM each, for 72 hr then cultured for 9 days with or without specific inhibitor withdrawal (representative of three independent repeats). (B, C) Clonogenic/drug addiction assays as in (A) except for the indicated high (B) or low (C) ERKi doses starting at 72 hr after plating. (D) Clonogenic assays comparing SDR vs. DDR cell lines of distinct genetic backgrounds and resistance mechanisms (amp, amplification; spl, splicing). (E) Western blot analysis of p-ERK levels without or with acute BRAFi (SDR) or BRAFi+MEKi (DDR) withdrawal for 4 and 24 hr. TUBULIN, loading control. Quantification of p-ERK signals normalized to TUBULIN levels is shown for each cell line relative to the baseline signals (no inhibitor withdrawal). (F) Correlation between changes in p-ERK levels (E, 4 hr vs. 0 hr) and in clonogenic growths (D) upon inhibitor(s) withdrawal. BRAFi, vemurafenib; MEKi, selumetinib; ERKi, SCH772984. See also Figures S6 and Table S4.
Figure 8
Figure 8. Alterations in a V600EBRAF-CRAF-MEK Complex with Opposite Impacts on Melanoma Fitness Contingent on the Presence of BRAF and MEK Inhibitors
Alternative configurations of a RAF-MEK resistance-related complex consisting of (1) a supra-physiologic level of V600EBRAF, which activates CRAF, or (2) a moderately over-expressed V600EBRAF level concomitant with a mutant MEK1/2, which leads to increased V600EBRAF-MUTMEK interaction. Both signaling configurations strongly favor ERK activation, leading to growth/survival finely tuned to the BRAFi+MEKi level. Paradoxically, acute removal of BRAFi+MEKi disrupts this fine-tuning and results in a p-ERK rebound favoring cell arrest/death (i.e., drug addiction). WT (grey) and mutant (red) proteins; BRAFi or MEKi, blue circles.

Comment in

References

    1. Bollag G, Hirth P, Tsai J, Zhang J, Ibrahim PN, Cho H, Spevak W, Zhang C, Zhang Y, Habets G, et al. Clinical efficacy of a RAF inhibitor needs broad target blockade in BRAF-mutant melanoma. Nature. 2010;467:596–599. - PMC - PubMed
    1. Brennan DF, Dar AC, Hertz NT, Chao WC, Burlingame AL, Shokat KM, Barford D. A Raf-induced allosteric transition of KSR stimulates phosphorylation of MEK. Nature. 2011;472:366–369. - PubMed
    1. Catalanotti F, Reyes G, Jesenberger V, Galabova-Kovacs G, de Matos Simoes R, Carugo O, Baccarini M. A Mek1-Mek2 heterodimer determines the strength and duration of the Erk signal. Nat Struct Mol Biol. 2009;16:294–303. - PubMed
    1. Corcoran RB, Dias-Santagata D, Bergethon K, Iafrate AJ, Settleman J, Engelman JA. BRAF gene amplification can promote acquired resistance to MEK inhibitors in cancer cells harboring the BRAF V600E mutation. Sci Signal. 2010;3:ra84. - PMC - PubMed
    1. Emery CM, Vijayendran KG, Zipser MC, Sawyer AM, Niu L, Kim JJ, Hatton C, Chopra R, Oberholzer PA, Karpova MB, et al. MEK1 mutations confer resistance to MEK and B-RAF inhibition. Proc Natl Acad Sci U S A. 2009;106:20411–20416. - PMC - PubMed

Publication types

MeSH terms

Substances

Associated data