. 2015 Jan 20:5:7857.
doi: 10.1038/srep07857.

Cancer systems biology of TCGA SKCM: efficient detection of genomic drivers in melanoma

Affiliations

Cancer systems biology of TCGA SKCM: efficient detection of genomic drivers in melanoma

Jian Guan et al. Sci Rep. .

Abstract

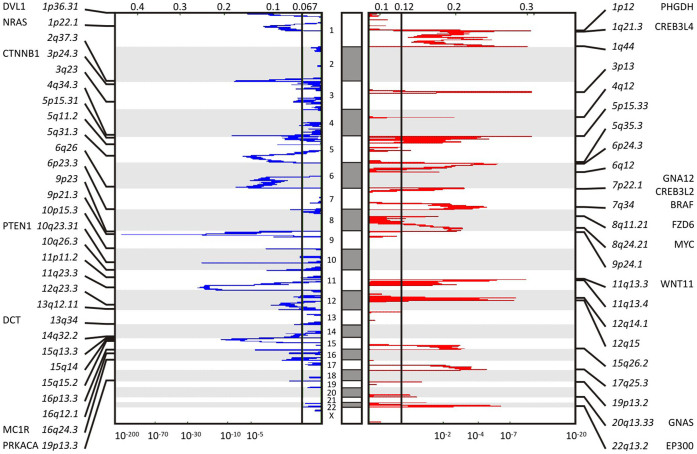
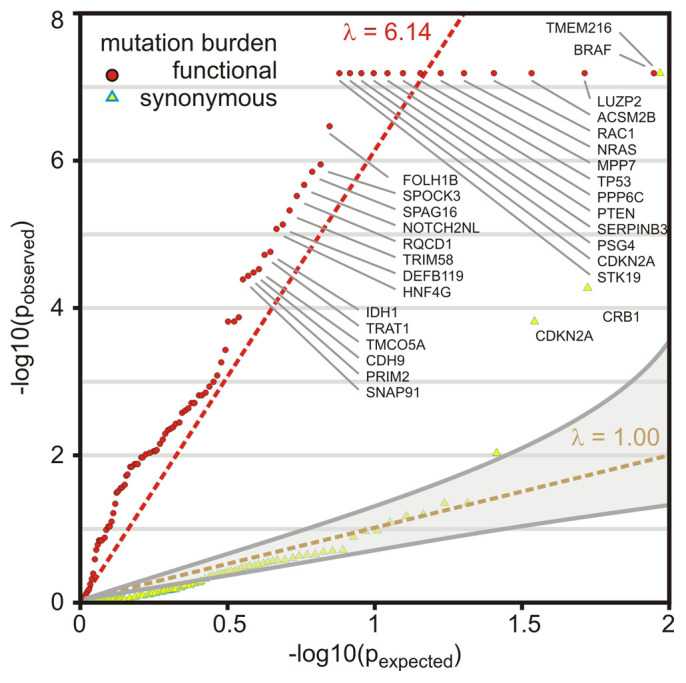
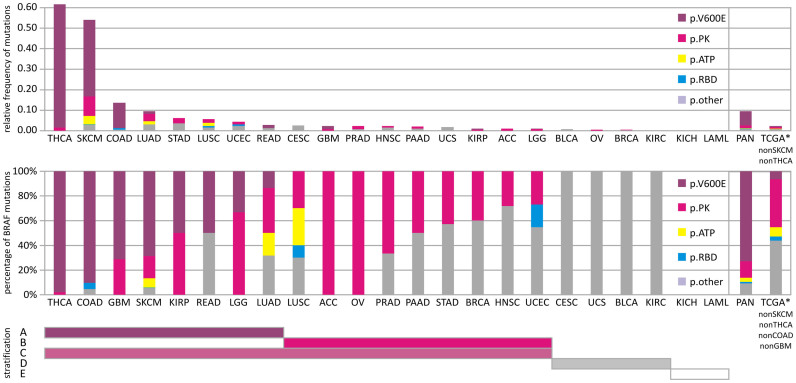
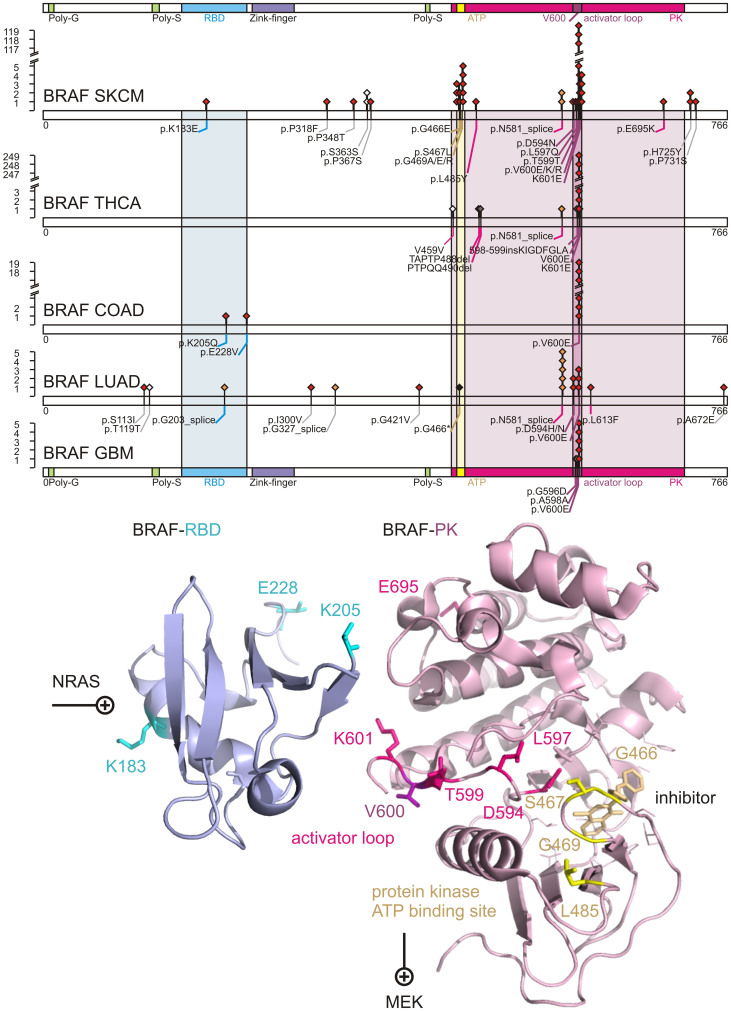
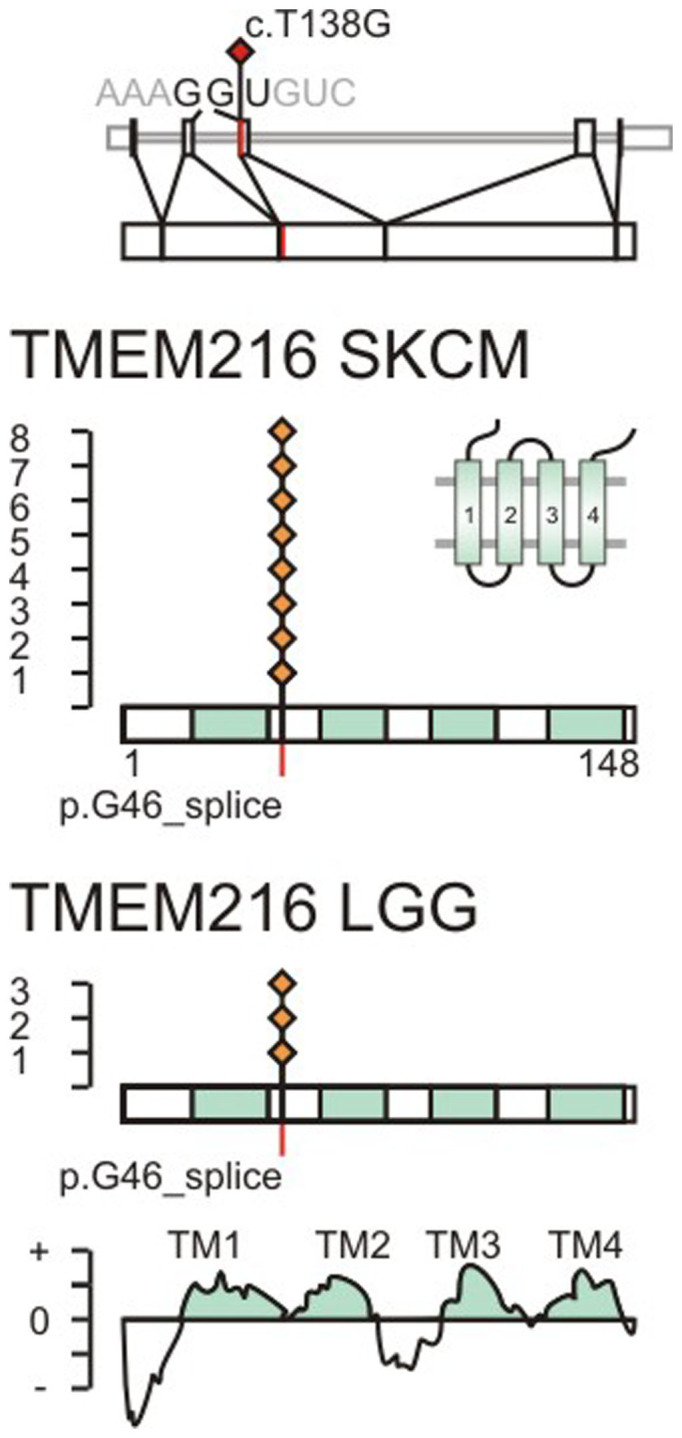
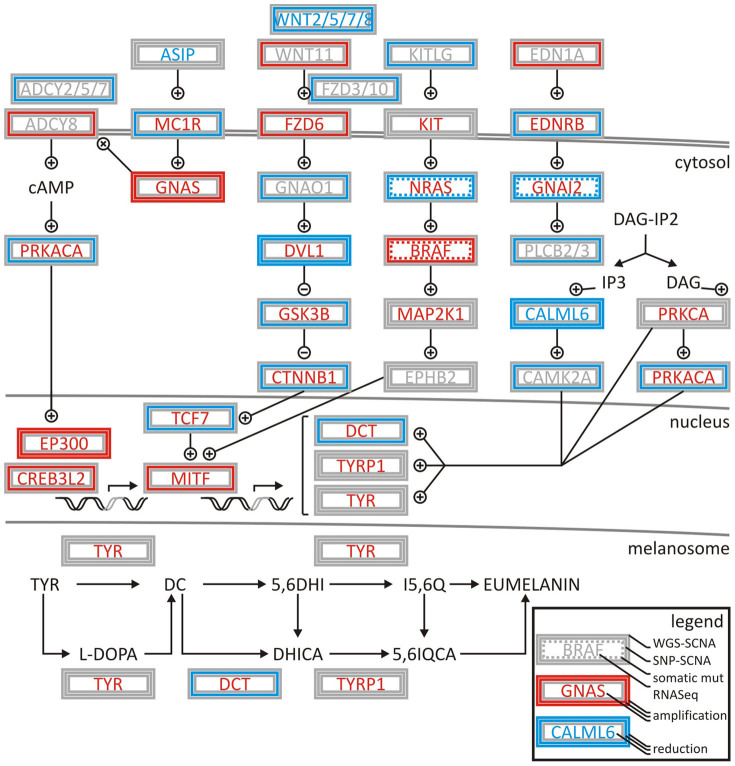
We characterized the mutational landscape of human skin cutaneous melanoma (SKCM) using data obtained from The Cancer Genome Atlas (TCGA) project. We analyzed next-generation sequencing data of somatic copy number alterations and somatic mutations in 303 metastatic melanomas. We were able to confirm preeminent drivers of melanoma as well as identify new melanoma genes. The TCGA SKCM study confirmed a dominance of somatic BRAF mutations in 50% of patients. The mutational burden of melanoma patients is an order of magnitude higher than of other TCGA cohorts. A multi-step filter enriched somatic mutations while accounting for recurrence, conservation, and basal rate. Thus, this filter can serve as a paradigm for analysis of genome-wide next-generation sequencing data of large cohorts with a high mutational burden. Analysis of TCGA melanoma data using such a multi-step filter discovered novel and statistically significant potential melanoma driver genes. In the context of the Pan-Cancer study we report a detailed analysis of the mutational landscape of BRAF and other drivers across cancer tissues. Integrated analysis of somatic mutations, somatic copy number alterations, low pass copy numbers, and gene expression of the melanogenesis pathway shows coordination of proliferative events by Gs-protein and cyclin signaling at a systems level.


Figures

Figure 1
Figure 1. Somatic copy number alteration profiling of TCGA SKCM data shows significant focal deletions and amplifications.
Somatic copy number alteration analysis identifies genomic regions that are significantly gained or lost across a set of tumors. GISTIC 2.0.21 found 21 significant arm-level results, 23 significant focal amplifications, and 29 significant focal deletions in segmented SNP array data of 292 SKCM metastatic tumor samples. Among those results, amplification of BRAF, as well as reduction of NRAS and PTEN is found. The genomic position is indicated by chromosome number in the middle panel; chromosome bands and altered genes are labeled at the sides. Normalized amplifications and deletions are labeled on top and shown in red and blue, respectively.
Figure 2
Figure 2. Filtered genes show significant enrichment of somatic mutations above background mutation rate.
QQ-plot of mutational significance analysis is based on a permutation analysis of the background mutation rate. q-values (q = -log10(p)) above the diagonal indicate enrichment of somatic mutation. The diagonal y = x serves as reference where observed and expected mutational burden coincide. The significantly enriched functional mutation burden of genes passed an q-value cut-off < = 0.2 is shown as red circles. The synonymous mutation burden is shown as yellow triangles. Genes with significantly enriched synonymous mutation burden passed an q-value cut-off < = 0.2 are highlighted with blue frame. Best-fit is shown as dashed-red line (λ = 6.14) and y = x as dashed-yellow line. Gray-shaded area represents 95% confidence interval for expected p-values.
Figure 3
Figure 3. Distribution of somatic mutations and mutation types in BRAF gene across The Cancer Genome Atlas Pan-Cancer analysis project.
Top panel shows the relative frequency of non-silent somatic mutations (number of observed type of somatic mutation/cohort size) of detected mutations across different human cancer tissues within TCGA. Bottom panel shows fraction of mutations sorted by affected protein domains of BRAF. The analysis includes all non-silent (protein coding missense, indels, frame-shift, stop, splice site) mutations and distinguishes mutations of V600E in purple, ATP binding site in yellow, all mutations in the protein kinase (PK) domain of BRAF but not V600E or ATP binding site in pink, RAS-binding domain (RBD) in blue, and remaining protein sequence (other) in grey. The PAN-cancer analysis covers cancer tissues: adrenocortical carcinoma (ACC), bladder urothelial carcinoma (BLCA), breast invasive carcinoma (BRCA), cervical squamous cell carcinoma and endocervical adenocarcinoma (CESC), colon adenocarcinoma (COAD), glioblastoma multiforme (GBM), head and neck squamous cell carcinoma (HNSC), kidney chromophobe (KICH), kidney renal clear cell carcinoma (KIRC), kidney renal papillary cell carcinoma (KIRP), acute myeloid leukemia (LAML), brain lower grade glioma (LGG), liver hepatocellular carcinoma (LIHC), lung adenocarcinoma (LUAD), lung squamous cell carcinoma (LUSC), ovarian serous cystadenocarcinoma (OV), pancreatic adenocarcinoma (PAAD), prostate adenocarcinoma (PRAD), rectum adenocarcinoma (READ), skin cutaneous melanoma (SKCM), stomach adenocarcinoma (STAD), thyroid adenocarcinoma (THCA), uterine corpus endometrioid carcinoma (UCEC), and uterine carcinosarcoma (UCS). Right box within panels includes analysis for PAN-cancer cohort and sub-cohort that excludes BRAF-rich cancers of more than 0.5 relative frequency, like SKCM and THCA, or of more than 50% V600E BRAF, like THCA, COAD, SKCM, GBM (TCGA*). Patient stratification: Bars below the panels mark stratification strategy of human cancers based on their BRAF genotype. A BRAF-V600E mutation; B BRAF mutation in protein kinase domain other than V600E; C BRAF-mutation in protein kinase domain; D BRAF-mutation other than protein kinase or RBD; E no BRAF mutation.
Figure 4
Figure 4. Comprehensive somatic mutational landscape of BRAF as PAN-cancer driver.
Distribution of somatic mutations are shown, for five TCGA tissues with significant BRAF mutations: skin cutaneous melanoma (SKCM), thyroid adenocarcinoma (THCA), colon adenocarcinoma (COAD), lung adenocarcinoma (LUAD), glioblastoma multiforme (GBM). Diamonds indicate mutation type of non-synonymous mutations in red, splice-site mutations in orange, indels in brown, stop in black, and silent protein-coding mutations in white. Numbers refer to codons. Each filled circle represents an individual mutated tumour sample. The RAS binding domain (RBD) of BRAF is colored in magenta. The protein kinase (PK) domain of BRAF is colored in blue with the ATP binding site highlighted in yellow, and the activator loop around residue 600 in purple. Domains are colored accordingly. Residues affected by coding somatic mutations of BRAF, NCBI Gene ID 673, are depicted in sticks onto ribbon structure of 3ny5.pdb and 4e26.pdb.
Figure 5
Figure 5. The c.T138G somatic mutation is recurring and affects the splice site of TMEM216.
Splice site mutations are indicated in red on the transcript and protein sequence of TMEM216, NCBI Gene ID 51259. The somatic mutation c.T138G is located on exon 3 at the second splice site. The splice site codon 46 translates to glycine 46. Observed somatic mutations in TCGA SKCM and LGG datasets are marked by red diamonds. The position of transmembrane helices is indicated in cyan and determined based on protein family PF09799, positive segments in TMPred, and uniprot entry Q9P0N5.
Figure 6
Figure 6. Deregulation of melanogenesis by G-protein and cyclin pathway signalling in TCGA SKCM patient samples.
Coordination of signaling events is demonstrated by integrating low coverage whole genome sequencing somatic copy number alteration (WGS SCNA) data, SNP somatic copy number alteration (SNP SCNA) data, somatic mutations, and RNASeq gene expression analysis. Amplifications or activations are indicated in red, deletions or reductions in blue, non-silent mutations by dashed line. Genes are boxed by analysis type. High or low activity (gene expression) is indicted by red or blue font. Grey indicated undefined state in patient cohort. + and – symbols indicate activation and inhibition of factors in the normal pathway. The network is assembled based on gene-associations of map hsa04916 and entries of M14775 and M1529 identified by systems biology gene set enrichment analysis.

References

    1. Meyerson M., Gabriel S. & Getz G. Advances in understanding cancer genomes through second-generation sequencing. Nat Rev Genet 11, 685–696 (2010). - PubMed
    1. Davies H. et al. Mutations of the BRAF gene in human cancer. Nature 417, 949–954 (2002). - PubMed
    1. Pollock P. M. et al. High frequency of BRAF mutations in nevi. Nat Genet 33, 19–20 (2003). - PubMed
    1. Chapman P. B. et al. Improved survival with vemurafenib in melanoma with BRAF V600E mutation. N Engl J Med 364, 2507–2516 (2011). - PMC - PubMed
    1. Flaherty K. T. et al. Improved survival with MEK inhibition in BRAF-mutated melanoma. N Engl J Med 367, 107–114 (2012). - PubMed

Publication types

Substances