. 2015 Feb 5;16(2):171-83.
doi: 10.1016/j.stem.2014.12.004. Epub 2015 Jan 15.

The NAD(+)-dependent SIRT1 deacetylase translates a metabolic switch into regulatory epigenetics in skeletal muscle stem cells

Affiliations

The NAD(+)-dependent SIRT1 deacetylase translates a metabolic switch into regulatory epigenetics in skeletal muscle stem cells

James G Ryall et al. Cell Stem Cell. .

Abstract

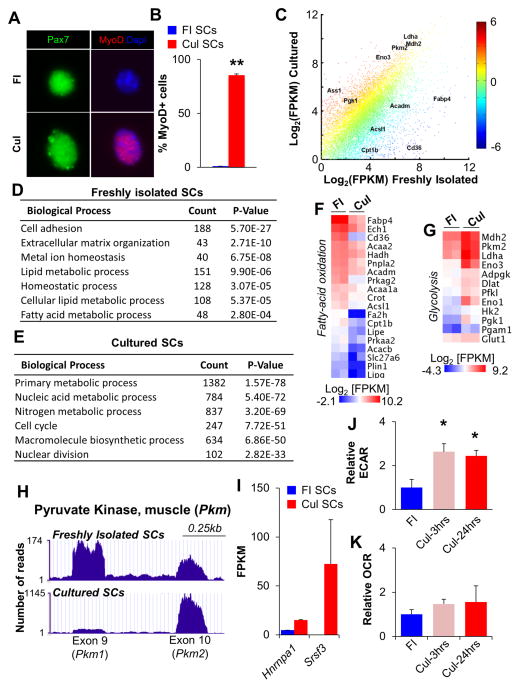
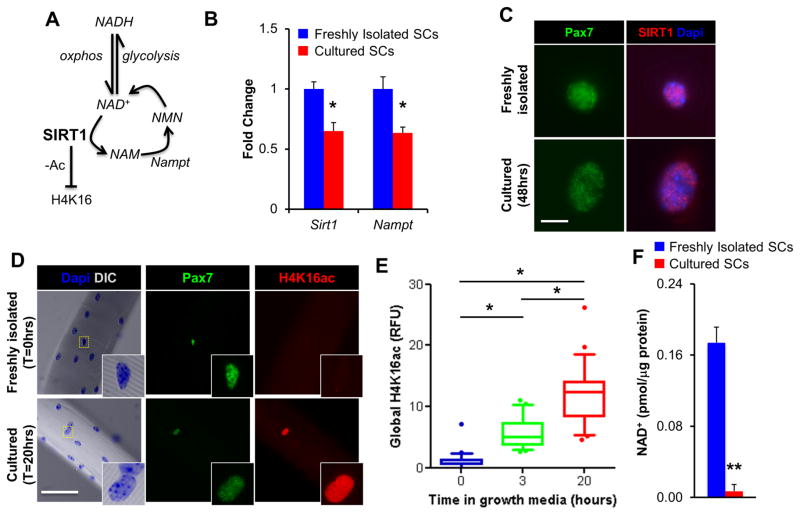
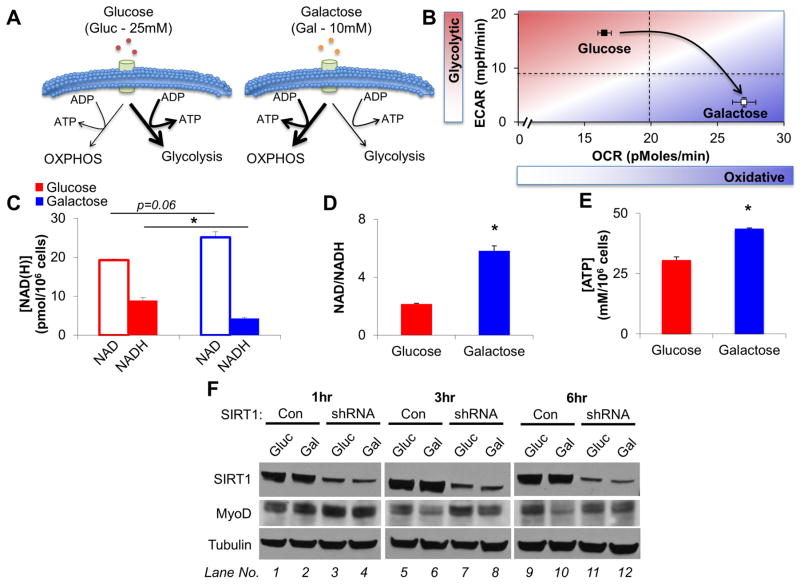
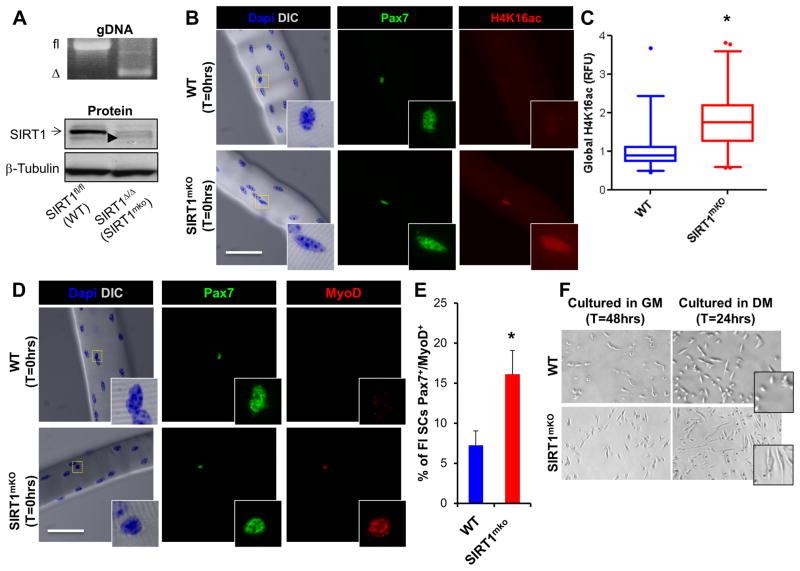
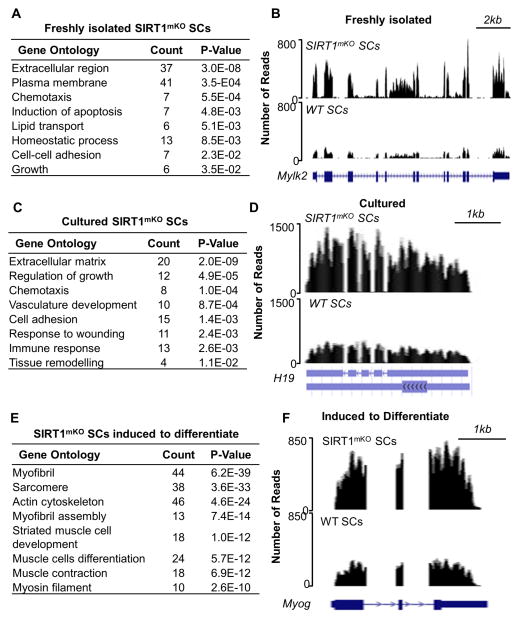
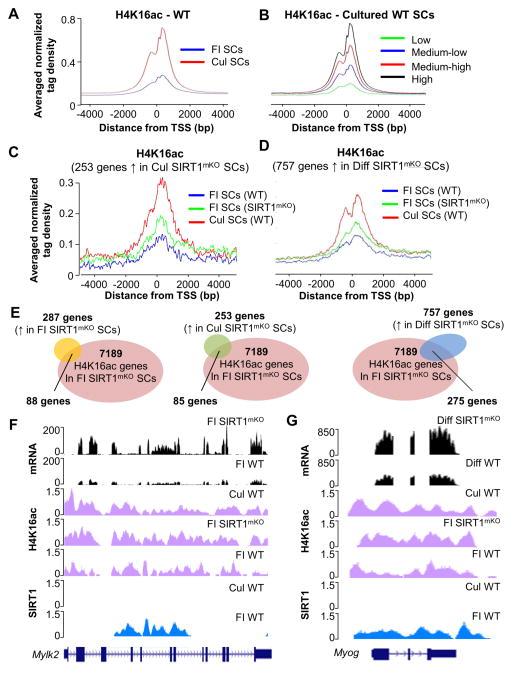
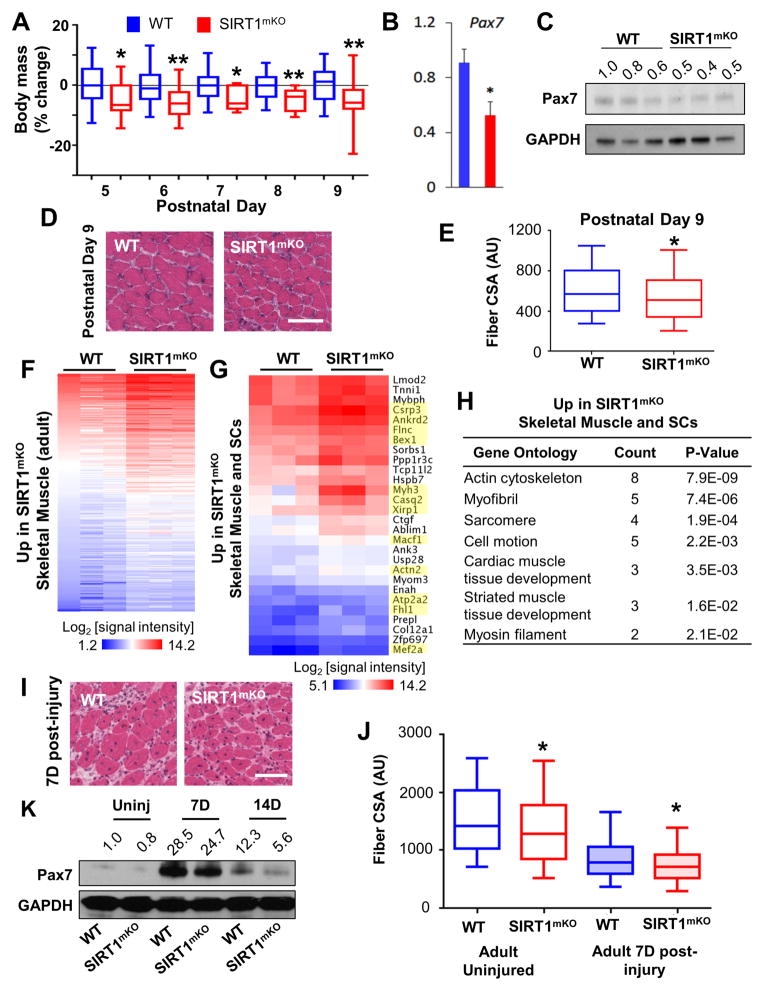
Stem cells undergo a shift in metabolic substrate utilization during specification and/or differentiation, a process that has been termed metabolic reprogramming. Here, we report that during the transition from quiescence to proliferation, skeletal muscle stem cells experience a metabolic switch from fatty acid oxidation to glycolysis. This reprogramming of cellular metabolism decreases intracellular NAD(+) levels and the activity of the histone deacetylase SIRT1, leading to elevated H4K16 acetylation and activation of muscle gene transcription. Selective genetic ablation of the SIRT1 deacetylase domain in skeletal muscle results in increased H4K16 acetylation and deregulated activation of the myogenic program in SCs. Moreover, mice with muscle-specific inactivation of the SIRT1 deacetylase domain display reduced myofiber size, impaired muscle regeneration, and derepression of muscle developmental genes. Overall, these findings reveal how metabolic cues can be mechanistically translated into epigenetic modifications that regulate skeletal muscle stem cell biology.


Figures

Figure 1
Figure 1. Satellite Cells Undergo a Switch from Oxidative to Glycolytic Metabolism Following Culture in Growth Media
(A) Immunofluorescent analyses of freshly isolated (FI, quiescent) and cultured (Cul, activated) SCs with Pax7 (green) and MyoD (red) antibodies. Dapi identifies nuclei. (B) Quantification of MyoD+ SCs in FI and Cul cell populations. (C) RNA-seq scatter plot with key metabolic regulators indicated. Each data point represents the mean Log2[FPKM] from two independent biological replicates with color indicating the relative fold change in gene expression. (D,E) Gene ontology analyses of RNA-seq revealed an enrichment of biological processes specific to FI SCs (D) or Cul SCs (E). The number of genes enriched by greater than 1.5-fold is indicated under the ‘Count’ column. (F,G) Heat maps indicating absolute gene expression (Log2[FPKM]) of specific metabolic regulators in FI and Cul SCs. Each gene listed had a mean fold-change of greater than 1.5. (H) RNA-seq traces (UCSC genome browser) for Pkm 1 and 2 isoforms in FI and Cul WT SCs. (I) Expression of the Pkm splice regulators Hnrnpa1 and Srsf3 in FI and Cul SCs. (J,K) Cellular bioenergetics in SCs during culture in growth conditions were evaluated with Seahorse XF96 bioanalyzer. Glycolysis (ECAR) was increased 2.5 fold in Cul-3hrs and Cul-24hrs SCs (J), while basal oxygen consumption (OCR) was not different between FI, Cul-3hrs or Cul-24hrs SCs (K). Data are presented as mean ± SEM. *p < 0.05 and **p < 0.01 (FI SCs versus Cul SCs).
Figure 2
Figure 2. The Histone Deacetylase Activity of SIRT1 is Reduced Following Satellite Cell Activation
(A) Scheme depicting how the deacetylase activity of SIRT1 is dependent on both metabolic processes (NAD+↔NADH) and the NAD+ salvage pathway (NAD+↔NAM). H4K16, histone H4 lysine 16; NAD, nicotinamide adenine dinucleotide; NAM, nicotinamide; NMN, nicotinamide mononucleotide nucleosidase, Nampt, nicotinamide phosphoribosyltransferase. (B) Sirt1 and Nampt expression in FI and Cul SCs, as measured by qPCR (n=3). (C) SIRT1 and Pax7 immunofluorescence of FACS-isolated FI and Cul SCs. White scale bar indicates 5μm. (D) Pax7 and H4K16ac immunofluorescence of SCs on freshly isolated single muscle fibers. White scale bar indicates 50μm, inset is magnified by a magnitude of 4. (E) Quantification of relative fluorescence (RFU) in SCs labeled for H4K16ac (n=2 mice, >50 fibers/timepoint). Results are presented as box-and-whisker plots, with a significant difference indicated when the median ± 95% CI does not overlap. (F) Total NAD levels in FI and Cul SCs (48hrs in growth media, n=3). Data is presented as mean ± SEM, *p < 0.05 and **p < 0.01 (FI SCs versus Cul SCs).
Figure 3
Figure 3. A Forced Shift to Oxidative Metabolism Increases NAD+ Levels and Reduces MyoD in Control but not SIRT1 shRNA cells
(A) Schematic depicting how glucose is employed to preferentially generate ATP via glycolysis. Replacing glucose with galactose forces cells to shift to predominantly utilize OXPHOS for the generation of ATP. (B) C2C12 basal cellular bioenergetics were analyzed on a Seahorse XF96 bioanalyzer during culture in either glucose or galactose based growth media (n=15 replicates/group). (C,D) Culturing C2C12 cells in galactose based growth media increases the amount of NAD+, at the expense of NADH such that there was a three-fold increase in the NAD/NADH ratio (n=3). (E) Replacing glucose with galactose in C2C12 growth media led to an elevation in ATP levels (n=3). (F) Incubating C2C12 cells with galactose instead of glucose for 3 and 6hrs results in a decrease in MyoD in WT (compare lanes 5–6, and 9–10), but not SIRT1 shRNA C2C12 cells (compare lanes 7–8, and 11–12). Data are presented as mean ± SEM. *p < 0.05.
Figure 4
Figure 4. Ablation of the Catalytic Domain of SIRT1 Results in Increased Global H4K16ac and Precocious Activation/Differentiation of SCs
(A) Skeletal muscle from WT mice demonstrated the presence of the SIRT1 floxed allele (fl, top panel) and detectable levels of SIRT1 protein (arrow, bottom panel), while SIRT1mKO muscle contained the SIRT1Δex4 allele (Δ, top panel) and ablation of SIRT1 protein. A small level of SIRT1Δex4 protein was detectable in the skeletal muscle of SIRT1mKO mice (arrowhead, bottom panel). (B, C) In SIRT1mKO mice, quiescent SCs (identified as Pax7+) exhibited a two-fold increase in global H4K16ac, compared to WT mice, as determined via relative fluorescence (RFU) in SCs labelled for H4K16ac (n=2 mice, >50 fibers/timepoint). White scale bar indicates 50μm, inset is magnified by a magnitude of four. Results are presented as box-and-whisker plots (5–95 percentiles), with a significant difference indicated when the median ± 95% CI does not overlap. (D, E) MyoD and Pax7 staining (n=2 mice, >50 fibers/timepoint) of fiber-associated SIRT1mKO SCs. Data is presented as mean ± SEM, *p < 0.05. (F) DIC images of SCs isolated from WT and SIRT1mKO mice during proliferation in growth media (GM, 48hrs), or early differentiation in differentiation media (24hrs DM). Note the overt spindle-like, elongated morphology of SCs from SIRT1mKO mice indicating premature differentiation.
Figure 5
Figure 5. Ablation of the SIRT1 Catalytic Domain Leads to Modifications in Gene Expression in both Freshly Isolated and Cultured Satellite Cells
(A) Gene ontology (GO) of genes upregulated in FI SIRT1mKO SCs. (B) RNA-seq profiles (UCSC genome browser) of the Mylk2 gene in FI WT SCs (bottom) and FI SIRT1mKO SCs (top). (C) GO of genes upregulated in Cul SIRT1mKO SCs. (D) RNA-seq profiles of the H19 gene in Cul WT SCs (bottom) and Cul SIRT1mKO SCs (top). (E) GO of genes upregulated in SIRT1mKO SCs induced to differentiate (24hrs DM). (F) RNA-seq profiles of the Myog gene in WT (bottom) and SIRT1mKO SCs (top) induced to differentiate. RNA-seq experiments were done with either three (FI SCs) or two (Cul and Differentiating SCs) biological replicates.
Figure 6
Figure 6. Ablation of the SIRT1 Catalytic Domain Alters H4K16 Acetylation and Influences Expression of Selected Genes
(A) Average signal of normalized tag density for H4K16ac ChIP-seq in FI WT SCs (blue line) and Cul WT SCs (red line). (B) Average signal of normalized tag density for H4K16ac ChIP-seq in Cul WT SCs for genes with low expression (green line), medium-low expression (blue line), medium high (red line) and high expression (black line). (C) Average signal of normalized tag density for H4K16ac ChIP-seq in FI WT SCs (blue line), FI SIRT1mKO SCs (green line) and Cul WT SCs for genes up-regulated in Cul SIRT1mKO SCs. (D) Average signal of normalized tag density for H4K16ac ChIP-seq in FI WT SCs (blue line), FI SIRT1mKO SCs (green line) and Cul WT SCs induced to differentiate for genes up-regulated in SIRT1mKO induced to differentiate. (E) Venn diagram representing genes up-regulated in FI SIRT1mKO SCs (287genes), Cul SIRT1mKO SCs (253 genes), and SIRT1mKO SCs induced to differentiate (757 genes), and genes acquiring H4K16ac in FI SIRT1mKO SCs (7189 genes). (F) ChIP-seq and RNA-seq profiles of the Mylk2 gene. Bottom to top: SIRT1 ChIP-seq profile in FI and Cul WT SCs (blue signals); H4K16ac profile in FI WT and SIRT11mKO SCs, and WT Cul SCs (magenta signals); Mylk2 mRNA expression profile in FI WT and SIRT1mKO SCs (black signals). (G) ChIP-seq and RNA-seq profiles of the Myog gene. Bottom to top: SIRT1 ChIP-seq profile in FI and Cul WT SCs (blue signals); H4K16ac profile in WT and SIRT1mKO FI SCs, and WT Cul SCs (magenta signals); Myog mRNA expression profile in FI WT and SIRT1mKO SCs (black signals).
Figure 7
Figure 7. Loss of SIRT1 Deacetylase Activity Leads to Developmental and Regenerative Defects in Skeletal Muscle
(A) Body mass was evaluated starting at postnatal (P) days 5 through 9 in WT and SIRT1mKO mice (WT n=27; SIRT1mKO =24). Significance was determined using a Student’s t-test (two-tailed distribution without assuming equal variance). (B,C) Pax7 mRNA (left) and protein expression (right) were evaluated in the skeletal muscles of P9 WT and SIRT1mKO mice. (D) H&E staining of skeletal muscles in P9 WT and SIRT1mKO mice. White scale bar indicates 50μM. (E) Quantification of skeletal muscle fiber CSA from P9 mice (>1,000 fibers analyzed/muscle). Results are presented as a box-and-whisker plot. (F) Heat map of the microarray results (Log2[signal intensity]) for genes upregulated in SIRT1mKO skeletal muscle. Each gene listed has a mean fold change of >1.5 and p < 0.05 (n=3 samples/group). (G) Heat map of the microarray results (Log2[signal intensity]) for genes upregulated in both SIRT1mKO SCs induced to differentiate and SIRT1mKO skeletal muscle, with developmentally-regulated muscle genes highlighted in yellow. (H) Gene Ontology for genes upregulated in both SIRT1mKO SCs induced to differentiate and SIRT1mKO skeletal muscle. (I) H&E skeletal muscle staining of two-months old (adult) WT and SIRT1mKO mice seven days after CTX injection. (J) Quantification of skeletal muscle fiber CSA from adult WT and SIRT1mKO mice regenerating muscles (seven days after CTX, >1,000 fibers analyzed/muscle). Results are presented as a box-and-whisker plot. (K) Pax7 protein levels in uninjured, and 7 and 14 days regenerating muscles of WT and SIRT1mKO mice. Data is presented as mean ± SEM, *p < 0.05; **p < 0.01.

Comment in

References

    1. Abe S, Hirose D, Kado S, Iwanuma O, Saka H, Yanagisawa N, Ide Y. Increased expression of decorin during the regeneration stage of mdx mouse. Anat Sci Int. 2009;84:305–311. - PubMed
    1. Brack AS, Rando TA. Tissue-specific stem cells: lessons from the skeletal muscle satellite cell. Cell Stem Cell. 2012;10:504–514. - PMC - PubMed
    1. Brunet A, Sweeney LB, Sturgill JF, Chua KF, Greer PL, Lin Y, Tran H, Ross SE, Mostoslavsky R, Cohen HY, et al. Stress-dependent regulation of FOXO transcription factors by the SIRT1 deacetylase. Science. 2004;303:2011–2015. - PubMed
    1. Cerletti M, Jang YC, Finley LW, Haigis MC, Wagers AJ. Short-term calorie restriction enhances skeletal muscle stem cell function. Cell Stem Cell. 2012;10:515–519. - PMC - PubMed
    1. Chang NC, Rudnicki MA. Satellite cells: the architects of skeletal muscle. Current Topics in Developmental Biology. 2014;107:161–181. - PubMed

Publication types