. 2015 Jan 20:6:5938.
doi: 10.1038/ncomms6938.

Femtosecond all-optical synchronization of an X-ray free-electron laser

Affiliations

Femtosecond all-optical synchronization of an X-ray free-electron laser

S Schulz et al. Nat Commun. .

Abstract

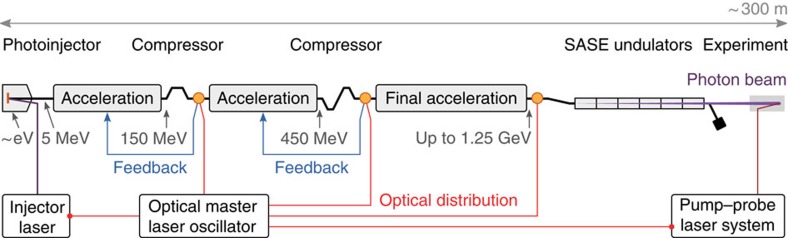
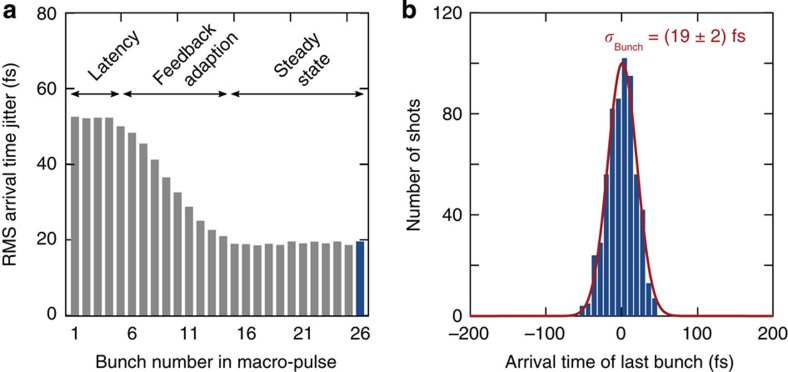
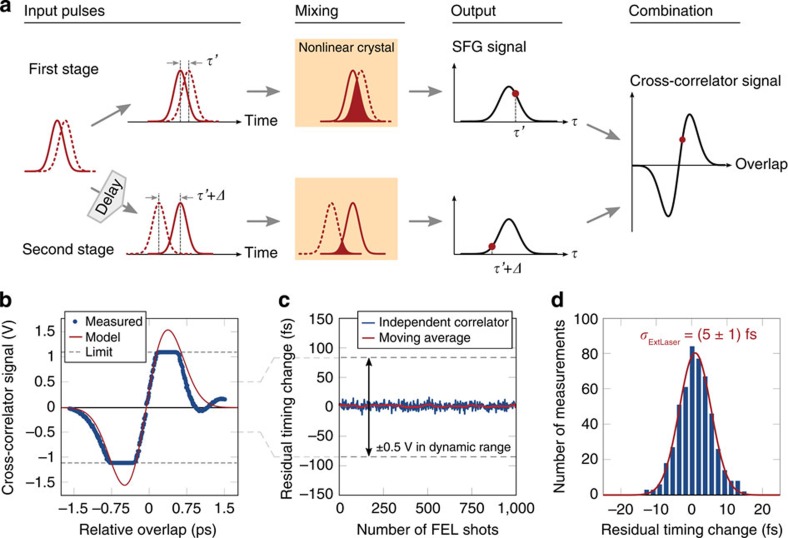
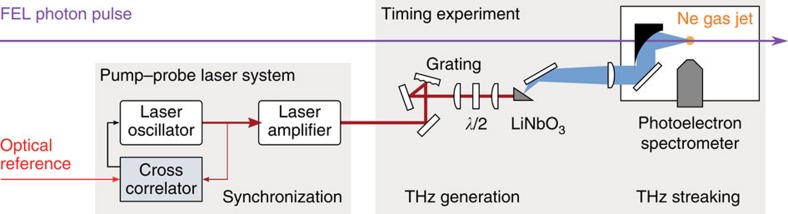
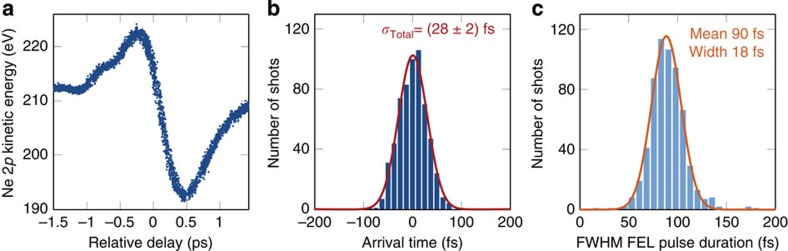
Many advanced applications of X-ray free-electron lasers require pulse durations and time resolutions of only a few femtoseconds. To generate these pulses and to apply them in time-resolved experiments, synchronization techniques that can simultaneously lock all independent components, including all accelerator modules and all external optical lasers, to better than the delivered free-electron laser pulse duration, are needed. Here we achieve all-optical synchronization at the soft X-ray free-electron laser FLASH and demonstrate facility-wide timing to better than 30 fs r.m.s. for 90 fs X-ray photon pulses. Crucially, our analysis indicates that the performance of this optical synchronization is limited primarily by the free-electron laser pulse duration, and should naturally scale to the sub-10 femtosecond level with shorter X-ray pulses.


Figures

Figure 1
Figure 1. FLASH FEL facility.
A macro-pulse of electron bunches is generated in a normal conducting photoinjector. Superconducting modules accelerate the bunches up to 1.25 GeV. Each bunch is compressed at intermediate energies of 150 and 450 MeV in magnetic chicanes. The arrival times of the electron bunches are measured with respect to the master laser oscillator after each compression stage and final acceleration (measurement stations indicated by orange dots in the schematic). The arrival times are incorporated in the feedback control loops for the amplitude and phase of the accelerating fields. The stabilized relativistic electron bunches are used to generate the SASE FEL pulses. Experiments can be carried out in conjunction with an external optical laser, which is synchronized to the master laser oscillator.
Figure 2
Figure 2. Beam-based feedback for accelerator stabilization.
The width of the arrival time distribution for each bunch within the macro-pulse is evaluated over 600 consecutive single shots. As shown in a, the jitter is considerably reduced for bunches at the end of the macro-pulse where the accelerating fields have been corrected using the arrival time of the first bunches. The ‘latency’ period of this feedback spans the first 5 μs (5 bunches). During the ‘feedback adaptation’ period, the effect of the corrections reduces the observed jitter to the final steady-state value. The distribution of arrival times of the last bunch in the macro-pulse is shown in b and has a width of (19±2) fs r.m.s., with accuracy given by the numerical fit.
Figure 3
Figure 3. Optical locking of independent lasers.
Optical cross-correlators measure the relative timing between two pulses. The principle of the device is illustrated in a. In the first stage, two input pulses with arbitrary timing are mixed in a nonlinear crystal resulting in an SFG signal with intensity that depends on their overlap. To determine which pulse arrived first, one of them is delayed by a fixed amount Δ, before they are overlapped again in the second SFG stage. The difference between the SFG intensities allows the exact input timing to be determined without sign ambiguity. A characteristic cross-correlator curve is traced, as illustrated, if the input timing is scanned continuously. A measured scan of the relative timing between the Ti:sapphire pump–probe laser and optical reference laser at FLASH results in the cross-correlator response plotted in b. Outside of the regions where the detector is limited (±1 V), the measured curve matches the curve calculated based on the input laser pulse durations. Once calibrated, the relative timing between the two pulses can be determined with sub-femtosecond accuracy within the ~400 fs dynamic range of the cross-correlator. Using this for feedback, the cavity length of the pump–probe oscillator is varied to lock the relative timing. The residual jitter between the external laser and reference is shown in c, as measured with an independent optical cross-correlator and is found to be (5±1) fs r.m.s., with accuracy given by the numerical fit to the corresponding distribution shown in d.
Figure 4
Figure 4. Relative timing between FEL and external laser.
An external laser is optically locked to the accelerator reference clock signal and used to generate a single-cycle THz pulse by optical rectification in lithium niobate (LiNbO3). The resulting picosecond THz pulse and the FEL pulse are then overlapped in a neon (Ne) gas jet, where the FEL pulse profile and relative arrival time of the pulse with respect to the THz field is measured by streaking spectroscopy. As the THz pulse is phase-locked to the external laser, the arrival time with respect to the THz pulse is equivalent to the arrival time with respect to the external laser.
Figure 5
Figure 5. Facility-wide synchronization characterized by THz streaking.
In a, the kinetic energy of the Ne 2p photoemission peak is plotted as the relative timing between the ionizing FEL pulse and the streaking THz pulse is scanned. Each data point corresponds to a distinct single-shot measurement. The final measured kinetic energy of the photoelectrons depends on the exact arrival time of the FEL pulse. Thus, by evaluating the position of the peak in the single-shot streaked photoelectron spectrum, the arrival time can be determined. Furthermore, the width of the streaked spectrum can be used to simultaneously determine the pulse duration. The arrival time distribution of 600 consecutive FEL pulses recorded at the zero-crossing of the streaking field is shown in b. The jitter is observed to be (28±2) fs r.m.s., with the error given by the numerical fit. The average pulse duration over these 600 consecutive shots was ~90 fs FWHM, with the corresponding distribution shown in c. The FWHM of the single-shot pulse duration was determined with an average measurement precision of 7 fs.
Figure 6
Figure 6. Schematic of a two-colour optical cross-correlator.
The input pulses with arbitrary temporal overlap are combined with a dichroic mirror (DM) for collinear propagation and focused into a type-I phase-matched BBO crystal. In this ‘first stage’, the intensity of the SFG signal depends on the timing of the input pulses. The SFG signal is separated using another DM and measured with ‘detector 1’. The input pulses then pass through a quartz plate, are retro-reflected and pass the quartz plate again, so that one of the pulses is delayed with respect to the other by a fixed amount due to the different group velocities of the different wavelengths in quartz. When they are focused a second time back into the BBO crystal, another SFG signal is produced in the ‘second stage’ and measured with ‘detector 2’. Combination of the two signals gives the relative delay without sign ambiguity. The influence of amplitude fluctuations cancels out in a feedback loop, which keeps the temporal relation of the pulses fixed such that the combined signal is zero.
Figure 7
Figure 7. Fibre link stabilization.
In the fibre link, reference pulses are initially amplified in an erbium-doped fibre amplifier (EDFA). Then, the pulse is split with a polarizing beamsplitter. One component is immediately coupled into the optical cross-correlator, while the other component is propagated down the fibre optic cable that runs along the accelerator tunnel to the remote end station. At the end station, a semi-transparent mirror and a Faraday rotator, which rotates the polarization of the pulse by 90°, partially reflects the pulse back to the entrance of the link. The timing of the back-reflected pulse with respect to a reference laser pulse that has not been propagated through the fibre is then measured in the optical cross-correlator. Changes in the relative timing, corresponding to changes in the transit time or length of the optical fibre, can be used as feedback to stabilize the length of the fibre link using a fast piezo-based fibre-stretcher (‘Piezo’) and a motorized optical delay line (‘Stage’). To accommodate for pulse broadening in the link, a dispersion compensating fibre (DCF) is incorporated.
Figure 8
Figure 8. Fibre link characterization.
The distribution of relative arrival time is compiled from measurements between laser pulses extracted from the fibre link and pulses directly from the master laser oscillator, which were made with an independent out-of-loop optical cross-correlator, as shown in a. Each measurement gives the average temporal overlap over an interval of 2 ms and measurements were made every 5 s for 1 h. Over this period, a residual timing jitter of 0.8 fs r.m.s. was observed, determined from the Gaussian fit to the corresponding distribution shown in b.
Figure 9
Figure 9. Bunch arrival time measurement.
The relativistic electron bunch induces a bipolar transient signal in an antenna, as shown in a. Together with pulses from the optical reference, this signal is coupled into an integrated electro-optic modulator, as sketched in b. The degree of modulation depends on the temporal overlap between the electric signal and the laser pulse, imprinting the arrival time of the electron bunch onto the laser pulse amplitude, which is subsequently measured in a real-time balanced detection scheme.
Figure 10
Figure 10. Streaking map.
The centre-of-mass (COM) of the Ne 2p photoelectron peak is shifted in kinetic energy depending on the temporal overlap of the ionizing FEL pulse and the streaking THz pulse. As the sources are closely synchronized, the shift in kinetic energy as a function of temporal overlap can be accurately mapped by averaging the shift over several single-shot measurements as the relative delay is scanned. Interpolating the averaged, shifted COM at each delay results in a continuous curve that can be used to map the exact arrival time of any streaked photoelectron spectrum generated by an FEL pulse that arrives within the ~720-fs, single-valued streaking ramp (indicated by the shaded region in the plot).

References

    1. Ackermann W. et al. Operation of a free-electron laser from the extreme ultraviolet to the water window. Nat. Photon. 1, 336–342 (2007).
    1. Emma P. et al. First lasing and operation of an angstrom-wavelength free-electron laser. Nat. Photon. 4, 641–647 (2010).
    1. Ishikawa T. et al. A compact X-ray free-electron laser emitting in the sub-ångström region. Nat. Photon. 6, 540–544 (2012).
    1. Allaria E. et al. Highly coherent and stable pulses from the FERMI seeded free-electron laser in the extreme ultraviolet. Nat. Photon. 6, 699–704 (2012).
    1. Düsterer S. et al. Femtosecond X-ray pulse length characterization at the Linac Coherent Light Source free-electron laser. New J. Phys. 13, 093024 (2011).

Publication types