. 2015 Feb 10;4(2):239-54.
doi: 10.1016/j.stemcr.2014.12.007. Epub 2015 Jan 15.

Disequilibrium of BMP2 levels in the breast stem cell niche launches epithelial transformation by overamplifying BMPR1B cell response

Affiliations

Disequilibrium of BMP2 levels in the breast stem cell niche launches epithelial transformation by overamplifying BMPR1B cell response

Marion Chapellier et al. Stem Cell Reports. .

Abstract

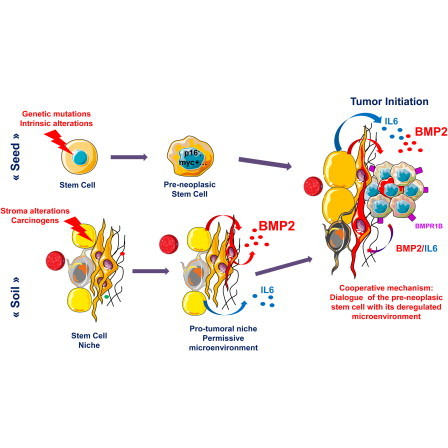
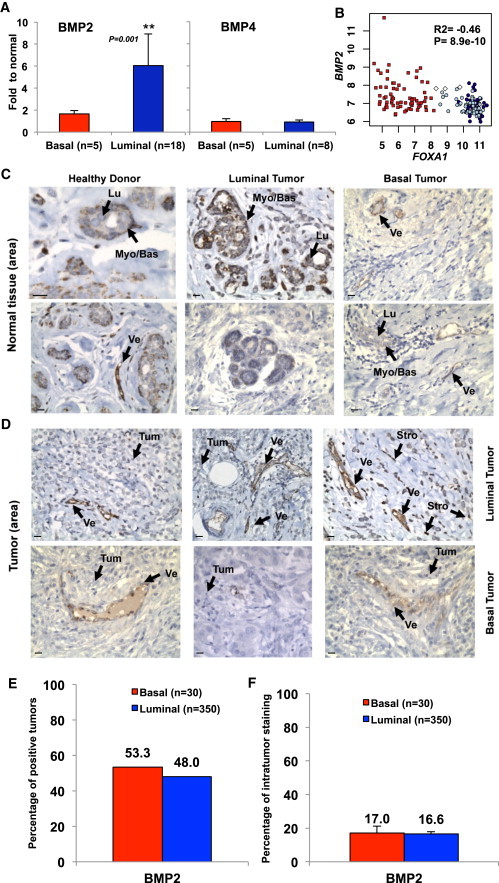
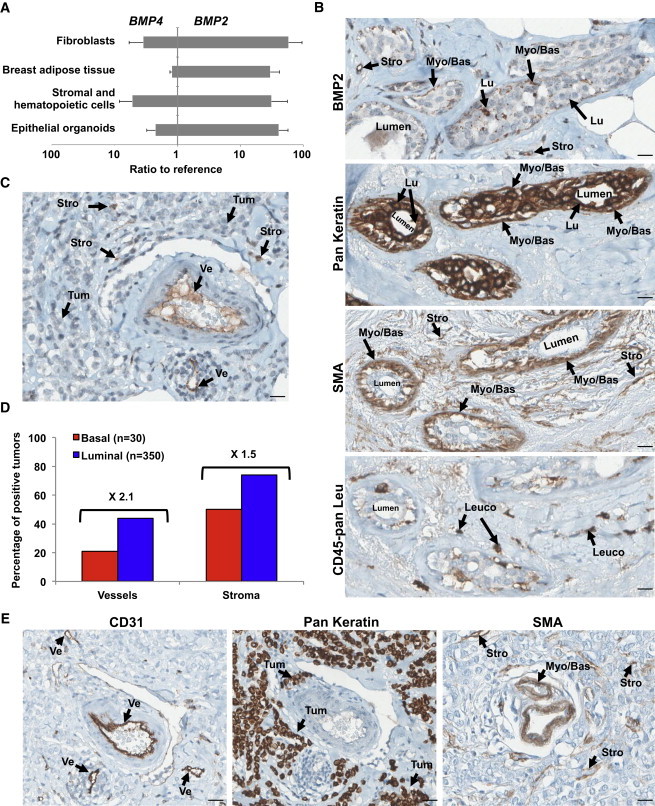
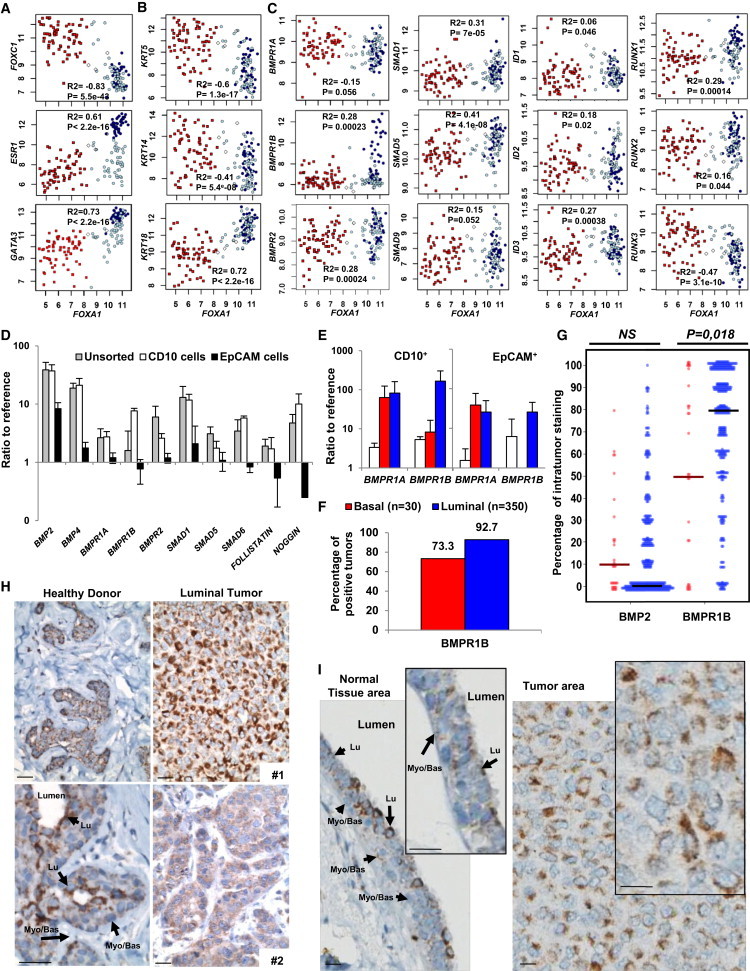
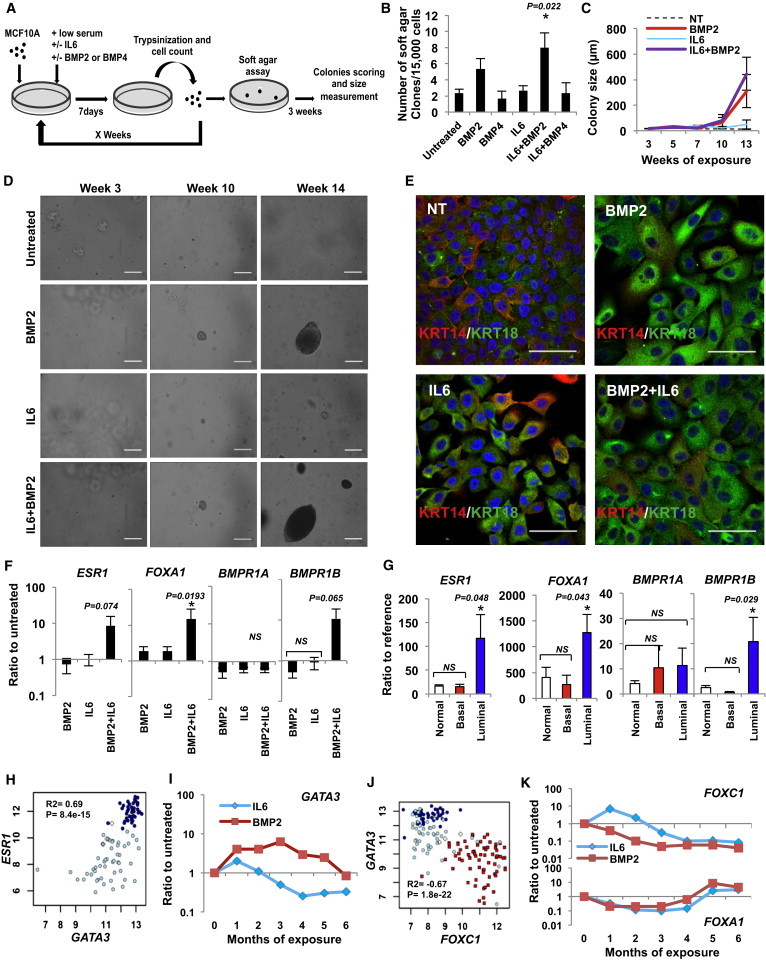
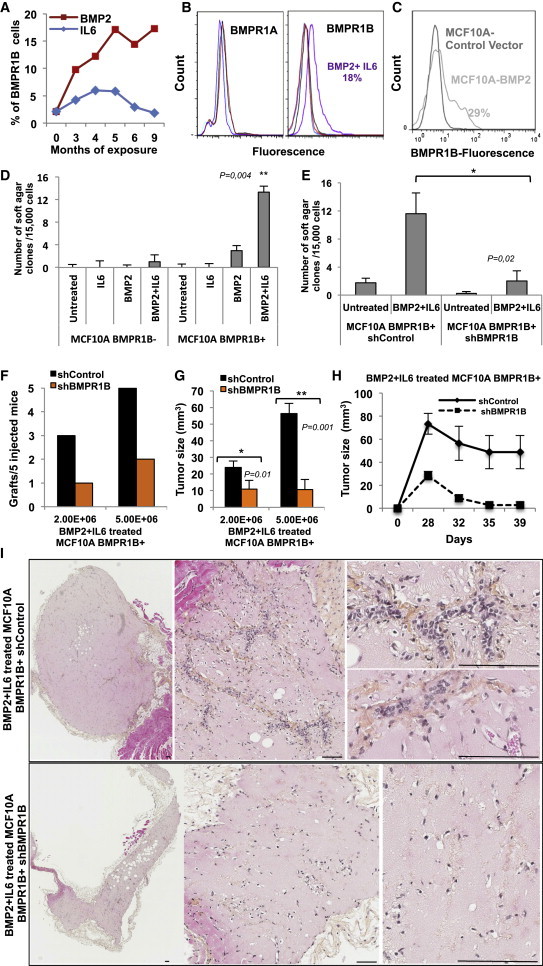
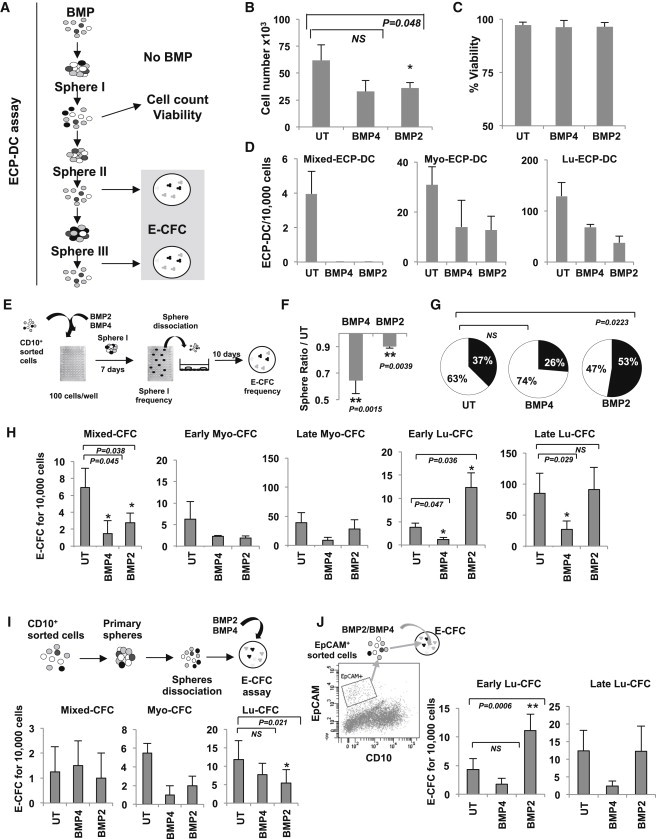
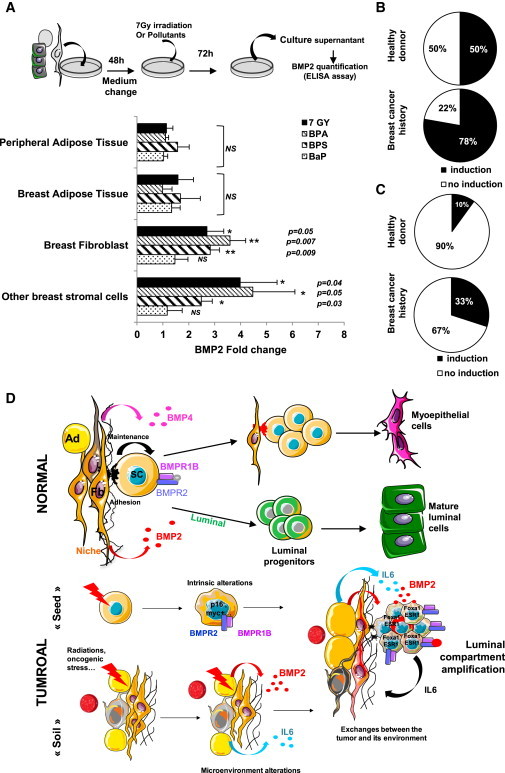
Understanding the mechanisms of cancer initiation will help to prevent and manage the disease. At present, the role of the breast microenvironment in transformation remains unknown. As BMP2 and BMP4 are important regulators of stem cells and their niches in many tissues, we investigated their function in early phases of breast cancer. BMP2 production by tumor microenvironment appeared to be specifically upregulated in luminal tumors. Chronic exposure of immature human mammary epithelial cells to high BMP2 levels initiated transformation toward a luminal tumor-like phenotype, mediated by the receptor BMPR1B. Under physiological conditions, BMP2 controlled the maintenance and differentiation of early luminal progenitors, while BMP4 acted on stem cells/myoepithelial progenitors. Our data also suggest that microenvironment-induced overexpression of BMP2 may result from carcinogenic exposure. We reveal a role for BMP2 and the breast microenvironment in the initiation of stem cell transformation, thus providing insight into the etiology of luminal breast cancer.


Figures

None
Graphical abstract
Figure 1
Figure 1
Luminal Breast Tumors Exhibit Altered BMP2 Expression (A) ELISA quantification of BMP4 and BMP2 in supernatant obtained from normal (n = 6), basal tumor (n = 5), or luminal tumor (n = 17) samples. Data represent the ratio to normal ± SEM, ∗∗p < 0.001. (B) Microarray analysis of BMP2 versus FOXA1 expression. White diamonds, normal samples; red squares, basal tumors; dark blue circles, luminal tumors; light blue circles, apocrine tumors. Pearson’s values of statistical testing R2 and p value are presented. (C and D) IHC analysis of BMP2 expression in (C) normal breast tissue or (D) tumor area. Arrows indicate the following cells: myoepithelial/basal (Myo/Bas), luminal epithelial (Lu), tumor cells (Tum), stromal/fibroblast (Stro), or endothelial vessel (Ve). Scale bar represents 20 μm. (E and F) Quantification of BMP2 IHC staining of 350 luminal and 30 basal tumors. (E) Percentage of tumors that stained positive for BMP2. (F) Percentage of BMP2-positive tumor area.
Figure 2
Figure 2
BMP2 Is Produced by Stromal and Endothelial Cells in Luminal Tumors (A) qPCR analysis of BMP2 and BMP4 expression in indicated cellular fractions from normal human mammoplasty and adipose tissue samples. Data represent the mean ratio to reference ± SEM, n = 5 independent experiments. (B, C, and E) IHC staining for BMP2, epithelial (Pan Keratin), SMA, endothelial (CD31), and pan leukocyte (CD45-pan Leu) of serial sections of the same luminal tumor. (B) Normal peritumoral tissue. (C and E) Tumor tissue. Arrows indicate the following cells: myoepithelial/basal (Myo/Bas), luminal epithelial (Lu), tumor cells (Tum), leukocytes (Leuco), stromal/fibroblast (Stro), or endothelial (Ve). Scale bar represents 20 μm. (D) Quantification of BMP2 IHC staining of 350 luminal and 30 basal tumors. Data are presented as a percentage of BMP2-positive vessels or stromal cells for each subtype.
Figure 3
Figure 3
BMP2 Cooperates with IL-6 to Initiate Mammary Epithelial Cell Transformation (A–C) Microarray analysis of normal and tumor samples for the expression of FOXA1 versus (A) FOXC1, ESR1 or GATA3; (B) KRT5, KRT14, or KRT18; (C) BMPR1A/1B/2, SMAD1/5/9, and target genes ID1/2/3 and RUNX1/2/3. White diamonds, normal samples; red squares, basal; dark blue circles, luminal; light blue circles, apocrine tumors. Pearson’s values of statistical testing R2 and p value are presented. (D) Single cells derived from normal mammoplasties were sorted for CD10 and EpCAM, and qPCR analysis was performed for BMP signaling elements. The expression is represented as the mean ratio to reference ± SEM, n = 8. (E) qPCR analysis of CD10+ and EpCAM+ subpopulations from normal tissue (white bars), luminal (blue bars) and basal (red bars) tumors for BMPR1A and BMPR1B. Data represent the mean ratio to reference ± SEM, n = 3. (D and E) n indicates the number of independent experiments. (F and G) Quantification of BMPR1B IHC staining of 350 luminal and 30 basal tumors. (F) Percentage of tumors that stained positive for BMR1B. (G) Percentage of BMPR1B-positive tumor area for each tumor. Solid bars represent median values. (H) IHC BMPR1B staining of mammoplasty tissue from two different healthy donors and luminal tumor tissue from two patients. Arrows indicate luminal (Lu) and myoepithelial (Myo/Bas) cells. Scale bar represents 20 μm. (I) IHC BMPR1B staining of the same section of luminal tumor 1. (Left) Normal peritumoral tissue. (Right) Tumor tissue. Arrows indicate luminal (Lu) and myoepithelial (Myo/Bas) cells. Scale bar represents 20 μm.
Figure 4
Figure 4
BMP2 Cooperates with IL-6 to Initiate Mammary Epithelial Cell Transformation (A) Protocol representation: MCF10A cells were cultured for x weeks with chronic exposure to BMP2 or BMP4 ± IL-6 (10 ng/ml). Soft agar colony formation assays were performed at each passage and colonies were measured and counted after 3 weeks. (B) Quantification of soft agar colonies at 14 weeks ± SEM, n = 6. (C) Colony size corresponding to x weeks of treatment. Data are presented in μm ± SEM, n = 6. (D) Bright-field images of soft agar clones after x weeks of BMP2 ± IL-6 treatment. Scale bar represents 200 μm. (E) Immunofluorescent staining of MCF10A cells for keratin 14 (KRT14, red) and keratin 18 (KRT18, green) after chronic exposure to BMP2 ± IL-6. Scale bar represents 100 μm. (F) qPCR analysis of ESR1, FOXA1, BMPR1A, and BMPR1B expression after 10-week BMP2 ± IL-6 treatment. Data represent the mean ratio to untreated cells ± SEM, n = 6, p < 0.05. (B, C, and F) n indicates the number of independent experiments. (G) qPCR analysis of ESR1, FOXA1, BMPR1, and BMPR1B expression in normal (n = 10), luminal (n = 16), and basal (n = 4) tumor samples; data represent the mean ratio to reference pool of mammary primary cells ± SEM, p < 0.05. (H and J) Microarray analysis of (H) GATA3 versus ESR1 expression in 92 FOXA1-positive tumors. (J) FOXC1 versus GATA3 expression in normal samples (white diamonds), basal (red squares), luminal (dark blue circles), and apocrine tumors (light blue circles). Pearson’s values of statistical testing R2 and p values are presented. (I and K) Time course representative of six independent experiments of (I) GATA3 or (J) FOXA1 (upper) and FOXC1 (lower) expression in BMP2 versus IL-6-treated cells.
Figure 5
Figure 5
BMPR1B Is Required for the Initiation of Transformation of MCF10A Cells (A) Flow cytometry analysis of BMPR1B expression in MCF10A cells over 9 months of BMP2 or IL-6 chronic exposure. (B) Flow cytometry analysis of BMPR1A and BMPR1B expression in untreated (black) versus BMP2 (red), IL-6 (blue), or BMP2+IL-6-treated (purple) cells at 10 weeks. (C) Flow cytometry analysis of MCF10A cells transduced with a control or BMP2 vector. (D and E) Soft agar colonies numbers ± SEM from MCF10A cells exposed 4 weeks to BMP2 ± IL-6 of four independent experiments,p < 0.05, ∗∗p < 0.005, using either (D) flow cytometry-sorted BMPR1B+ and BMPR1B− cells or (E) BMPR1B+ cells from the same batch transduced with shControl or shBMPR1B lentiviral vector. (F–I) Xenografts of the indicated number of shControl or shBMPR1B-expressing MCF10A cells in nude mice following 6 weeks of BMP2/IL-6 treatment. Data represent (F) number of successful grafts per number of mice and (G) mean tumor size in mm3 after 6 weeks ± SEM, n = 5 mice. (H) Time course of tumor growth following injection with 5E+06 cells. (I) Tumors were harvested after 6 weeks, paraffin embedded, and sectioned. Representative images of H&E stained sections are shown. Scale bar represents 60 μm.
Figure 6
Figure 6
BMP2 and BMP4 Regulate Immature Human Epithelial Mammary Cells (A) Schematic diagram of the ECP-DC assay to determine the influence of BMP treatment on stem cell content. Primary mammary epithelial cells were grown under mammosphere culture conditions ± 50 ng/ml BMP2 or BMP4 for 7 days over several passages. Spheres from 1+x passages were seeded in the ECP-DC assay without BMP treatment. (B) Proliferation of cells in response to BMP treatment. Number of cells ± SEM, n = 6, p < 0.05. (C) Percentage of viable cells ± SEM, n = 6. (D) Effect of BMP treatment on ECP-DC formation. Date represent the number of luminal (Lu-ECP-DC), myoepithelial (Myo-ECP-DC), and mixed ECP-DC colonies derived from secondary spheres ± SEM, n = 3. (E) Schematic diagram depicting E-CFC assay for the analysis of progenitor content. (F) Sphere formation in presence of 50 ng/ml BMP2/4. The sphere frequency is shown ± SEM, n = 7. (G) The percentage of sphere-derived cells that form colonies are shown (n = 3). UT, untreated; white area of chart, no E-CFC formation; black, E-CFC. (H) E-CFC assay: Cells were treated as shown in (E), and mixed, early/late myoepithelial, early/late luminal CFC (Mixed-CFC, Early Myo-CFC, Late Myo-CFC, Early Lu-CFC, and Late Lu-CFC) were scored as described in Figures S5B and S5C, ± SEM, n = 9. (I) CD10+ cells were grown as spheres and seeded in the E-CFC assay in the presence of 50 ng/ml BMP2/4. The colony number is shown ± SEM, n = 4. (J) EpCAM+ cells were directly seeded in the E-CFC assay ± 50 ng/ml BMP2/4. The colony number is shown ± SEM, n = 9, p < 0.05. (B–D and F–J) n indicates the number of independent experiments.
Figure 7
Figure 7
BMP2, which Production Is Induced by Carcinogens, Is Involved in Regulation and Transformation of Human Mammary Stem Cells (A) ELISA quantification of BMP2 after exposure of peripheral adipose tissue (n = 7), breast adipose tissue (n = 4), breast fibroblasts (n = 6), and stromal cells (n = 9) to 7 Gy irradiation, 10−7 M Bisphenol A/S (BPA/BPS), 10−10 M Benz(a)pyrene (BaP). BMP2 levels are represented as ratios to untreated control ± SEM. (B and C) Induction of BMP2 expression after 10−7 M BPA treatment of fibroblasts from adipose or breast tissue from healthy donors or breast cancer patients at least 1 year after treatment. Data represent the percentage of patients showing an induction of BMP2 expression quantified by (B) qPCR (healthy donor, n = 15; breast cancer history, n = 10) or (C) ELISA (healthy donor, n = 10; breast cancer history, n = 10). (D) Proposed mechanism of BMP2 function. In the normal breast, BMP2 commits common progenitors to the luminal lineage, while BMP4 favors the maintenance of immature cells and myoepithelial differentiation. Exposure to environmental carcinogens increases BMP2 levels. Intrinsic alterations of luminal progenitors make the cells susceptible to BMP2 and IL-6-dependent changes of the microenvironment, leading to full transformation. Ad, adipocyte; Fb, fibroblast; SC, stem cell.

References

    1. Alarmo E.L., Huhtala H., Korhonen T., Pylkkanen L., Holli K., Kuukasjarvi T., Parkkila S., Kallioniemi A. Bone morphogenetic protein 4 expression in multiple normal and tumor tissues reveals its importance beyond development. Mod. Pathol. 2013;26:10–21. - PubMed
    1. Bachelard-Cascales E., Chapellier M., Delay E., Pochon G., Voeltzel T., Puisieux A., Caron de Fromentel C., Maguer-Satta V. The CD10 enzyme is a key player to identify and regulate human mammary stem cells. Stem Cells. 2010;28:1081–1088. - PubMed
    1. Bachelard-Cascales E., Chapellier M., Delay E., Maguer-Satta V. A protocol to quantify mammary early common progenitors from long-term mammosphere culture. Curr. Protoc. Stem Cell Biol. 2012;Chapter 1 Unit 1E.7, 1E.7.1–1E.7.6. - PubMed
    1. Balboni A.L., Hutchinson J.A., DeCastro A.J., Cherukuri P., Liby K., Sporn M.B., Schwartz G.N., Wells W.A., Sempere L.F., Yu P.B., DiRenzo J. ΔNp63α-mediated activation of bone morphogenetic protein signaling governs stem cell activity and plasticity in normal and malignant mammary epithelial cells. Cancer Res. 2013;73:1020–1030. - PMC - PubMed
    1. Ben-Jonathan N., Hugo E.R., Brandebourg T.D. Effects of bisphenol A on adipokine release from human adipose tissue: Implications for the metabolic syndrome. Mol. Cell. Endocrinol. 2009;304:49–54. - PMC - PubMed

Publication types

MeSH terms

Substances