. 2015 Jan 20:5:7885.
doi: 10.1038/srep07885.

Simultaneous impairment of mitochondrial fission and fusion reduces mitophagy and shortens replicative lifespan

Affiliations

Simultaneous impairment of mitochondrial fission and fusion reduces mitophagy and shortens replicative lifespan

Dominik Bernhardt et al. Sci Rep. .

Abstract

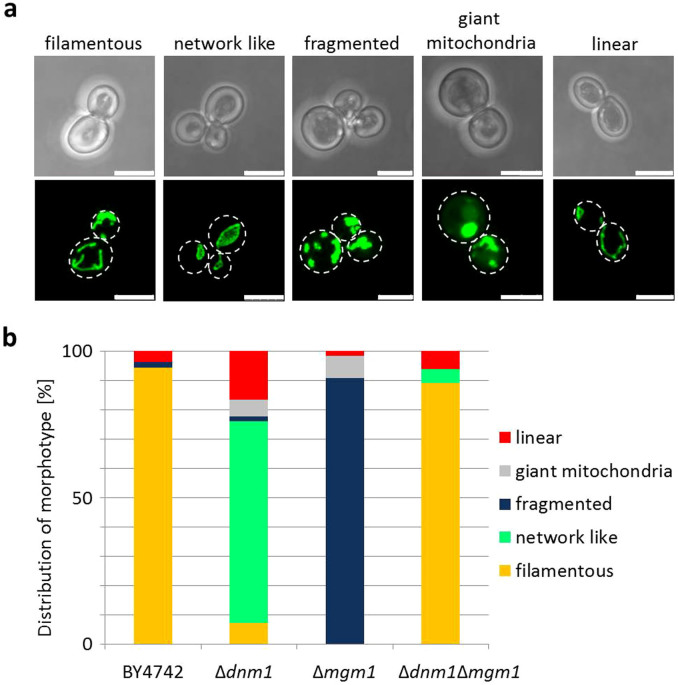
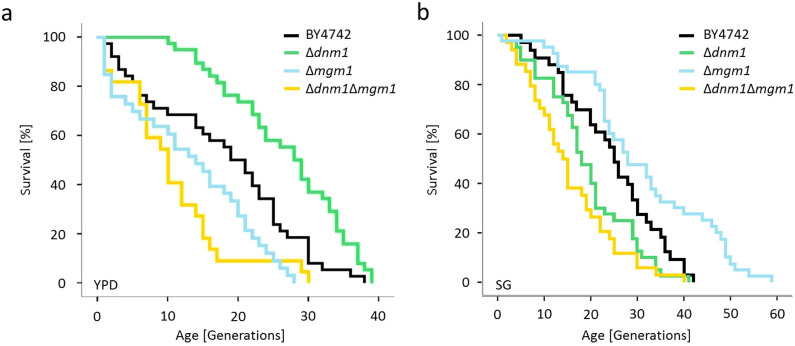
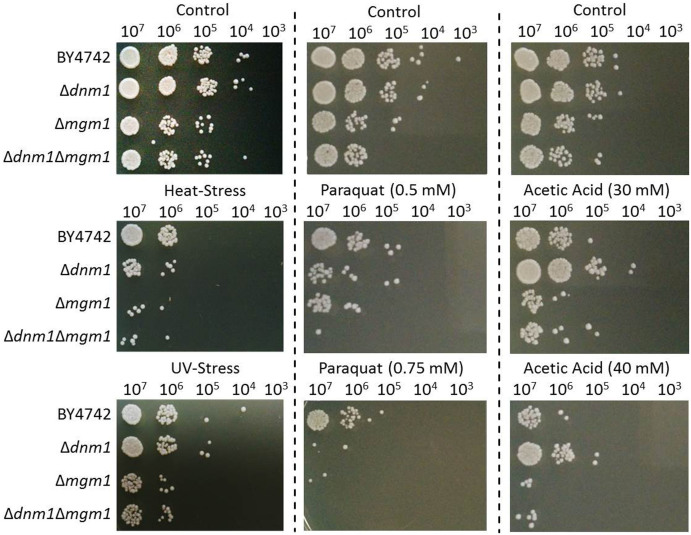
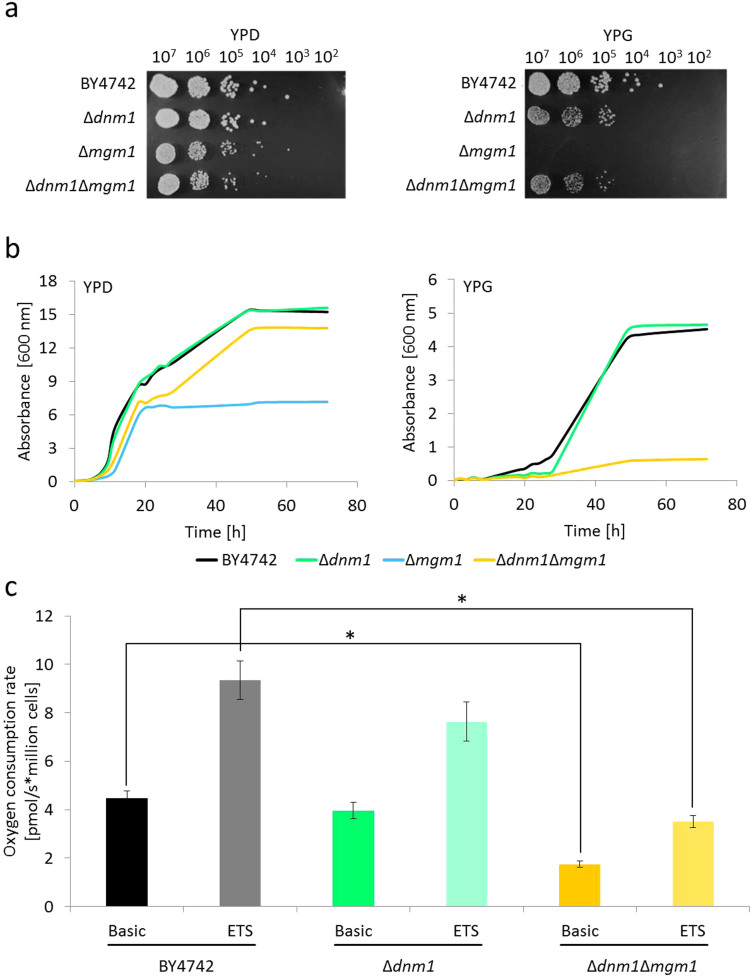
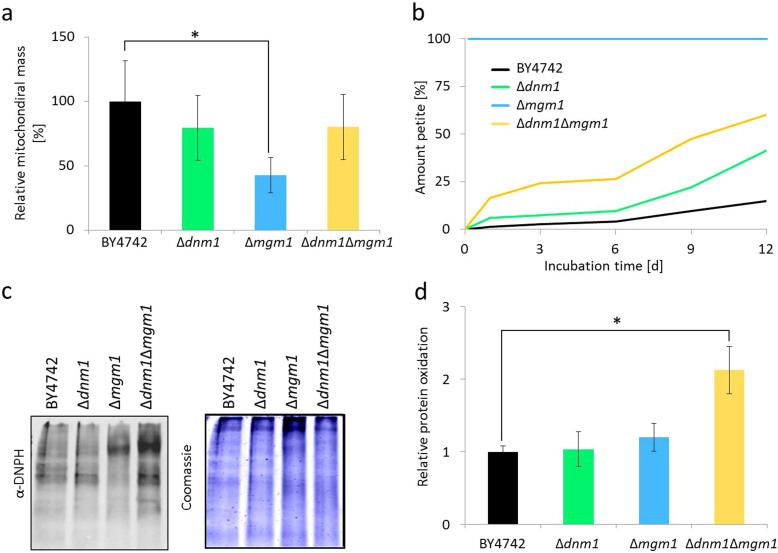
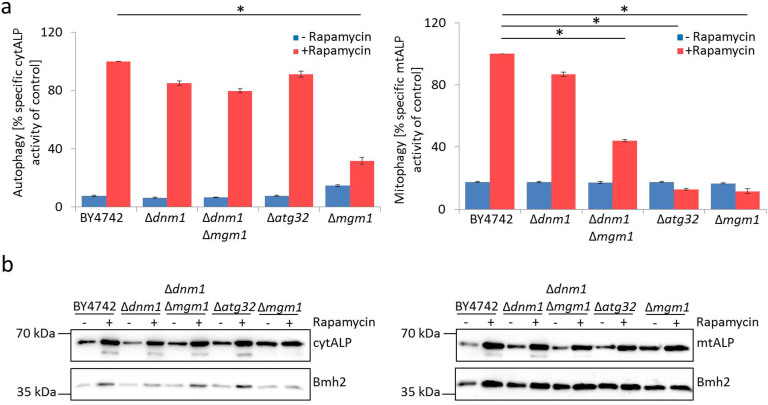
Aging of biological systems is accompanied by degeneration of mitochondrial functions. Different pathways are active to counteract the processes which lead to mitochondrial dysfunction. Mitochondrial dynamics, the fission and fusion of mitochondria, is one of these quality control pathways. Mitophagy, the controlled degradation of mitochondria, is another one. Here we show that these pathways are linked. A double deletion mutant of Saccharomyces cerevisiae in which two essential components of the fission and fusion machinery, Dnm1 and Mgm1, are simultaneously ablated, contain wild-type like filamentous mitochondria, but are characterized by impaired respiration, an increased sensitivity to different stressors, increased mitochondrial protein carbonylation, and a decrease in mitophagy and replicative lifespan. These data show that a balanced mitochondrial dynamics and not a filamentous mitochondrial morphotype per se is the key for a long lifespan and demonstrate a cross-talk between two different mitochondrial quality control pathways.


Figures

Figure 1
Figure 1. Mitochondrial morphotypes in the investigated yeast strains.
The indicated strains were transformed with mitochondrial localized GFP (mtGFP). Z-stacks of individual cells (BY4742 n = 52; Δdnm1 n = 54; Δmgm1 n = 65; Δdnm1Δmgm1 n = 64) were taken by confocal laser scanning microscopy and individually matched to one of five morphotypes. (a) Representative examples for each morphotype are shown. Scale bars represent 5 μm of length. The proportion of the different morphotypes was determined by counting the above indicated number of cells of each strain. (b) The predominant morphotype in the analyzed strains were: BY4742, 94% filamentous; Δdnm1, 69% network like; Δmgm1, 91% fragmented; Δdnm1Δmgm1, 89% filamentous.
Figure 2
Figure 2. Replicative lifespan with different carbon sources.
(a) Lifespan of the indicated strains (BY4742 n = 39; Δdnm1 n = 39; Δmgm1 n = 34; Δdnm1Δmgm1 n = 23) was determined on YPD medium. Strains were cultivated at 30°C and separated from their daughter cells by micromanipulation (mean lifespan: BY4742 = 18 generations; Δdnm1 = 26.8 generations; Δmgm1 = 13.2 generations; Δdnm1Δmgm1 = 10.8 generations). Significance was tested by SPSS with the Log Rank (Mantel-Cox) (BY4742/Δdnm1 p = 0.001; BY4742/Δmgm1 p = 0.01; BY4742/Δdnm1Δmgm1 p = 0.004; Δmgm1dnm1Δmgm1 p = 0.508), Breslow (Generalized Wilcoxon) (BY4742/Δdnm1 p = 0.0005; BY4742/Δmgm1 p = 0.035; BY4742/Δdnm1Δmgm1 p = 0.009; Δmgm1dnm1Δmgm1 p = 0.305) and the Tarone-Ware (BY4742/Δdnm1 p = 0.001; BY4742/Δmgm1 p = 0.021; BY4742/Δdnm1Δmgm1 p = 0.005; Δmgm1dnm1Δmgm1 p = 0.288) test. (b) Lifespan of the indicated strains (BY4742 n = 33; Δdnm1 n = 40; Δmgm1 n = 40; Δdnm1Δmgm1 n = 34) was determined on SG medium used during the mitophagy assay. Strains were cultivated at 30°C and separated from their daughter cells by micromanipulation (mean lifespan: BY4742 = 24.4 generations; Δdnm1 = 19.3 generations; Δmgm1 = 31.2 generations; Δdnm1Δmgm1 = 15.6 generations). Significance was tested by SPSS with the Log Rank (Mantel-Cox) (BY4742/Δdnm1 p = 0.031; BY4742/Δmgm1 p = 0.008; BY4742/Δdnm1Δmgm1 p = 0.001; Δdnm1dnm1Δmgm1 p = 0.125), Breslow (Generalized Wilcoxon) (BY4742/Δdnm1 p = 0.039; BY4742/Δmgm1 p = 0.027; BY4742/Δdnm1Δmgm1 p = 0.001; Δdnm1dnm1Δmgm1 p = 0.067) and the Tarone-Ware (BY4742/Δdnm1 p = 0.031; BY4742/Δmgm1 p = 0.028; BY4742/Δdnm1Δmgm1 p = 0.002; Δdnm1dnm1Δmgm1 p = 0.082) test.
Figure 3
Figure 3. Resistance of strains against different stresses.
Cells grown to the logarithmic phase were plated in serial dilutions (3 μl drops of a 107–103 cells/ml solution) on YPD medium and treated with different stressors (UV-Stress irradiated at 100 J/m2, Heat-Stress 3.5 hr. at 37°C, 0.5 or 0.75 mM paraquat, 30 or 40 mM acetic acid for 300 min in YPD before plating). Plates were incubated for two days at 30°C.
Figure 4
Figure 4. Analysis of energy metabolism.
(a) Samples from a culture grown to the exponential phase were serial diluted and plated onto YPD and YPG plates (3 μl drops of 107–102 cells per ml solution), respectively followed by incubation at 30°C for two days. (b) Cells were grown in liquid YPD (start OD600: 0.08) or YPG (start OD600: 0.02) at 30°C. Samples were taken at different time points and OD600 was measured. (c) High resolution respirometry was performed to determinate the normal respiration capacity and respiration after stepwise addition of the uncoupling reagent FCCP to the indicated strain. Measurements were performed in YPG medium at 30°C. The ground value of all oxidases was taken after edition of antimycin A to inhibit the respiratory chain (complex III) and were subtracted from the measured data of the normal respiration and after addition of FCCP to obtain the Basic and maximal electron transport system capacity (ETS), respectively (BY4742 Basic/Δdnm1Δmgm1 Basic p = 8.5 E-6; BY4742 ETS/Δdnm1Δmgm1 ETS p = 7.3 E-5). Measurements were performed with biological replicates of BY4742 (n = 10), Δdnm1 (n = 4) and Δdnm1Δmgm1 (n = 6). Statistic tests were performed with the ″Students t-test″ and error bars represent the standard error.
Figure 5
Figure 5. Analysis of mitochondrial mass and quality.
(a) Cells expressing mtGFP were analysed by condocal laser scanning microscopy. Mitochondrial area of maximal projected z-stacks (BY4742 n = 52; Δdnm1 n = 54; Δmgm1 n = 65; Δdnm1Δmgm1 n = 64) was measured with the ImageJ software (BY4742/Δmgm1 p = 0.03). (b) The indicated strains were cultivated in YPG medium at 30°C and subsequently used to inoculate an YPD liquid culture at 30°C. Samples were taken after 1, 3, 6, 9 and 12 days for plating on YPDGly medium. The amount of small (petite) and large colonies was determined after 2–3 days. The Δmgm1 strain as a petite mutant is indicated by a straight blue line at 100% petites. (c) For the analysis of protein oxidation, 15 μg of mitochondrial extracts was derivatized with 2,4-dinitrophenylhydrazine, followed by western blot analysis. The derivatized carbonyl groups were detected by α-DNPH. The coomassie stained gel was used as a loading control. (d) The relative protein oxidation was calculated for three biological replicates from scans of oxy-blots using an infrared scanner. Error bars represent the standard error (BY4742/Δdnm1Δmgm1 p = 0.022). Statistic tests were performed with the ″Students t-test″ and error bars represent the standard error.
Figure 6
Figure 6. Analysis of mitophagy and autophagy.
(a) The indicated strains deleted for endogenous PHO8 and expressing cytALP (marker for autophagy) or mtALP (marker for mitophagy) were analyzed during exponential growth or upon rapamycin treatment (1 μM, 24 h) in glycerol-containing medium. Autophagy and mitophagy were quantified by determination of specific ALP activity upon cell lysis. Specific activities are given as means (n = 4) normalized to the wild type control upon rapamycin treatment. (b) Proteolytic processing of mtALP and cytALP was analyzed by western blotting of total cell extracts and Bmh2 served as a control. Statistic tests were performed with the ″Students t-test″ and error bars represent the standard error (Autophagy: BY4742/Δmgm1 p = 3.8*10−7 Mitophagy: BY4742/Δdnm1Δmgm1 p = 3.2*10−8; BY4742/Δatg32 p = 3.6*10−10; BY4742/Δmgm1 p = 1.5*10−8).

References

    1. Okamoto K. & Shaw J. M. Mitochondrial morphology and dynamics in yeast and multicellular eukaryotes. Annu. Rev. Genet. 39, 503–536 (2005). - PubMed
    1. Westermann B. Mitochondrial dynamics in model organisms: what yeasts, worms and flies have taught us about fusion and fission of mitochondria. Semin. Cell Dev. Biol. 21, 542–549 (2010). - PubMed
    1. Hermann G. J. et al. Mitochondrial fusion in yeast requires the transmembrane GTPase Fzo1p. J. Cell Biol. 143, 359–373 (1998). - PMC - PubMed
    1. Jones B. A. & Fangman W. L. Mitochondrial DNA maintenance in yeast requires a protein containing a region related to the GTP-binding domain of dynamin. Genes Dev. 6, 380–389 (1992). - PubMed
    1. Sesaki H. & Jensen R. E. UGO1 encodes an outer membrane protein required for mitochondrial fusion. J. Cell Biol. 152, 1123–1134 (2001). - PMC - PubMed

Publication types

MeSH terms

Substances

LinkOut - more resources