Review
. 2015 Jan 19;208(2):147-60.
doi: 10.1083/jcb.201407004.

Peaks cloaked in the mist: the landscape of mammalian replication origins

Affiliations
Review

Peaks cloaked in the mist: the landscape of mammalian replication origins

Olivier Hyrien. J Cell Biol. .

Abstract

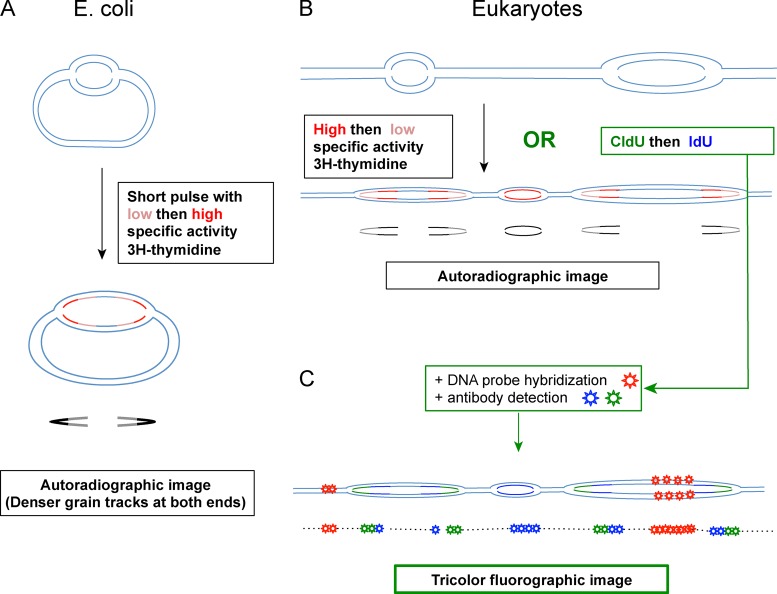
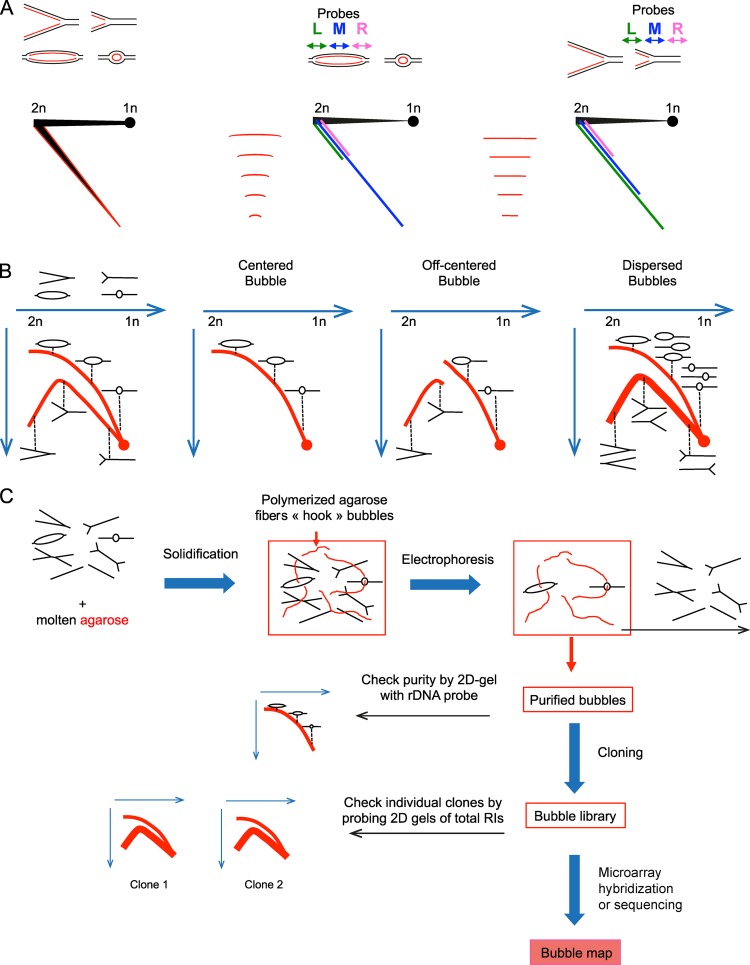
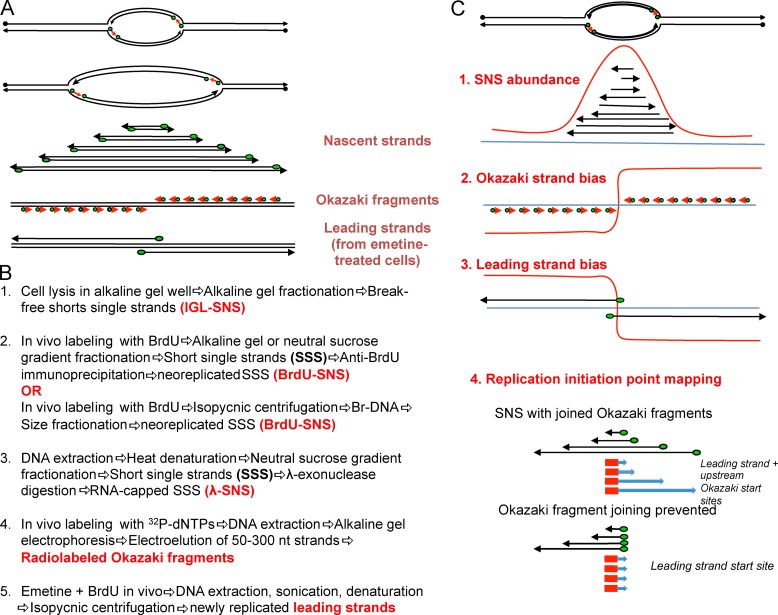
Replication of mammalian genomes starts at sites termed replication origins, which historically have been difficult to locate as a result of large genome sizes, limited power of genetic identification schemes, and rareness and fragility of initiation intermediates. However, origins are now mapped by the thousands using microarrays and sequencing techniques. Independent studies show modest concordance, suggesting that mammalian origins can form at any DNA sequence but are suppressed by read-through transcription or that they can overlap the 5' end or even the entire gene. These results require a critical reevaluation of whether origins form at specific DNA elements and/or epigenetic signals or require no such determinants.


Figures

Figure 1.
Figure 1.
Replication mapping by DNA fiber techniques. (A and B) DNA fiber autoradiography (Cairns, 1963; Huberman and Riggs, 1968). Cells are labeled with [3H]thymidine, gently lysed on a glass slide, covered with photographic emulsion, and exposed for several months to reveal the stretches of radiolabeled spread DNA as silver grain tracks. (A) Intact E. coli chromosomal DNA labeled for several generations showed θ forms, suggesting replication by the fork mechanism and a single initiation event per chromosome. Brief sequential pulses of low and high activity produced grain tracks denser on both ends than in the middle, providing evidence for bidirectional replication (Prescott and Kuempel, 1972). (B) Pulse-labeled DNA from eukaryotic cells showed tandem tracks, indicating multiple bidirectional origins (Huberman and Riggs, 1968). (C) In DNA fiber fluorography, cells are typically pulsed with chlorodeoxyuridine (CldU) and then iododeoxyuridine (IdU; or vice versa), and the labeled tracks are detected with appropriate fluorescent antibodies, shortening imaging times to seconds. DNA can be spread by direct cell lysis on a glass slide (Jackson and Pombo, 1998), by attachment of purified DNA molecule ends to silanized coverslips before parallel stretching by a receding air/water meniscus (DNA combing; Michalet et al., 1997), or by capillary stretching between slide and coverslip (Norio and Schildkraut, 2001). CldU/IdU detection (green/blue) can be combined with FISH with specific DNA probes (red) to identify and orient target DNA molecules (Norio and Schildkraut, 2001; Anglana et al., 2003). Unlabeled DNA (dotted line) may be simultaneously detected in a fourth color with anti-DNA antibodies. In a variation called SMARD (Norio and Schildkraut, 2001), the labeled DNA is cut with a rare cutter restriction endonuclease, and a large (100–500 kb) target fragment is enriched by pulsed-field gel electrophoresis before stretching and detection. In this case, long CldU/IdU labeling times are needed to chase forks out of the labeled fragments before their electrophoretic separation. Tens to hundreds of single DNA molecules 100–1,000 kb in size identified by FISH are analyzed in a typical SMARD or DNA combing experiment.
Figure 2.
Figure 2.
Replication mapping by restriction fragment shape or strand composition analysis. (A) Neutral/alkaline 2D gel technique (Huberman et al., 1987). A restriction digest of total DNA is enriched for partially single-stranded, replication fork–containing fragments, by chromatography on BND (benzyl-naphtyl-DEAE)-cellulose. The enriched material is first separated in neutral agarose so that replication intermediates (RIs) of each fragment are resolved according to mass (horizontal arrows). Parental and nascent strands are then melted and resolved in an orthogonal direction in alkaline agarose (vertical arrows). After membrane transfer, center or end probes (noted left [L], middle [M], and right [R]) are used to reveal whether nascent strands grow from the center by internal initiation or from either end by entry of outside-initiated forks. The diagonal smear of nascent strands detected by each probe is indicated in the same color as the probe. (B) Neutral/neutral 2D gel technique (Brewer and Fangman, 1987). A restriction digest of total DNA is enriched in replication intermediates and separated in a first electrophoresis as in A. Branched fragments of similar mass but various shapes are then resolved in an orthogonal neutral electrophoresis using conditions that maximize contribution of shape to migration rate. Transfer and hybridization reveal whether the fragment’s replication intermediates contain two diverging forks (bubbles, internal initiation), one fork (simple Ys, passive replication), or two converging forks (double Ys, termination; not depicted). Panels illustrate the patterns obtained in case of centered, off-centered, or random initiation within the restriction fragment. (C) Bubble trap (Mesner et al., 2006). A restriction digest of total DNA enriched in replication intermediates by isolation on the nuclear matrix and chromatography on BND-cellulose is mixed with molten agarose, allowed to solidify, and electrophoresed out of the agarose plug. Bubbles become topologically trapped in the gel as a result of agarose fiber polymerization through their circular structure, whereas replication intermediates of other shapes can migrate out of the plug. Trapped bubbles are then cloned in a plasmid library and either hybridized to microarrays (Mesner et al., 2011) or sequenced (Mesner et al., 2013). Library purity is estimated to >80% by 2D gel analysis of the trapped material or by probing 2D gels of total replication intermediates with individual clones and scoring for a bubble arc.
Figure 3.
Figure 3.
Replication mapping by nascent strand abundance or polarity analysis. (A) Schematic drawing of nascent strands, Okazaki fragments, and leading strands synthesized at an origin. (B) Simplified flowcharts for isolating short nascent strands (SNSs), Okazaki fragments, or leading strands. (C) Principles of origin mapping by replicative strand analysis. In SNS abundance assays (B, 1–3; and C, 1), total DNA is denatured and SSS in the 0.5–3-kb range are isolated on sucrose gradients or agarose gels, taking care to exclude the smaller Okazaki fragments (<0.5 kb). SSS include SNS synthesized specifically at origins as well as inadvertently sheared or nicked strands, which sample the entire genome and typically form the vast majority of SSS molecules. SNS enrichment has been achieved (a) by lysing cells directly into the well of an alkaline agarose gel to minimize breakage before size fractionation (B, 1; in-gel lysis [IGL]-SNS), (b) by labeling neosynthetized DNA with BrdU and purifying the Br-DNA by immunoprecipitation (B, 2) or isopycnic centrifugation (B, 3; BrdU-SNS), and (c) by treating SSS with λ-exonuclease, a 5′-exonuclease that digests DNA but not RNA, to eliminate all DNA strands except nascent strands with an attached RNA primer (B, 4; λ-SNS). The latter strategy requires heat denaturation and neutral gradient purification of SSS to avoid RNA primer hydrolysis. Origins can be mapped by determining relative SNS abundance at closely spaced genomic positions (C, 1) by quantitative PCR (Vassilev et al., 1990), microarray hybridization (Lucas et al., 2007), or high-throughput sequencing (Besnard et al., 2012). Alternatively, SNS have been metabolically labeled with radioactive precursors and used to probe macroarrays representing highly amplified genomic loci (Dijkwel et al., 2002). (B, 4; and C, 2) Lagging-strand polarity assay (Hay and DePamphilis, 1982). Cells are pulse labeled with BrdUTP and radioactive precursors. Labeled Okazaki fragments are purified by size and immunoprecipitation and hybridized to immobilized, strand-specific probes spanning the locus of interest to determine the lagging-strand template (Burhans et al., 1990; Wang et al., 1998). Alternatively, Okazaki fragments accumulated after ligase inactivation are size purified and sequenced (Smith and Whitehouse, 2012). Template switches of opposite direction are observed at initiation and termination sites. The length of DNA over which the switch occurs indicates the size of the initiation or termination zone. (B, 5; and C, 3) Leading-strand polarity assay (Handeli et al., 1989). Cells are treated with emetine to prevent lagging-strand synthesis. Leading strands are density labeled with BrdU, isolated by isopycnic centrifugation, and hybridized with strand-specific probes spanning the locus of interest to determine the template of leading strand synthesis. The precise mechanism by which emetine, a protein synthesis inhibitor, specifically inhibits lagging-strand synthesis is still unclear (Burhans et al., 1991). (C, 4) Replication initiation point mapping (Bielinsky and Gerbi, 1998). (top) SNS 5′ ends can be mapped at nucleotide resolution by extension of a labeled downstream primer (red + blue arrows) followed by sequencing gel electrophoresis. (bottom) The leading-strand start sites are distinguished from the 5′ end of upstream joined Okazaki fragments by preventing joining in yeast ligase mutants (Bielinsky and Gerbi, 1999) or lagging-strand synthesis in mammalian cells treated with emetine (Abdurashidova et al., 2000). Ligation-mediated (Abdurashidova et al., 2000) or one-way (Romero and Lee, 2008) PCR amplification of SNS has been used to increase the sensitivity to the level required for the human genome.

Similar articles

Cited by

References

    1. Abdurashidova G., Deganuto M., Klima R., Riva S., Biamonti G., Giacca M., and Falaschi A.. 2000. Start sites of bidirectional DNA synthesis at the human lamin B2 origin. Science. 287:2023–2026 10.1126/science.287.5460.2023 - DOI - PubMed
    1. Aladjem M.I., Groudine M., Brody L.L., Dieken E.S., Fournier R.E., Wahl G.M., and Epner E.M.. 1995. Participation of the human β-globin locus control region in initiation of DNA replication. Science. 270:815–819 10.1126/science.270.5237.815 - DOI - PubMed
    1. Aladjem M.I., Rodewald L.W., Kolman J.L., and Wahl G.M.. 1998. Genetic dissection of a mammalian replicator in the human β-globin locus. Science. 281:1005–1009 10.1126/science.281.5379.1005 - DOI - PubMed
    1. Aladjem M.I., Rodewald L.W., Lin C.M., Bowman S., Cimbora D.M., Brody L.L., Epner E.M., Groudine M., and Wahl G.M.. 2002. Replication initiation patterns in the β-globin loci of totipotent and differentiated murine cells: evidence for multiple initiation regions. Mol. Cell. Biol. 22:442–452 10.1128/MCB.22.2.442-452.2002 - DOI - PMC - PubMed
    1. Altman A.L., and Fanning E.. 2004. Defined sequence modules and an architectural element cooperate to promote initiation at an ectopic mammalian chromosomal replication origin. Mol. Cell. Biol. 24:4138–4150 10.1128/MCB.24.10.4138-4150.2004 - DOI - PMC - PubMed

Publication types

LinkOut - more resources