. 2015 Jan 29;160(3):461-76.
doi: 10.1016/j.cell.2014.12.017. Epub 2015 Jan 15.

Elimination of unfit cells maintains tissue health and prolongs lifespan

Affiliations

Elimination of unfit cells maintains tissue health and prolongs lifespan

Marisa M Merino et al. Cell. .

Abstract

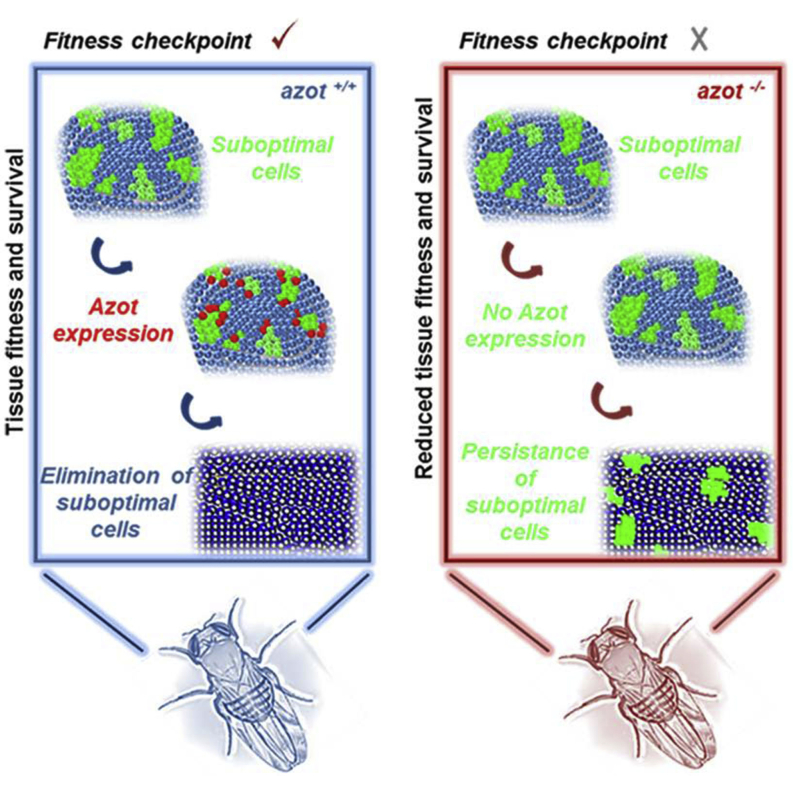
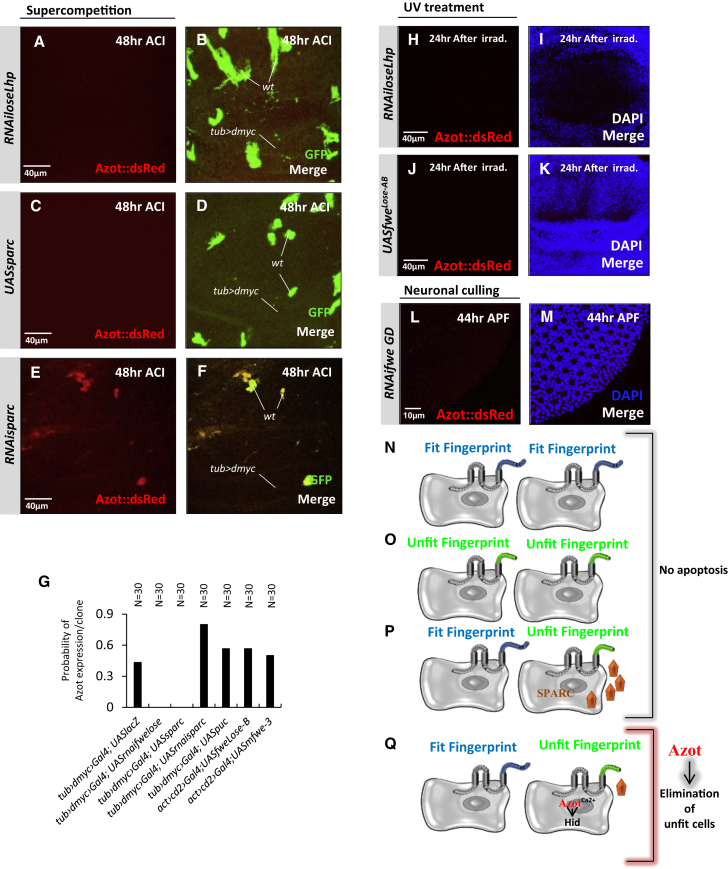
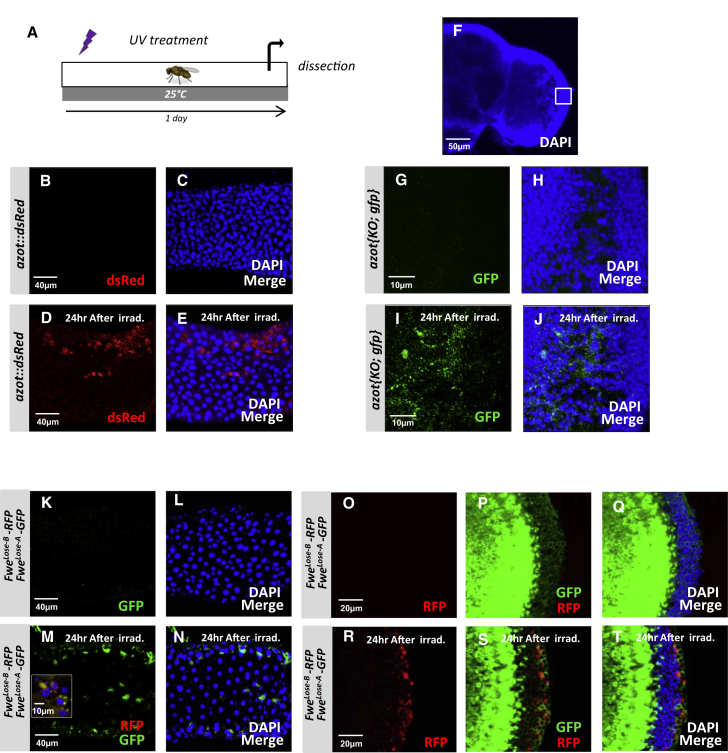
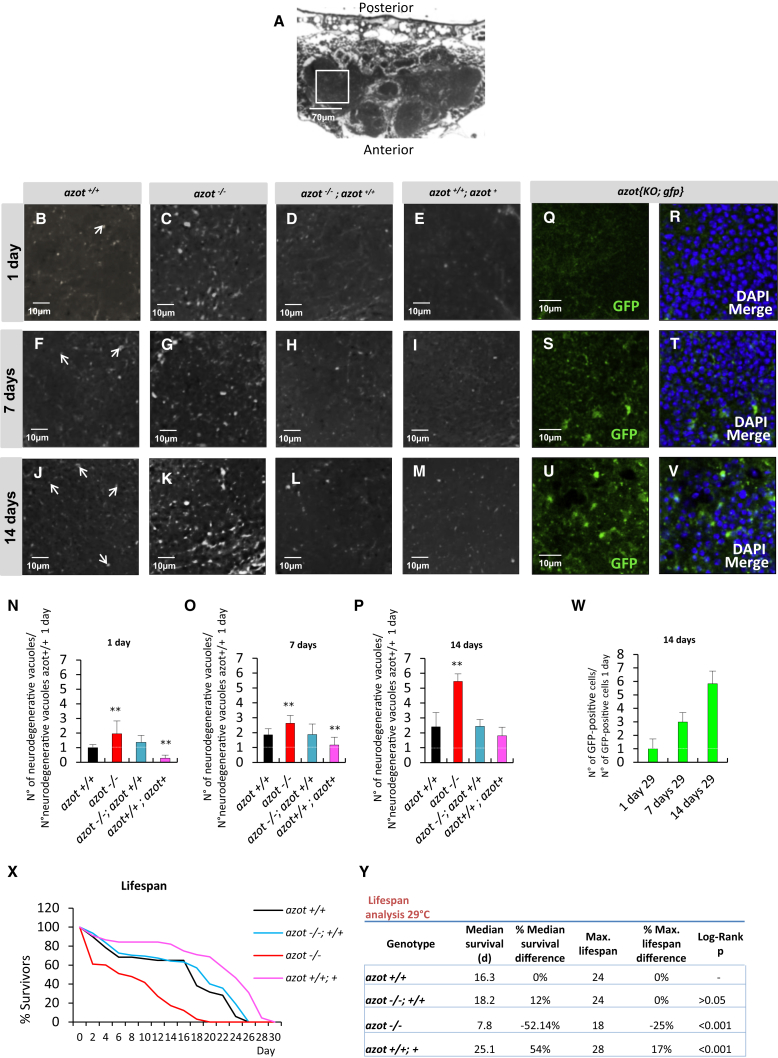
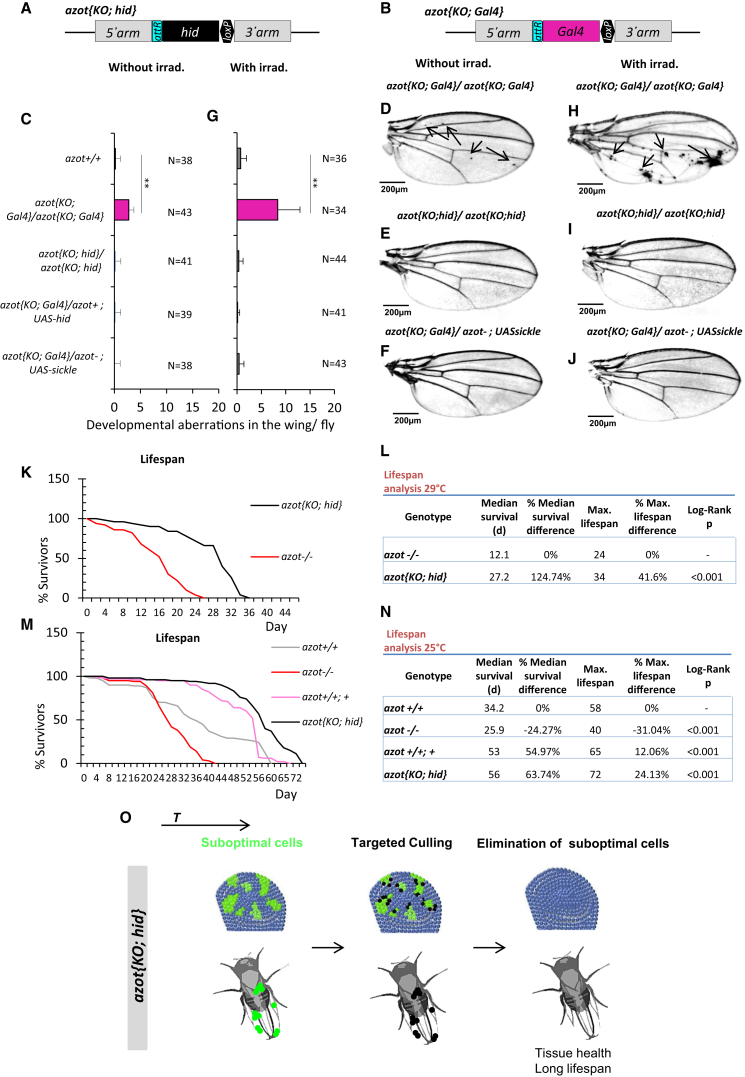
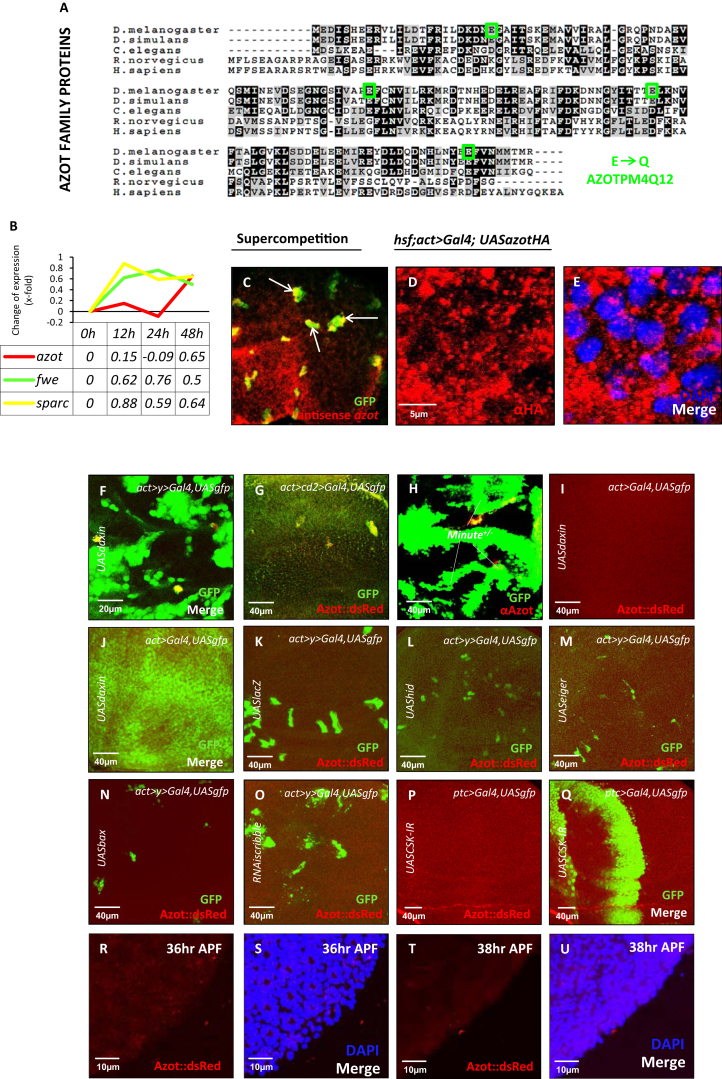
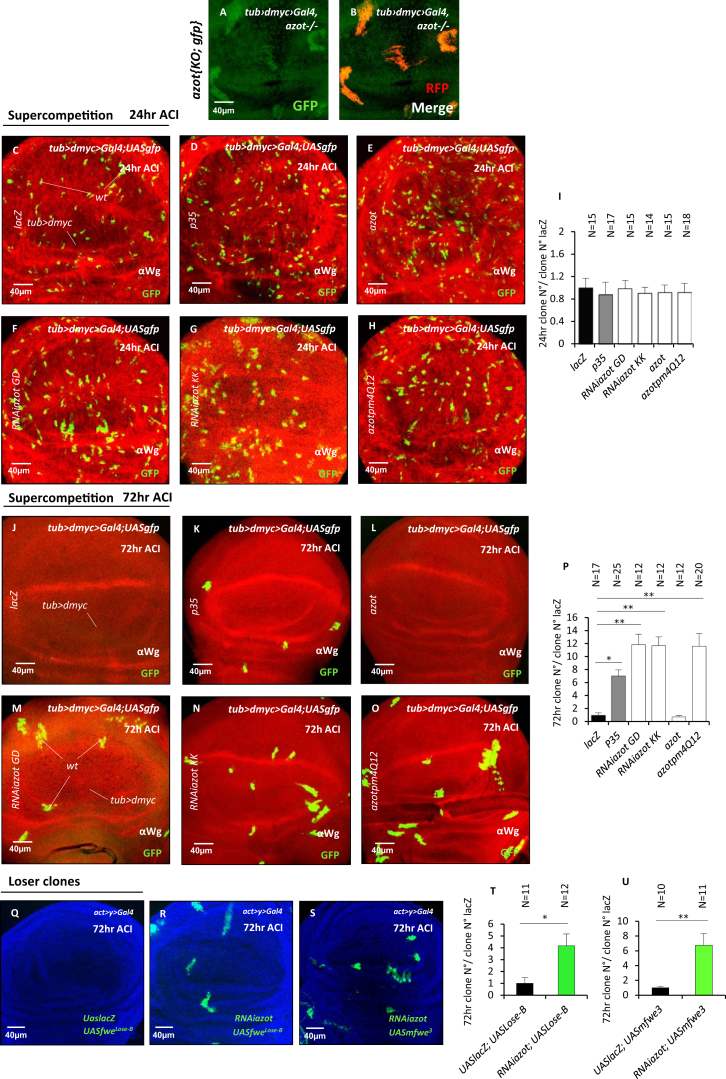
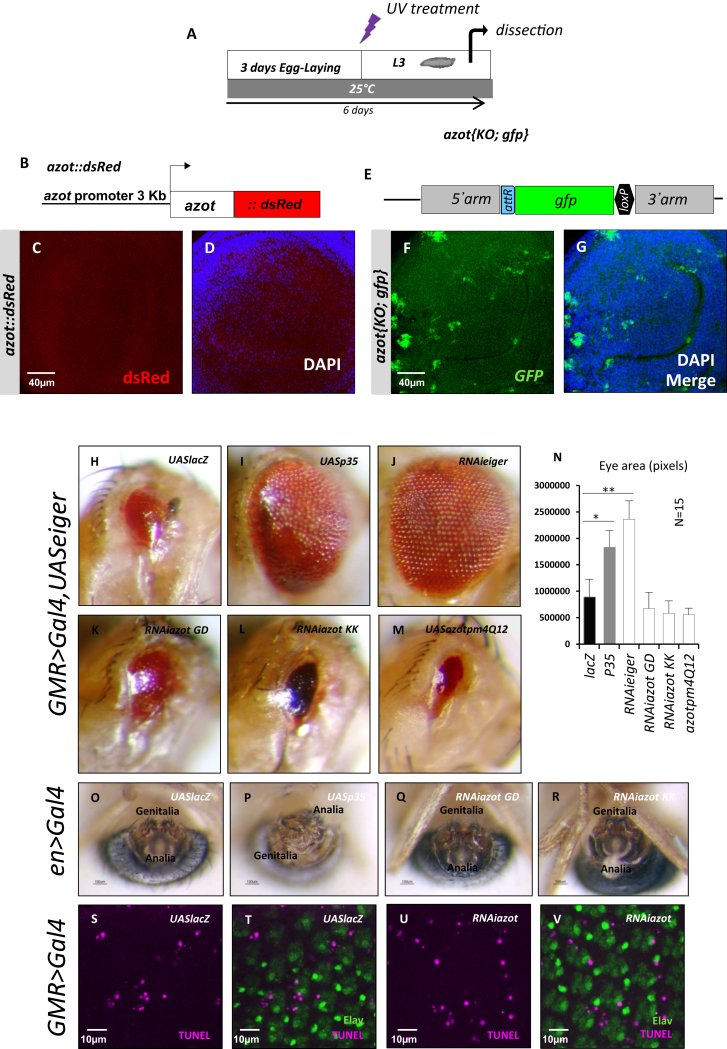
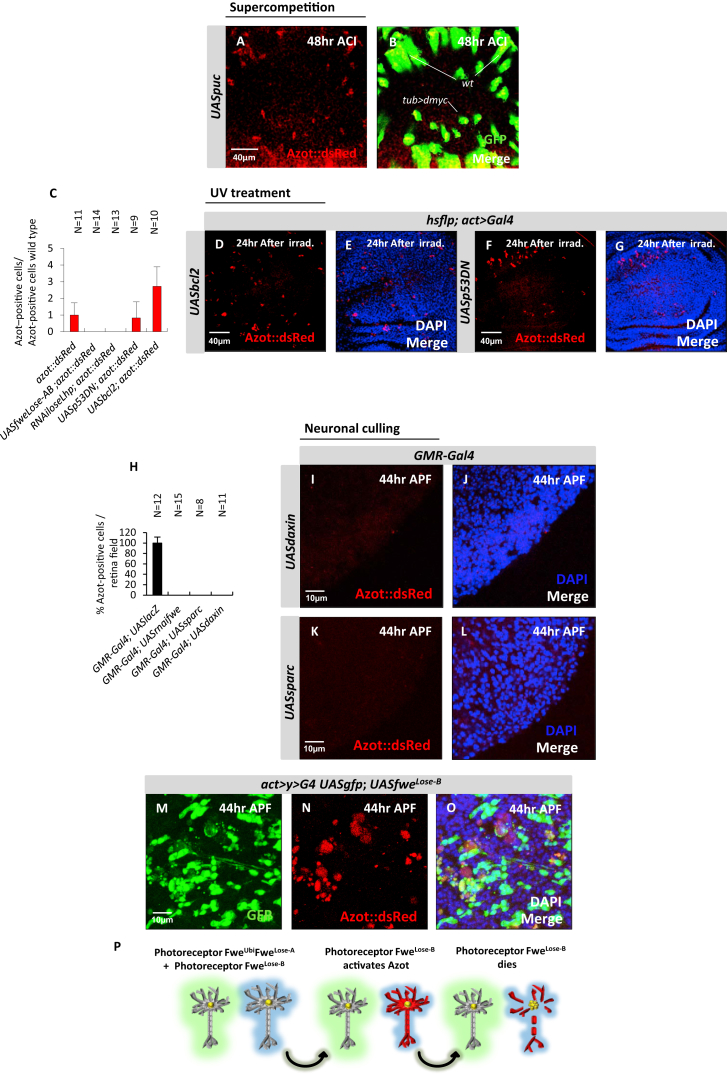
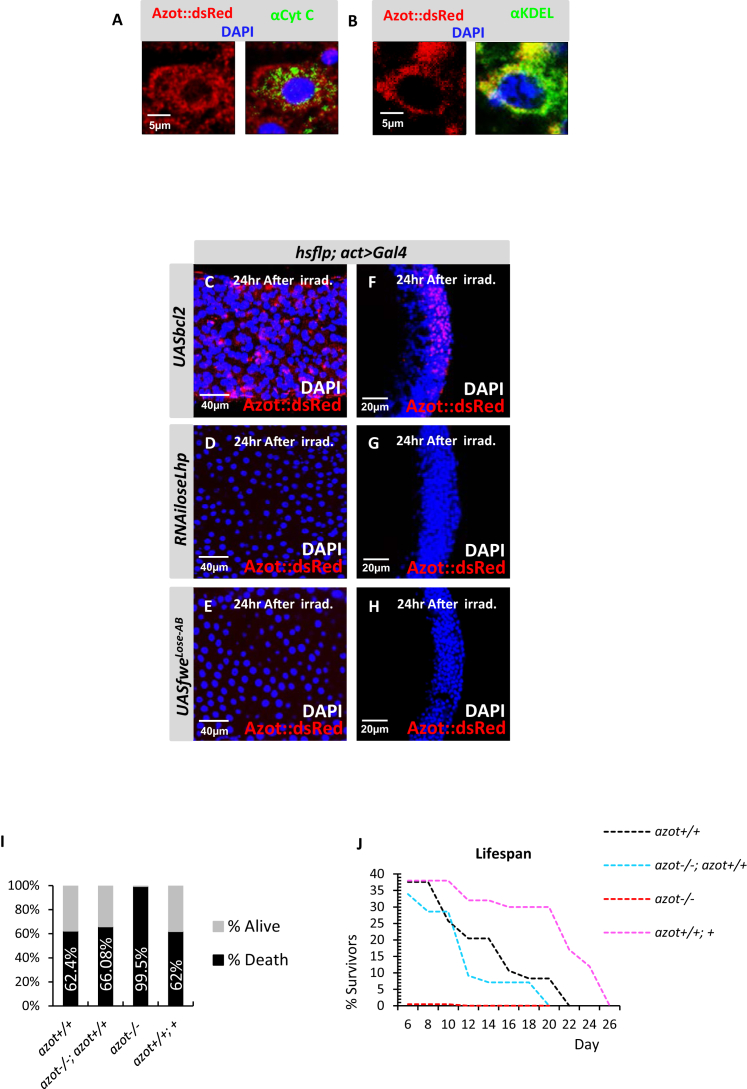
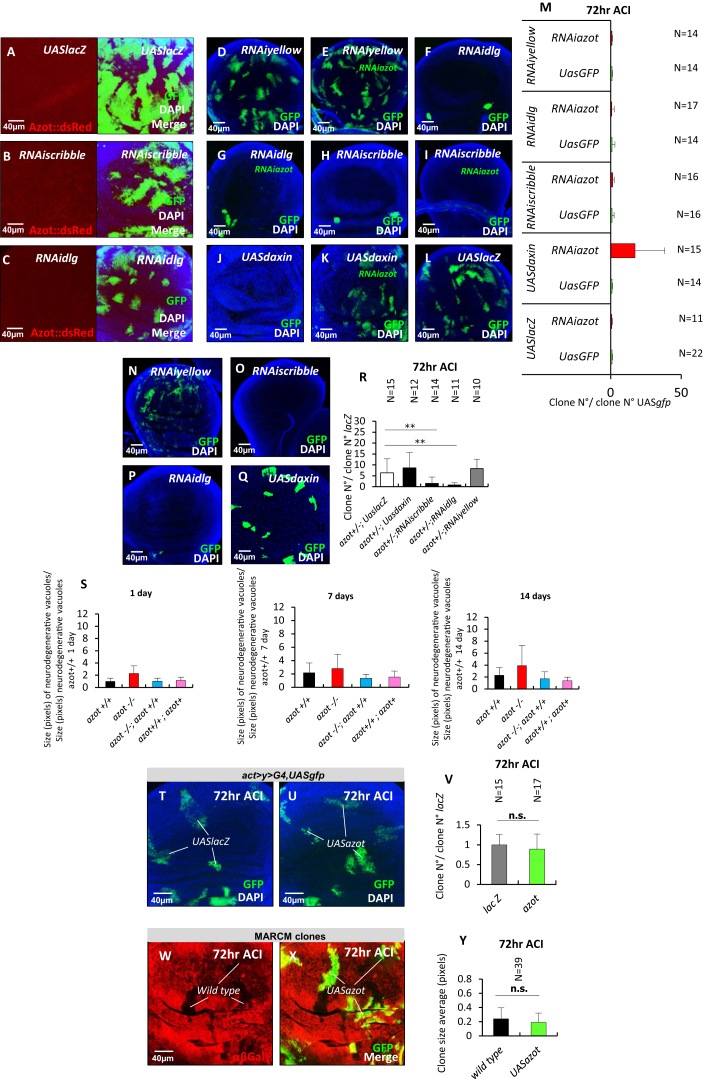
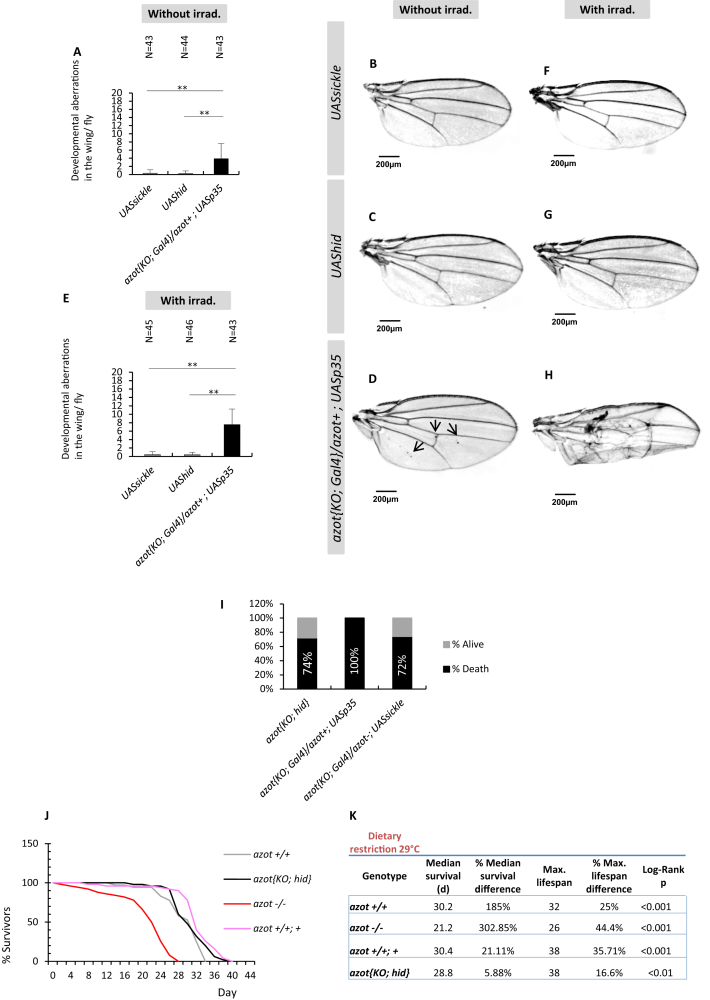
Viable yet damaged cells can accumulate during development and aging. Although eliminating those cells may benefit organ function, identification of this less fit cell population remains challenging. Previously, we identified a molecular mechanism, based on "fitness fingerprints" displayed on cell membranes, which allows direct fitness comparison among cells in Drosophila. Here, we study the physiological consequences of efficient cell selection for the whole organism. We find that fitness-based cell culling is naturally used to maintain tissue health, delay aging, and extend lifespan in Drosophila. We identify a gene, azot, which ensures the elimination of less fit cells. Lack of azot increases morphological malformations and susceptibility to random mutations and accelerates tissue degeneration. On the contrary, improving the efficiency of cell selection is beneficial for tissue health and extends lifespan.


Figures

None
Graphical abstract
Figure 1
Figure 1
Azot Is Expressed during Cell Selection of Viable Unfit Cells (A–M) Expression analysis of Azot during different types of cell competition. For all pictures, Azot::dsRed reporter (A) is in red, and merges show outcompeted clones (green, marked with GFP) of several genotypes. DAPI is in blue. The following genotypes were analyzed: (B and C) azot:dsRed and (D–F) tub>dmyc background (black) and WT cells marked with GFP (green). Clones were generated as shown in (D) and analyzed 48 hr ACI. (G and H) tub>dmyc background (black) and WT cells marked with GFP (green) expressing in addition to the P35 caspase inhibitor (UASp35). Forty-eight hourr ACI. (I–M) Flip-out clones (green) generated as shown in (I) and overexpressing brinker (UASbrinker) (J and K), fweLose-B (UASfweLose-B) (L and M), or mfwe3(UASmfwe3). (Q and R) Twenty-four hour ACI. (N–P, S, and T) General overexpression of UASfweLose-B and UASmfwe3 using the actin promoter as shown in (N). (U–Y) Pupal retinas at different developmental time points. (U and V) Expression analysis of Azot (red), using Azot::dsRed, in peripheral photoreceptors at 40 hr after pupa formation (APF) (U and V). (W) Genomic engineering strategy used for the generation of azot knockout (KO) flies. (X and Y) GFP expression (green) driven by the azot promoter in azot{KO; gfp}, 44 hr APF, DAPI (blue, Y).
Figure 2
Figure 2
Azot Is Required to Eliminate Loser Cells and Unwanted Neurons (A–F) Analysis of azot KO during dmyc-induced supercompetition 72 hr ACI. (D) Quantification of cleaved caspase-3 and GFP-positive cells during dmyc-induced supercompetition in azot+/+ and azot−/− backgrounds (p < 0.01) 72 hr ACI. (E) Quantification of number of clones; the following backgrounds were analyzed: (A and E) azot+/+, (E) azot+/− (p < 0.01), (B and E) azot−/− (p < 0.01), and (C and E) azot−/−;+/+ (p > 0.05). (F) Percentage of the wing pouch occupied by the wt cells in the (A and F) azot+/+, (F) azot+/−, (B and F) azot−/−, (C and F) azot−/−;+/+. (G–L) Role of azot during neuronal culling in the pupal retina. (K and L) Quantification of the number of apoptotic (TUNEL-positive, magenta) or Hid-expressing (red) peripheral photoreceptors, in azot+/+ (G, H, K, and L) and azot−/− (p < 0.01) (I, J, K, and L) flies. DAPI is in blue. (M–Q) Hid expression (red) in loser clones (green) during supercompetition 48 hr ACI in azot+/+ (M, N, and Q) and azot−/− (O–Q) backgrounds. (R–T) Seventy-two hour ACI mfwe3-overexpressing clones (UASmfwe3) in azot+/+ (R and T) and azot+/− (S and T) backgrounds (p < 0.01). (U–W) Analysis of an extra genomic copy of azot during dmyc-induced supercompetition. (U) Quantification of the number of clones during dmyc-induced supercompetition with or without an extra genomic copy of azot. (V and W) Discs analyzed 48 hr ACI in azot+/+ (V) and azot+/+; azot+ (p < 0.01) (W). (X) Azot expression is required for cell-competition-mediated apoptosis of loser cells. Data are represented as mean ± SEM.
Figure 3
Figure 3
Azot Mutants Show Developmental Aberrations (A–E) Wings of 10- to 13-day-old flies and quantification of developmental aberrations in the wing of each genotype, ∗∗ < 0.01. (A and B) azot+/+, (A and C) azot−/−;azot+/+, (A and D) azot−/− and (A and E) azot+/+;azot+. (F–K) Azot and cleaved caspase-3 expression upon UV irradiation (2 × 10−2 J irradiation dose during second instar larvae, treatment as shown in F). (G) Quantification of the percentage of Azot and cleaved caspase-3-expressing cells after UV irradiation. (H) Azot::dsRed expression after UV irradiation (red), (I) cleaved caspase-3 (green) after UV irradiation, (J) merge, and (K) merge with DAPI (blue). (L–P) Quantification of developmental aberrations and images of wings from 10- to 13-day-old flies after UV treatment (2 × 10−2 J, pupae stage 0) of genotypes (L and M) azot+/+, (L and N) azot−/−;azot+/+, (L and O) azot−/−, and (L and P) azot+/+;azot+. (Q) Scheme showing the requirement of azot function for preventing developmental aberrations. Data are represented as mean ± SEM.
Figure 4
Figure 4
The azot Promoter Computes Relative FlowerLose and Sparc Levels (A–F) Epistasis analysis of the following genotypes during dmyc-induced supercompetition. (A and B) UASRNAifweloseLhp, (C and D) UASsparc, and (E and F) UASRNAisparc. Azot::dsRed is shown in red (A, C, and E) and merges with GFP in (B, D, and F). (G) Graph showing the probability of finding Azot expression in a GFP marked clone in several genotypes. (H–J) Azot::dsRed expression after UV irradiation (red) is suppressed when UASRNAifweloseLhp (H and I) or UASfweLose-B and UASfweLose-A (J and K) are expressed ubiquitously. Quantified in Figure S4C. (L and M) Epistasis analysis of Azot expression in the Drosophila retina. Pupal retinas dissected 44 hr APF of GMR-Gal4; RNAifwe (GD). Azot expression shown in red (L) and merge with nuclear marker DAPI in blue (M). Quantified in Figure S4H. (N) Azot is not expressed in cells without FlowerLose isoforms. (O–Q) Cells expressing FlowerLose but that are either surrounded by cells with equal or higher levels of FlowerLose (O) or express high levels of Sparc (P) also do not activate azot expression. Cells with higher relative levels of Lose and not enough Sparc induce the expression of azot and are eliminated (Q).
Figure 5
Figure 5
Expression of Flower Isoforms and Azot in Adult Flies with and without UV Irradiation (A–E) Expression analysis of Azot (red, B and D) in the midgut without (B and C) and with (D and E) UV-irradiation treatment (as shown in A); (C) and (E) show merges with DAPI. (F–J) Expression analysis of Azot using reporter line azot{KO; gfp} in the adult brain without (G and H) and after (I and J) UV-irradiation treatment merges with DAPI in (H and J). (K–T) Expression analysis of Flower Lose isoforms Lose A (green) and Lose B (red) (flower Lose-A-GFP, flower Lose-B-RFP). (K and M) In the midgut without (K and L) and with (M and N) UV-irradiation treatment. (L and N) merges with DAPI. Inset in (M) shows FweLose-A and FweLose-B expression at higher magnification. (O–T) Expression of Flower Lose isoforms in the adult brain without (O–Q) and after (R–T) UV irradiation, merges with DAPI in (Q and T).
Figure 6
Figure 6
azot Is Required to Prevent Tissue Degeneration in the Adult Brain and to Promote Lifespan (A–P) Brain integrity studies over time. (A) Axial plane of Drosophila WT brain counterstained with toluidine blue. (B–M) Magnification images of the central brain, counterstained with toluidine blue, showing degenerative vacuoles (white dots) of the following four genotypes over time: (1) azot+/+, (2) azot−/−, (3) azot−/−; azot+/+, and (4) azot+/+; azot+. (N–P) Number of neurodegenerative vacuoles. (N) Number of degenerative vacuoles per brain area (70 × 70 μm) after 1 day at 29°C (azot+/+ n = 14, azot−/− [p < 0.01] n = 8, azot−/−;azot+/+ n = 16 and azot+/+; azot+ [p < 0.01] n = 11). (O) Number of degenerative vacuoles per brain area after 7 days at 29°C (azot+/+ n = 16, azot−/− [p < 0.01] n = 16, azot−/−;azot+/+ n = 7 and azot+/+; azot+ [p < 0.01] n = 20). (P) Number of degenerative vacuoles per brain area after 14 days at 29°C (azot+/+ n = 7, azot−/− [p < 0.01] n = 3, azot−/−;azot+/+ n = 10 and azot+/+; azot+ n = 7). (Q–V) Azot-positive cells (green, GFP) in azot{KO; gfp} homozygous flies after 1 day (Q and R), 7 days (S and T), and 14 days (U and V) at 29°C. DAPI is in blue. (W) Number of Azot-positive cells per brain area (50 × 50 μm) in azot{KO; gfp} homozygous flies after 1 day (n = 11), 7 days (n = 15), and 14 days (n = 18) at 29°C. (X) Lifespan studies of the same four genotypes at 29°C. (Y) Lifespan values, including median survival and maximum lifespan, for the four genotypes. Data are represented as mean ± SEM.
Figure 7
Figure 7
Culling Azot-Expressing Cells Is Sufficient and Required for Multicellular Fitness Maintenance (A and B) Knockin (KI) schemes (A) azot{KO; Gal4} and (B) azot{KO;hid}. (C–F) Wings from 10- to 13-day-old flies and quantification of developmental aberrations of the following five genotypes: (C) azot+/+, (C and D) azot{KO; Gal4}/azot{KO; Gal4}, (C and E) azot{KO;hid}/azot{KO;hid}, (C and F) azot{KO; Gal4}/azot;UASsickle, and (C) azot{KO; Gal4}/azot+;UAShid. (G–J) Wings from 10- to 13-day-old flies and quantification of developmental aberrations after UV irradiation of the same five genotypes. Irradiation dose of 2 × 10−2 J administered during pupal stage 0. (K and L) Comparative lifespan studies of genotypes azot{KO;hid}/azot{KO;hid} and azot−/− at 29°C. (L) Median and maximum survival of genotypes azot{KO;hid}/azot{KO;hid} and azot−/−. (M and N) Lifespan studies at 25°C of the following four genotypes: (1) azot+/+, (2) azot−/−, (3) azot+/+; azot+, and (4) azot{KO;hid}/azot{KO;hid}. (N) Median and maximum survival of the four genotypes. (O) Scheme showing that specifically killing Azot-expressing cells with the general proapoptotic factor Hid is sufficient to prevent morphological malformations and rescue azot mutant phenotypes. Data are represented as mean ± SEM.
Figure S1
Figure S1
Azot Is Conserved throughout Evolution and Is Expressed in a Subset of Loser Cells in Cell Competition Scenarios, Related to Figure 1 (A) Alignment of Azot showing conservation in multicellular animals including humans. Point mutations highlighted for the generation of the pm4Q12 Azot mutant. (B) Expression profile of different genes induced upon Supercompetition based on microarray data published in Rhiner et al., 2010. (C) In situ analysis of azot RNA in dmyc-induced supercompetition, azot RNA probe (red), WT clones (green). Arrows show cells expressing azot RNA. (D and E) HA-tagged Azot protein overexpressed in wing imaginal disc cells with act-Gal4 driver is mainly cytoplasmic, anti-HA in red (D) and merged with DAPI (E). (F–U) Expression analysis of Azot. Flip-out overexpressing clones of UASdaxin (Azot::dsRed, red) (F) and RNAihopscotch (Azot::dsRed, red) (G). (H) Minute heterozygous clones anti-Azot antibody (red). (I and J) Wing imaginal discs ubiquitously expressing Daxin and GFP (act < Gal4; UASdaxin; UASgfp), (I) Azot::dsRed and merged with GFP (J). (K–O) Flip-out clones marked with GFP and overexpressing: (K) UASlacZ, (L) UAShid, (M) UASeiger, (N) UASbax, and (O) RNAiscribble. Azot expression revealed with Azot::dsRed from (K)–(O). (P and Q) patched-Gal4; UASgfp; UASCSK-IR, (red, Azot::dsRed). (R–U) Images of pupal retinas at different developmental time points. Expression analysis of Azot (red), using Azot::dsRed, in peripheral photoreceptors at different time points: 36hr after pupa formation (APF) (R and S) and 38hr APF (T and U).
Figure S2
Figure S2
Azot Downregulation in Loser Cells during Cell Competition, Related to Figure 2 (A and B) tub>dmyc background (black) and WT cells marked with RFP (red) in azot{KO; gfp} homozygous background 72hr ACI. (C–I) Images of wing imaginal discs 24hr ACI in dmyc-induced supercompetition of the following genotypes (C) UASlacZ, (D) UASp35, (E) UASazot, (F) RNAiazot GD, (G) RNAiazot KK, (H) UASazotpm4Q12 (red, anti-Wingless), and quantification of number of clones at 24hr ACI (I). (J–P) Quantification and images of WT clones in supercompetition of the following genotypes 72hr after ACI (anti-Wingless, red): (J) UASlacZ, (K) UASp35 (p < 0.05), (L) UASazot, (M) RNAiazot GD (p < 0.01), (N) RNAiazot KK (p < 0.01), and (O) UASazotpm4Q12 (p < 0.01) (red, anti-Wingless). (Q–U) Flower Lose overexpressing clones (Q and T) UASfweLose-B; UASlacZ, (R and T) UASfweLose-B; RNAiazot (p < 0.05), (S and U) UASmfwe3; RNAiazot (p < 0.01). RNAiazot GD line was used. Data are represented as mean ± SEM.
Figure S3
Figure S3
Azot Is Required to Eliminate a Subset of Cells after Irradiation but Is Not a General Proapoptotic Factor, Related to Figure 3 (A–G) Azot positive cells detected in wing imaginal discs after UV-treatment (2x10⁻²J, 3 days after egg laying as shown in A). (B–D) Azot::dsRed functional reporter (B). Expression in the wing imaginal disc is shown in red (C) and merge with DAPI (blue, D). (E–G) azot{KO; gfp} reporter in homozygosis (E). Expression in the wing imaginal disc is shown in green (F) and merge with DAPI (blue, G). (H–N) Images of Drosophila eyes and quantification of eye area (pixels), inducing apoptosis with GMR-Gal4, UASeiger in the following genotypes: (H) UASlacZ, (I) UASp35, (J) RNAieiger, (K) RNAiazot GD, (L) RNAiazot KK, (M) UASazotpm4Q12 and quantification, (N) ( < 0.05 and ∗∗ < 0.01). (O–R) Genitalia rotation assay, using engrailed>Gal4 driver with the following genotypes: (O) UASlacZ, (P) UASp35, (Q) RNAiazot GD, (R) RNAiazot KK. (S–V) images of Drosophila retina 24hr APF stained for TUNEL (magenta, S and U) and pan-neuronal marker Elav (green, T and V) of the following genotypes: (S and T) GMR-Gal4; UASlacZ and (U and V) GMR-Gal4; RNAiazot. Data are represented as mean ± SEM.
Figure S4
Figure S4
Regulation and Function of Azot, Related to Figure 4 (A and B) Epistasis analysis UASpuc during dmyc induced supercompetition Azot::dsRed is shown in red (A) and merges with GFP in (B). (C–G) Azot::dsRed expression after UV-irradiation (red) is not suppressed when UASbcl2 and UASp53DN are overexpressed ubiquitously with actin-Gal4. DAPI in blue. (H–O) Quantification and epistasis analysis of azot in the retina. (H) Graph showing the probability of Azot expression in each genotype. (I–L) Images of Drosophila retinas 44hr APF of the following genotypes: (I and J) GMR-Gal4; UASdaxin and (K and L) GMR-Gal4; UASsparc. Azot expression is shown in red (I and K) and merges with DAPI are shown in (J and L). (M–O) hsflp; act > y+STOP > Gal4, UASgfp;UASfweLose-B. GFP clones (green, M), Azot::dsRed (red, N) and merge with DAPI nuclear marker in (O). (P) Scheme representing Azot-mediated elimination of peripheral photoreceptors. Data are represented as mean ± SEM.
Figure S5
Figure S5
Expression and Function of Azot after UV Irradiation, Related to Figure 5 (A and B) Subcellular localization of Azot (red, Azot::dsRed) in enterocytes after irradiation co-stained with mitochondrial marker Cytochrome c (green, A) and ER marker KDEL (green, B). DAPI in blue. Azot does not co-localize with mitochondrial marker and partially co-localize with ER marker. (C–H) Expression analyses of Azot (red, Azot::dsRed) after irradiation (2x10⁻²J, 1-3 days old) in the midgut (C-E) and in the adult brain (F–H) using actin-Gal4 to overexpress the following factors: (C and F) Bcl2 (UASbcl2), (D–G) RNAi against flower lose isoforms (UASRNAiloseLhp) and (E–H) Flower LoseA and LoseB isoforms (UASfweLose-A, UASfweLose-B). Merges with DAPI (blue) and Azot (red). (I) Percentage of adult survival 6 days post-irradiation (5x10⁻²J, 1-3 days old) of the following 4 genotypes: 1) azot+/+, 2) azot−/−; azot+/+, 3) azot−/−, 4) azot+/+; azot+. (J) Lifespan studies at 29°C 6 days after the same UV-irradiation treatment of the previous 4 genotypes.
Figure S6
Figure S6
Expression and Functional Analysis of azot in Cell Clones with Defects in Apicobasal Polarity, Vacuole Size, and Clone Analysis for azot Overexpression, Related to Figure 6 All images are wing imaginal discs dissected in third instar larvae. (A–C) Expression analysis of Azot (48hr ACI) of the following genotypes: hsflp; act > y+STOP > Gal4,UASgfp; UASlacZ (A), hsflp; act > y+STOP > Gal4,UASgfp; RNAiscribble (B) and hsflp; act > y+STOP > Gal4,UASgfp; RNAidlg (C). Azot expression is shown in red, GFP clones in green. (D–M) RNAi-mediated silencing of azot in clones with defects in apico-basal polarity and clones deficient for Wg signaling. Quantification and images of GFP marked clones from the following genotypes: (D and M) hsflp; act > y+STOP > Gal4; RNAiyellow (E and M) hsflp; act > y+STOP > Gal4; RNAi azot; RNAiyellow, (F and M) hsflp; act > y+STOP > Gal4; RNAidlg, (G and M) hsflp; act > y+STOP > Gal4; RNAiazot; RNAidlg, (H and M) hsflp; act > y+STOP > Gal4; RNAiscribble, (I and M) hsflp; act > y+STOP > Gal4; RNAiazot; RNAiscribble, (J and M) hsflp; act > y+STOP > Gal4; UASdaxin, (K and M) hsflp; act > y+STOP > Gal4;RNAiazot; UASdaxin (p < 0.01) and (L and M) hsflp; act > y+STOP > Gal4; UASlacZ. All clones analyzed 72hr ACI. (N–R) Survival analysis of clones with defects in apico-basal polarity and clones deficient for Wg signaling in azot mutant heterozygote background. Number of GFP marked clones 72hr ACI of the following genotypes: (N,R) hsflp; act > y+STOP > Gal4,UASgfp,azot-; RNAiyellow, (O,R) hsflp; act > y+STOP > Gal4,UASgfp,azot-; RNAiscribble (p < 0.01), (P,R) hsflp; act > y+STOP > Gal4,UASgfp,azot-; RNAidlg (p < 0.01) and (Q and R) hsflp; act > y+STOP > Gal4,UASgfp,azot-; UASdaxin. (S) Vacuole size over time of the following 4 genotypes: 1) azot+/+, 2) azot−/−, 3) azot−/−; azot+/+, and 4) azot+/+; azot+. Size of degenerative vacuoles (pixels) after 1 day at 29°C (azot+/+ n = 29, azot−/− N = 31, azot−/−;azot+/+ N = 23 and azot+/+; azot+ N = 21). Size (pixels) of degenerative vacuoles per brain area after 7 days at 29°C (azot+/+ N = 32, azot−/− N = 23, azot−/−;azot+/+ N = 16 and azot+/+; azot+ N = 39). Size (pixels) of degenerative vacuoles per brain area after 14 days at 29°C (azot+/+ N = 34, azot−/− N = 34, azot−/−;azot+/+ N = 22 and azot+/+; azot+ N = 31). (T–V) Images of wing imaginal discs dissected in third instar larvae and quantification of GFP marked clones. (T, U) Wing discs of the following genotypes: hsflp; act > y+STOP > Gal4, UASgfp;UASlacZ (T) and hsflp; act > y+STOP > Gal4, UASgfp;UASazot (U) 72hr ACI. Clones shown in green (GPF) and nuclear marker DAPI in blue. (V) Graph showing the quantification of the number of clones 72hr ACI. No significant differences were found (student’s t test, p > 0.05). (W–Y) Images of wing imaginal discs dissected in third instar larvae and quantification of clone size using the MARCM technique. (W and X) Wing discs 72hr ACI. Size of the clones shown in green (GPF) overexpressing UASazot were compared to MARCM twin clones (black), anti-βGal (red, W) and merge with GFP (X). (Y) Graph showing the quantification of the size of clones 72hr ACI. No significant differences were found (student’s t test, p > 0.05). Data are represented as mean ± SEM.
Figure S7
Figure S7
Developmental Aberrations when Inhibiting Apoptosis of Azot-Positive Cells, Related to Figure 7 (A–D) Quantification and Drosophila wing images of developmental aberrations, before irradiation treatment of the following genotypes: (B) UASsickle, (C) UAShid and (D) azot{KO; Gal4}/azot+;UASp35. (E–H) Quantification and Drosophila wing images of developmental aberrations, after UV-irradiation of the following genotypes: (F) UASsickle, (G) UAShid and (H) azot{KO; Gal4}/azot+;UASp35. Irradiation dose of 2x10⁻²J administered during pupal stage 0. All wings belong to 10-13 days old flies. (I) Percentage of adult survival 6 days post-irradiation (5x10⁻²J, 1-3 days old) of the following 3 genotypes: 1) azot{KO;hid}/azot{KO;hid}, 2) azot{KO; Gal4}/azot+; UASp35 and 3) azot{KO; Gal4}/azot-; UASsickle. (J and K) Dietary restriction lifespan studies at 29°C of the following 4 genotypes over time: 1) azot+/+, 2) azot−/−, 3) azot+/+; azot+ and 4) azot{KO;hid}/ azot{KO;hid}. (K) Median and maximum survival of the four genotypes. Data are represented as mean ± SEM.

References

    1. Baillon L., Basler K. Reflections on cell competition. Semin. Cell Dev. Biol. 2014;32:137–144. - PubMed
    1. Brodsky M.H., Nordstrom W., Tsang G., Kwan E., Rubin G.M., Abrams J.M. Drosophila p53 binds a damage response element at the reaper locus. Cell. 2000;101:103–113. - PubMed
    1. de Beco S., Ziosi M., Johnston L.A. New frontiers in cell competition. Developmental dynamics. 2012;241:831–841. - PMC - PubMed
    1. de la Cova C., Abril M., Bellosta P., Gallant P., Johnston L.A. Drosophila myc regulates organ size by inducing cell competition. Cell. 2004;117:107–116. - PubMed
    1. Fernández-Hernández I., Rhiner C., Moreno E. Adult neurogenesis in Drosophila. Cell Rep. 2013;3:1857–1865. - PubMed

Publication types