. 2015 Feb 9;212(2):267-80.
doi: 10.1084/jem.20140508. Epub 2015 Jan 19.

Moesin and myosin phosphatase confine neutrophil orientation in a chemotactic gradient

Affiliations

Moesin and myosin phosphatase confine neutrophil orientation in a chemotactic gradient

Xiaowen Liu et al. J Exp Med. .

Abstract

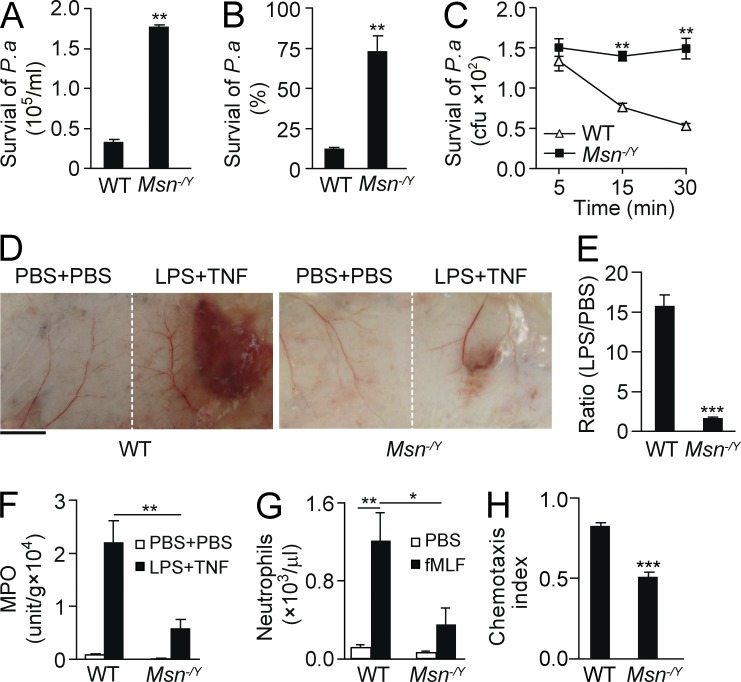
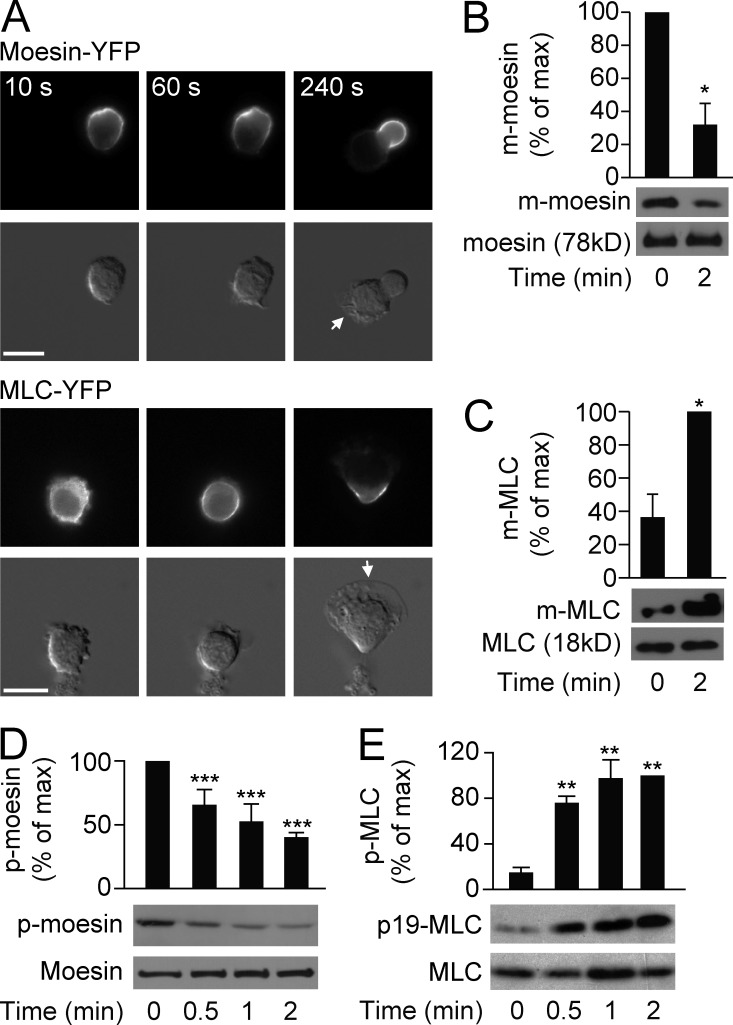
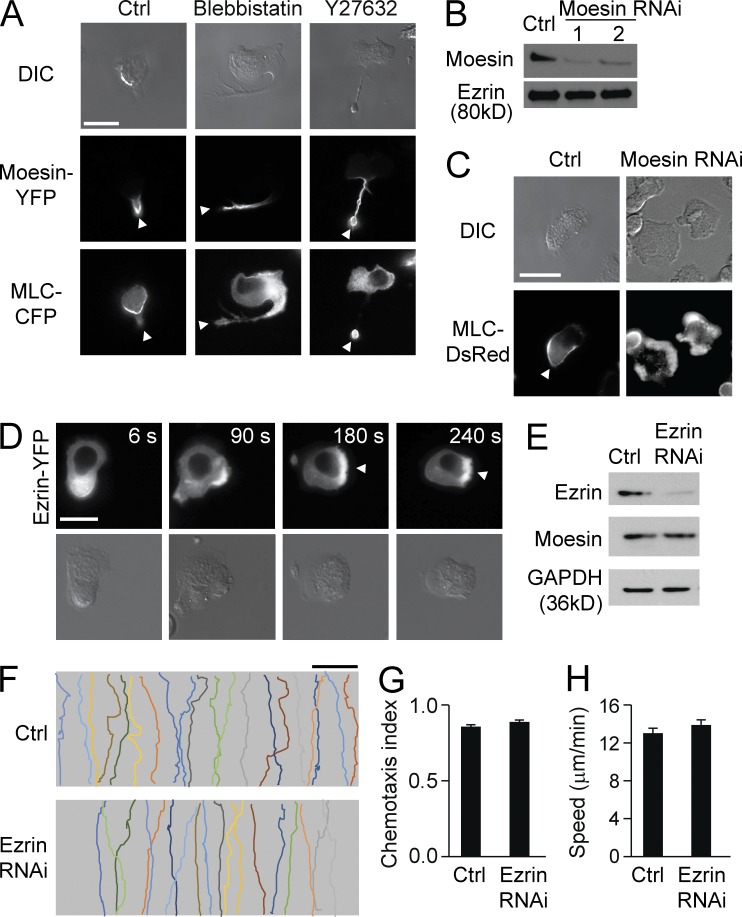
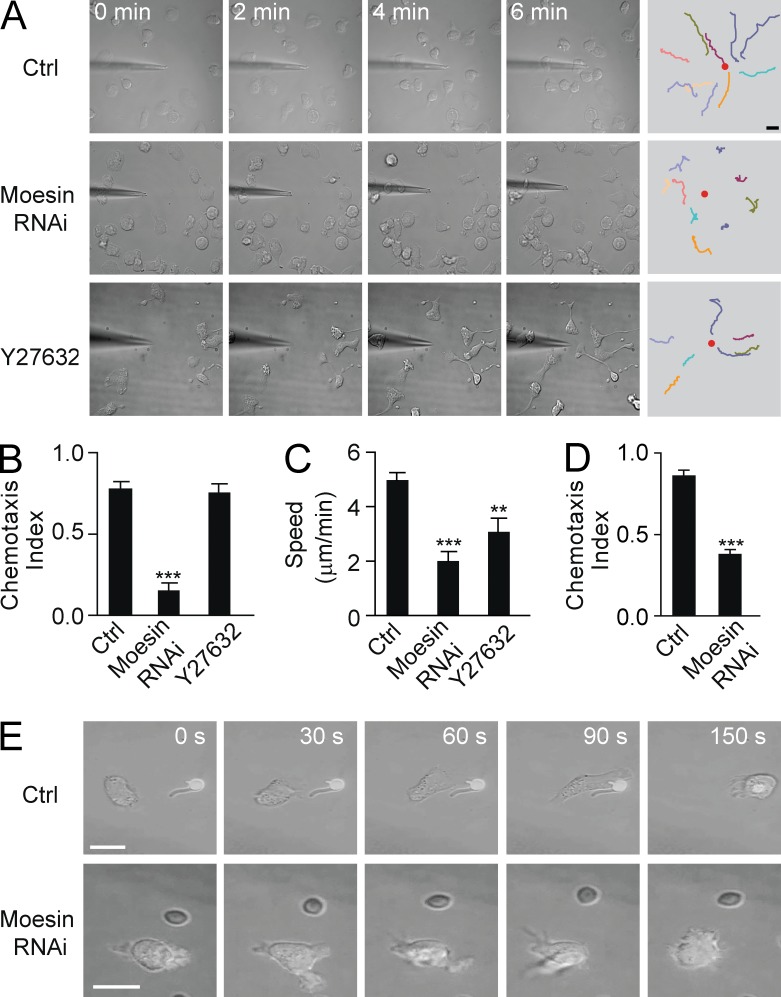
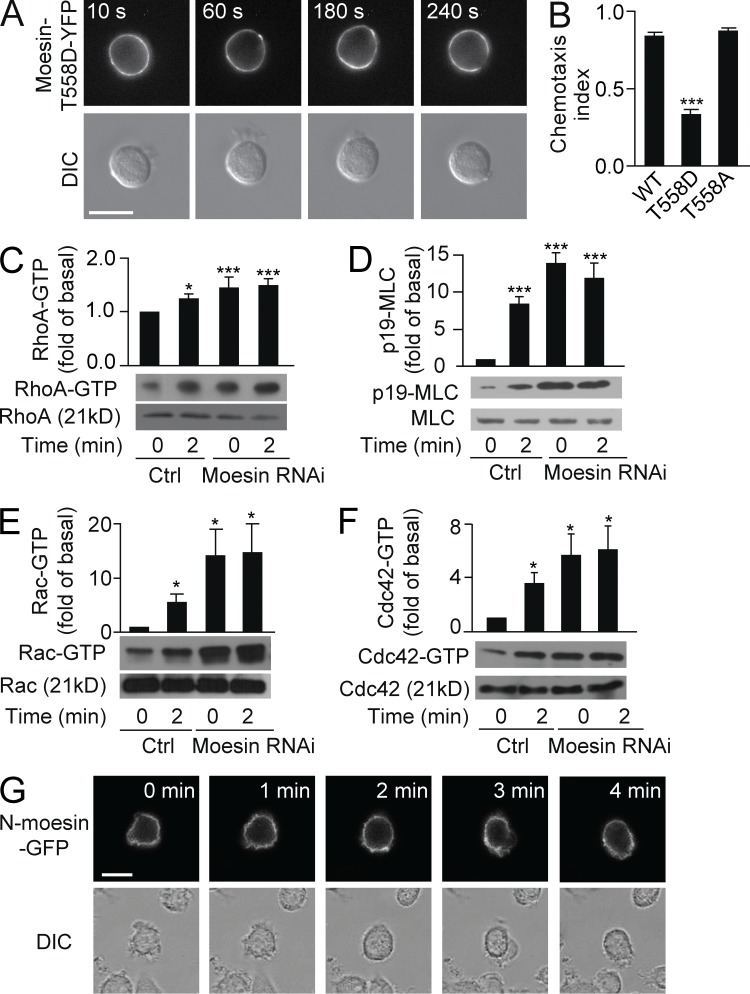
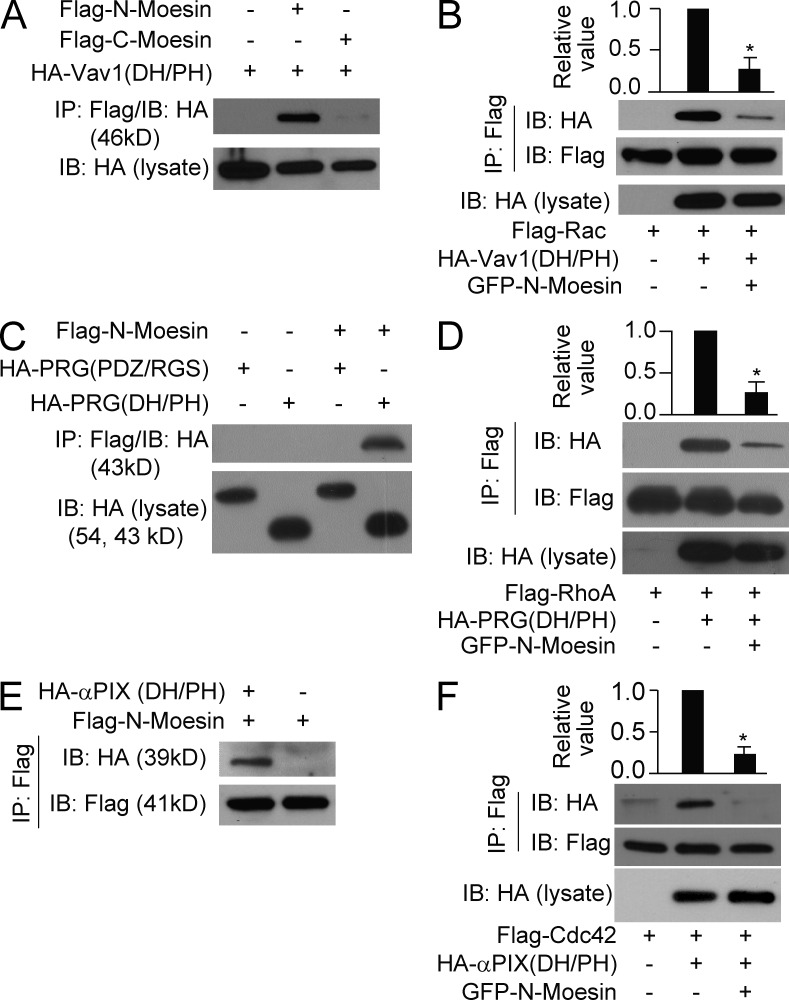
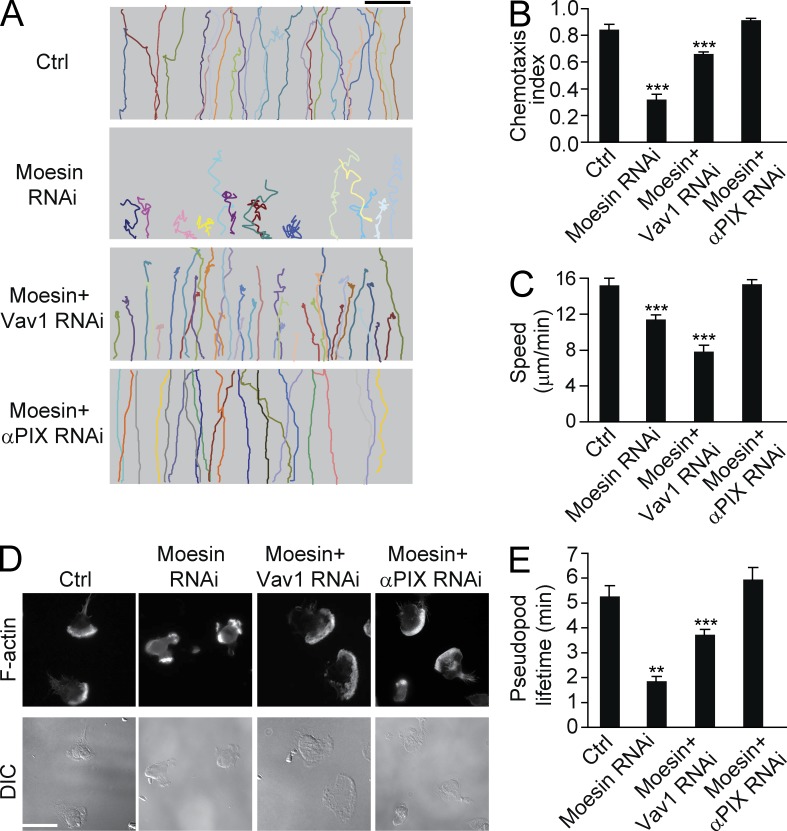
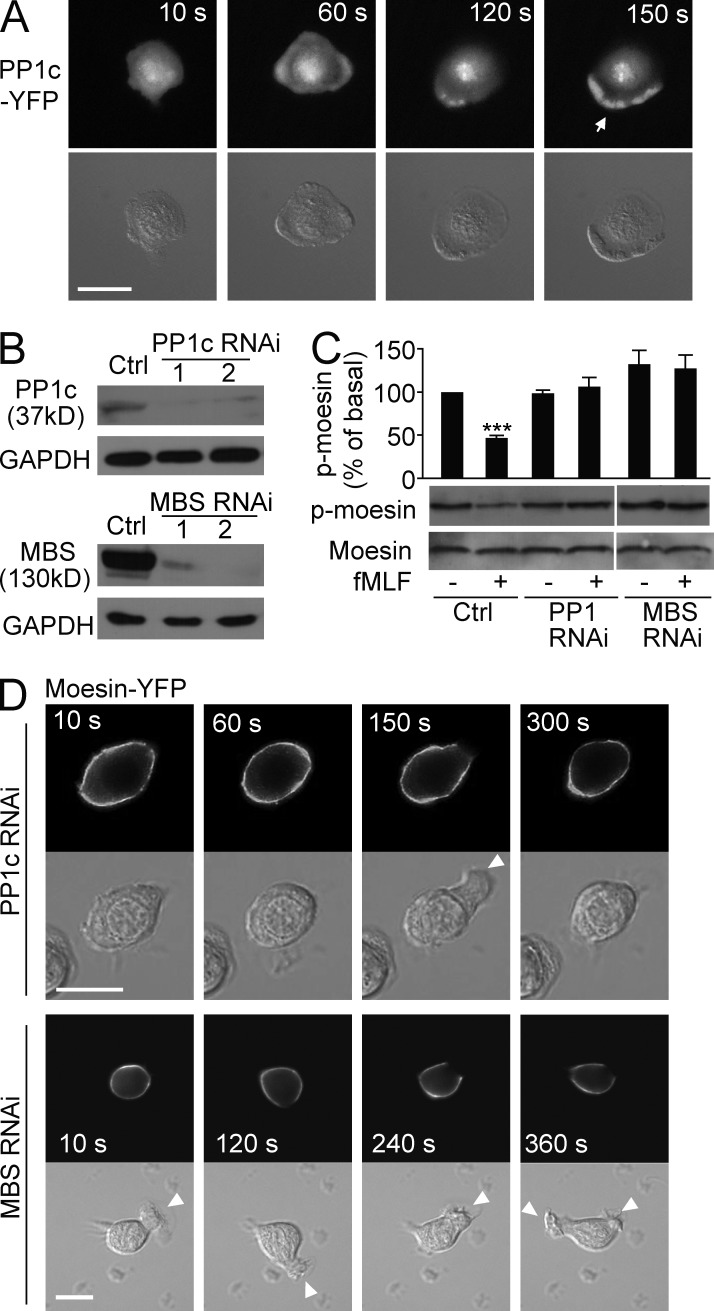
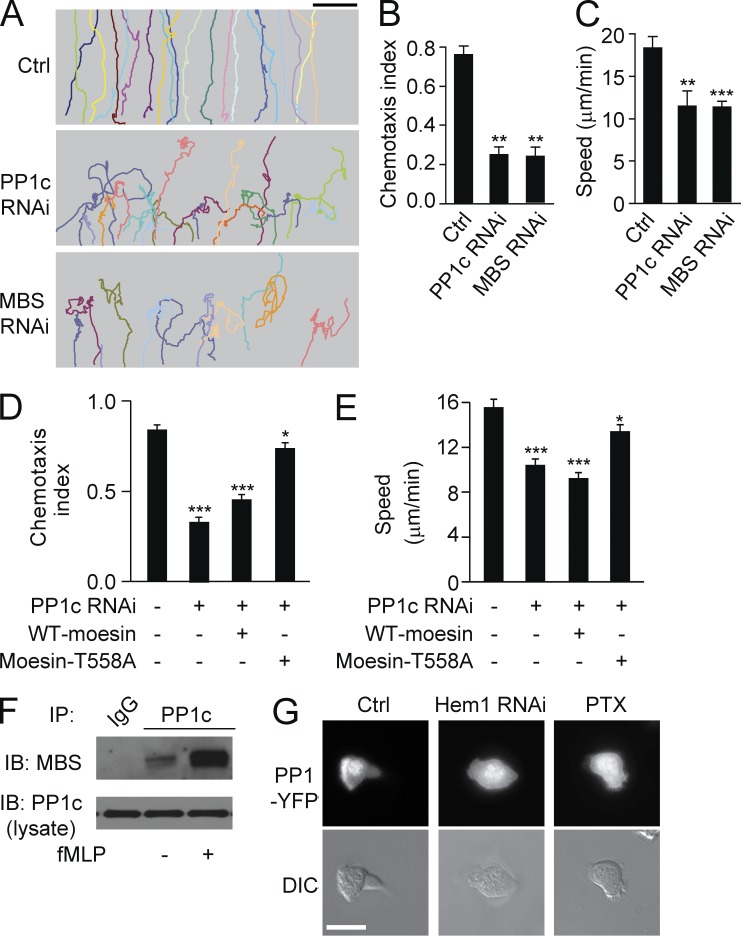
Neutrophils respond to invading bacteria by adopting a polarized morphology, migrating in the correct direction, and engulfing the bacteria. How neutrophils establish and precisely orient this polarity toward pathogens remains unclear. Here we report that in resting neutrophils, the ERM (ezrin, radixin, and moesin) protein moesin in its active form (phosphorylated and membrane bound) prevented cell polarization by inhibiting the small GTPases Rac, Rho, and Cdc42. Attractant-induced activation of myosin phosphatase deactivated moesin at the prospective leading edge to break symmetry and establish polarity. Subsequent translocation of moesin to the trailing edge confined the formation of a prominent pseudopod directed toward pathogens and prevented secondary pseudopod formation in other directions. Therefore, both moesin-mediated inhibition and its localized deactivation by myosin phosphatase are essential for neutrophil polarization and effective neutrophil tracking of pathogens.


Figures

Figure 1.
Figure 1.
Moesin regulates neutrophil microbial killing and inflammation. (A and B) WT and moesin knockout (Msn−/Y) mice were i.t. injected with P. aeruginosa (2 × 10⁵). 8 h later, lungs were isolated, and the number (A) and percentage (B) of surviving colonies derived from lysates were determined. (C) WT and Msn−/Y neutrophils were incubated with opsonized P. aeruginosa for the indicated times, and surviving colonies were determined. (A–C) **, P < 0.01 compared with WT (Student’s t test). (D–F) Microvascular injury was induced in a classical LSR by consecutive injections of 80 µg LPS and then 0.2 µg TNF or PBS as controls. (D) Macroscopic appearance of dorsal skin in WT and Msn−/Y mice after LSR. Bar, 5 mm. (E) The degree of hemorrhage in the WT and Msn−/Y mice in D was estimated based on densitometry analysis of skin samples receiving either LPS or PBS injection. Results are shown as the ratio of the value with LPS versus the value with PBS. ***, P < 0.001 (Student’s t test). (F) Tissue MPO activities in skins were measured and normalized by tissue weight. Data are presented as V-Max value/g tissue. **, P < 0.01 (Student’s t test). (G) WT or Msn−/Y mice were i.p. injected with 10 nM fMLF, and neutrophil emigration into the peritoneal cavity was assessed after 4 h. For all groups, n = 3–4 mice. *, P < 0.05; **, P < 0.01 (Student’s t test). (H) WT and Msn−/Y neutrophils were exposed to a 10-nM fMIFL gradient, and CI was calculated by the ratio of net migration in the correct direction to the total migration length. ***, P < 0.001 compared with WT (Student’s t test). Data are representative of (D) or are compiled from (A–C and E–H) three independent experiments (mean and SEM in A–C and E–H).
Figure 2.
Figure 2.
Differential activation of moesin and MLC. (A) HL60 cells (n > 30 per group) expressing moesin-YFP or MLC-YFP were stimulated for the indicated times with 100 nM fMLF and visualized by fluorescence (top rows) and differential interference contrast (DIC) microscopy (bottom rows). Arrows indicate leading edges. Bars, 10 µm. (B and C) HL60 cells were left untreated or were stimulated with 100 nM fMLF, and quantification of membrane-bound (m-) moesin (B) or m-MLC (C) was evaluated by immunoblot. Levels were quantitated and presented relative to the maximum value. *, P < 0.05 compared with the value at basal (Student’s t test). (D and E) HL60 cells were stimulated for the indicated times with 100 nM fMLF, and phosphorylated (p-) moesin (D) or p-MLC (E) versus total protein levels were assessed by immunoblot. Graph shows quantification of p-moesin and p-MLC, presented relative to maximum activation of p-moesin at 0 min or p-MLC at 2 min. **, P < 0.01; ***, P < 0.001 compared with the value at 0 min (Student’s t test). Data are representative of (A and blots in B–E) or are compiled from three independent experiments (graphs in B–E; mean and SEM in B–E).
Figure 3.
Figure 3.
Moesin regulates MLC localization. (A) HL60 cells expressing both moesin-YFP and MLC-CFP were left untreated (left) or were treated with blebbistatin (middle) or Y27632 (right) in the presence of 100 nM fMLF for 2 min. Cells were visualized by DIC (top) and fluorescence microscopy (middle and bottom). (B) Expression of moesin in control cells and moesin RNAi–treated cells was analyzed by immunoblot. Two moesin RNAi–treated cell lines are shown. Ezrin was used as a loading control. (C) Control and moesin RNAi–treated cells expressing MLC-DsRed were stimulated with 100 nM fMLF for 2 min, and cells were visualized by DIC (top) and fluorescence microscopy (bottom). (A and C) Arrowheads indicate the trailing edges. (D) Cells expressing ezrin-YFP were stimulated with 100 nM fMLF and imaged by fluorescence (top) and DIC microscopy (bottom) at the indicated times. Arrowheads point to the leading edges. (E) Expression of ezrin was assessed in control and ezrin RNAi–treated cells by immunoblot. Moesin and GAPDH were used as loading controls. (F) HL60 cells were left untreated (Ctrl) or were treated with ezrin RNAi in an fMLF gradient of 100 nM (>30 cells per condition). Each trace represents the trajectory of one cell. Bars: (A, C, and D) 10 µm; (F) 100 µm. (G and H) Cells were treated as in F, and CI (G) and migration speed (H) were calculated. Data are representative of (A–F) or are compiled from three independent experiments (G and H; mean and SEM in G and H).
Figure 4.
Figure 4.
Moesin, and not MLC, is essential for cell orientation. (A) Control HL60 cells (Ctrl; top), moesin RNAi–treated cells (middle), or Y27632-treated cells (bottom) migrated toward a point source of 10 µM fMLF. (B and C) Cells were treated as in A, and CI (B) and migration speed (C) were calculated. **, P < 0.01; ***, P < 0.001 compared with control (Student’s t test). (D) Control and moesin RNAi cells were exposed to a 10-nM IL-8 gradient, and CI was calculated. ***, P < 0.01 (Student’s t test). (E) Control (top) and moesin RNAi–treated (bottom) cells (n > 30 per group) were exposed to C. albicans. (A and E) Bars, 10 µm. Data are representative of (A and E) or are compiled from three independent experiments (B–D; mean and SEM in B–D).
Figure 5.
Figure 5.
Moesin inhibits Rho, Rac, and Cdc42 activity. (A) HL60 cells (n > 30) expressing moesin-T558D-YFP were stimulated for the indicated times with 100 nM fMLF and visualized by fluorescence (top) and DIC microscopy (bottom). (B) HL60 cells expressing WT-moesin, moesin-T558D, or moesin-T558A were exposed to an fMLF gradient of 100 nM (>30 cells per condition), and CI was calculated. ***, P < 0.001 compared with WT (Student’s t test). (C–F) Control and moesin RNAi cells were stimulated with 100 nM fMLF for 0 or 2 min. Expression of RhoA-GTP and total RhoA (C), p-MLC and total MLC (D), Rac-GTP and total Rac (E), and Cdc42-GTP and total Cdc42 (F) was measured by immunoblot. Graphs show quantification of immunoblot data. Results are shown relative to control cells at 0 min. *, P < 0.05; ***, P < 0.001 compared with control (Student’s t test). (G) HL60 cells (n > 30 per group) expressing N-moesin–GFP were stimulated for the indicated times with 100 nM fMLF and visualized using fluorescence (top) and DIC microscopy (bottom). (A and G) Bars, 10 µm. Data are representative of (A and G and blots in C–F) or are compiled from three independent experiments (B and graphs in C–F; mean and SEM in B–F).
Figure 6.
Figure 6.
Moesin interacts with RhoGEFs. (A) The DH/PH fragment of Vav1 was immunoprecipitated with N-moesin (aa 1–310) or C-moesin (aa 457–577). (B) Rac was pulled down with Vav1-DH/PH domain in the presence or absence of N-moesin. (C) N-moesin was immunoprecipitated with the DH/PH domain or the PDZ/RGS domain of PRG. (D) RhoA was pulled down with PRG DH/PH domain in the presence or absence of N-moesin. (E) N-moesin was immunoprecipitated with the DH/PH domain of αPIX. (F) Cdc42 was pulled down with the αPIX DH/PH domain in the presence or absence of N-moesin. (B, D, and F) *, P < 0.05 (Student’s t test). Data are representative of (blots in A–F) or are compiled from three independent experiments (graphs in B, D, and F; mean and SEM in B, D, and F).
Figure 7.
Figure 7.
Knockdown of αPIX rescues cell migration in moesin-depleted cells. (A) Control, moesin RNAi, moesin + Vav1 RNAi, or moesin + αPIX RNAi cells were exposed to a 100-nM fMLF gradient. Each trace represents one individual cell (>30 cells per condition). (B and C) Cells were treated as in A. CI (B) and speed (C) were calculated. ***, P < 0.001 (Student’s t test). (D) Control, moesin RNAi, moesin + Vav1 RNAi, or moesin + αPIX RNAi cells were stimulated with fMLF and were visualized with F-actin (top) and DIC (bottom). n > 30 cells per condition. Bars: (A) 100 µm; (D) 10 µm. (E) Cells were treated as in D. Pseudopod lifetime was calculated. **, P < 0.01; ***, P < 0.001 (Student’s t test). Data are representative of (A and D) or are compiled from three independent experiments (B, C, and E; mean and SEM in B, C, and E).
Figure 8.
Figure 8.
Myosin phosphatase releases moesin-mediated inhibition. (A) HL60 cells (n > 30) expressing PP1c-YFP were stimulated for the indicated times with 100 nM fMLF and were visualized with fluorescence (top) and DIC microscopy (bottom). Arrow indicates the leading edge. (B) Expression of PP1c (top) or MBS (bottom) in control and PP1c RNAi cells or in control and MBS RNAi cells was measured by immunoblot. Two PP1c or MBS RNAi cell lines are shown. GAPDH was used as a loading control. (C) Control, PP1c, or MBS RNAi cells were stimulated with 100 nM fMLF. Expression of p-moesin and total moesin was measured with immunoblot. Graph shows quantification of immunoblot data. Results are presented relative to maximum activation of p-moesin at 0 min. ***, P < 0.001 compared with control without fMLF. (D) PP1c RNAi cells or MBS RNAi cells (n > 30 per group) expressing moesin-YFP were stimulated for the indicated times with 100 nM fMLF and were visualized with fluorescence (top) and DIC microscopy (bottom). Arrowheads indicate transient leading edges. (A and D) Bars, 10 µm. Data are representative of (A, B, D, and blots in C) or are compiled from three independent experiments (graph in C; mean and SEM in C).
Figure 9.
Figure 9.
Myosin phosphatase is recruited to the leading edges by front signals. (A) Control, PP1c RNAi, or MBS RNAi cells were exposed to an fMLF gradient of 100 nM (>30 cells per condition). Each trace represents the trajectory of one cell. (B and C) Cells were treated as in A. CI (B) and migration speed (C) were calculated. **, P < 0.01; ***, P < 0.001 compared with control (Student’s t test). (D and E) Control, PP1c RNAi, PP1c RNAi + WT-moesin, and PP1c RNAi + mosein-T558A cells were exposed to an fMLF gradient. CI (D) and migration speed (E) were calculated. *, P < 0.01; ***, P < 0.001 compared with control (Student’s t test). (F) PP1c was pulled down with MBS in the presence or absence of fMLF in HL60 cells. (G) HL60 cells (n > 30 per group) expressing PP1c-YFP were left untreated (left) or treated with Hem1 RNAi (middle) or PTX (right) in the presence of 100 nM fMLF for 2 min. Cells were visualized with fluorescence (top) and DIC microscopy (bottom). Bars: (A) 100 µm; (G) 10 µm. Data are representative of (A, F, and G) or are compiled from three independent experiments (B–E; mean and SEM in B–E).

References

    1. Bretscher A., Edwards K., and Fehon R.G.. 2002. ERM proteins and merlin: integrators at the cell cortex. Nat. Rev. Mol. Cell Biol. 3:586–599 10.1038/nrm882 - DOI - PubMed
    1. Brown M.J., Nijhara R., Hallam J.A., Gignac M., Yamada K.M., Erlandsen S.L., Delon J., Kruhlak M., and Shaw S.. 2003. Chemokine stimulation of human peripheral blood T lymphocytes induces rapid dephosphorylation of ERM proteins, which facilitates loss of microvilli and polarization. Blood. 102:3890–3899 10.1182/blood-2002-12-3807 - DOI - PubMed
    1. Brozna J.P.1990. Shwartzman reaction. Semin. Thromb. Hemost. 16:326–332 10.1055/s-2007-1002685 - DOI - PubMed
    1. Cremasco V., Graham D.B., Novack D.V., Swat W., and Faccio R.. 2008. Vav/Phospholipase Cγ2-mediated control of a neutrophil-dependent murine model of rheumatoid arthritis. Arthritis Rheum. 58:2712–2722 10.1002/art.23757 - DOI - PMC - PubMed
    1. Doi Y., Itoh M., Yonemura S., Ishihara S., Takano H., Noda T., and Tsukita S.. 1999. Normal development of mice and unimpaired cell adhesion/cell motility/actin-based cytoskeleton without compensatory up-regulation of ezrin or radixin in moesin gene knockout. J. Biol. Chem. 274:2315–2321 10.1074/jbc.274.4.2315 - DOI - PubMed

Publication types

MeSH terms