

Review
doi: 10.1038/nrn3886.
Redefining the cerebellar cortex as an assembly of non-uniform Purkinje cell microcircuits
Affiliations
- PMID: 25601779
- PMCID: PMC4476393
- DOI: 10.1038/nrn3886
Item in Clipboard
Review
Redefining the cerebellar cortex as an assembly of non-uniform Purkinje cell microcircuits
Nat Rev Neurosci.
2015 Feb.
Abstract
The adult mammalian cerebellar cortex is generally assumed to have a uniform cytoarchitecture. Differences in cerebellar function are thought to arise primarily through distinct patterns of input and output connectivity rather than as a result of variations in cortical microcircuitry. However, evidence from anatomical, physiological and genetic studies is increasingly challenging this orthodoxy, and there are now various lines of evidence indicating that the cerebellar cortex is not uniform. Here, we develop the hypothesis that regional differences in properties of cerebellar cortical microcircuits lead to important differences in information processing.
Figures

a| Dorso-posterior view of the rat cerebellum showing its major anatomical subdivisions. Note the bilateral organization with the anatomical midline (dashed line) dividing the cerebellar vermis into two halves and a hemisphere on each side. Dotted line shows the midline plane of the section in panel b. b| Drawing of midsagittal cross-section through the rat cerebellum, showing its lobular organization, with each lobe demarcated by Roman numerals. Dotted line demarcates the cerebellar cortex from the white matter. c| The basic cerebellar cytoarchitecture is comprised of Purkinje cells, which are the output cells of the cerebellar cortex, granule cells, Golgi cells, Lugaro cells, unipolar brush cells, stellate cells and basket cell interneurons. The two main types of afferents that project to the cerebellum are the climbing fibres, which synapse directly with Purkinje cells, and the mossy fibres, which synapse with granule cells. The axons of the granule cells ascend up to the molecular layer where they bifurcate in a T-type manner to form parallel fibres, which extend for several millimetres along the folia of cerebellar lobules. COP, copula pyramidis; FL, flocculus; gcl, granular layer; LS, lobulus simplex; ml, molecular layer; pcl, Purkinje cell layer; PF, paraflocculus; PML, paramedian lobule; UBC, unipolar brush cell. Adapted, with permission, from REF.

Line drawings and photomicrographs illustrating representative morphologies of Purkinje cells present in the apex (upper panel) and base (lower panel) of cerebellar folia in adult mice. To the right are shown examples of Purkinje cells labelled using an L7/Pcp2CreER tamoxifen inducible genetic approach, which selectively induces green fluorescent protein expression in a small subset of Purkinje cells (green). The tissue was counterstained with calbindin, which marks all Purkinje cells (red). In contrast to Purkinje cells located in the apex (upper panel), those located in the base region of a folium usually have dendritic arbours with two main primary dendrites (lower panel). Scale bar in photomicrograph = 50μm. Line drawings reproduced, with permission from REF. Photomicrographs produced using the methods described in REF.

Schematic illustrating the results of wholemount immunohistochemical staining of the mouse cerebellum, showing alternating bands of zebrin II expression (brown). The co-localization of zebrin II+ Purkinje cells (brown) and zebrin II− Purkinje cells with various other molecular makers is shown. NCS-1, EAAT4, excitatory amino acid transporter 4; GABABr2, GABA-B receptor subtype 2; MAP1a, microtubule-associated protein 1A; mGluR1B, metabotropic glutamate receptor R1b; NCS-1, neuronal calcium sensor-1; PLCB3, phospholipase Cβ3; PLCB4, phospholipase Cβ4. Schematic is based on data from REFS, , , –, , , .

The intrinsic properties and firing patterns of Purkinje cells vary in different regions of the cerebellar cortex. a| In brain slice preparation in juvenile rats (between postnatal days 21 and 23) firing patterns were determined in response to depolarizing currents injected from hyperpolarized holding potentials. Representative traces illustrate tonic firing, complex bursting, initial bursting, and gap firing patterns of activity. b| The pie charts show the relative proportion of each of the different firing patterns in lobules III–V and lobule X of the cerebellar vermis. Tonic firing and complex bursting patterns were found both in lobules III–V and X, whereas gap firing and initial bursting firing patterns were encountered only in lobule X. c| Extracellular recordings of Purkinje cells in the presence of ketamine/xylazine that were localized to zebrin II− (Z−) and zebrin II+ (Z+) bands respectively. Asterisks indicate complex spikes. Dot indicates complex spike expanded above. Zebrin II− Purkinje cells have higher simple spike firing rates (spikes without asterisks). The graph shows the mean simple spike firing rates in Z− and Z+ bands. Error bars indicate one SD of the distribution. d| Graph shows the normalized complex spike-simple spike pause – the pause in simple spike activity following the occurrence of a complex spike – for Purkinje cells in Z− and Z+ bands. Purkinje cells in Z− bands have a relatively stronger active suppression of simple spikes than Purkinje cells in Z+ bands. The mean simple spike pause duration of each Purkinje cell was normalized by dividing by its mean simple spike interspike interval. The distribution of ratio is shown for Z− and Z+ Purkinje cells. Dashed line indicates the expected ratio if the latency from a complex spike to the first succeeding simple spike is solely a function of simple spike firing rate. The solid black lines indicate the overall median across each group, and the grey boxes indicate the interquartile range from 25% to 75%. e| Purkinje cell simple spike firing rates in relation to complex spikes recorded in awake adult mouse. Four different types of simple spike response types among the Purkinje cells were identified: normal, facilitation, suppression and oscillation. The percentage of different response types in Z and Z+ PCs are shown in the pie charts. The facilitation type occurs predominantly in Z PCs, whereas the suppression and oscillati on type are restricted to the Z+ PCs. a, b reproduced and adapted with permission from REF; c, d reproduced, with permission from REF
e; adapted with permission from REF.
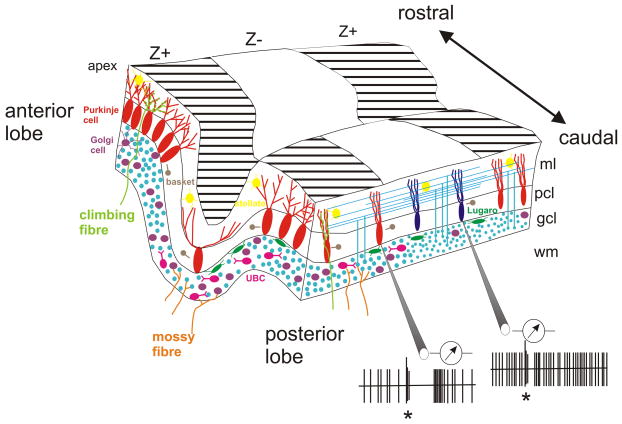
Schematic showing a cross section of part of the cerebellar cortex, depicting key differences in anatomy and physiology. Larger Purkinje cells are present in the vermis (to the left), and there is a greater density of Purkinje cells in the anterior lobe and apex of the folia. The dendritic arbour of Purkinje cells also differs between the base and apex of folia. Granule cell density is greater in the apex of the folia and larger granule cells are found in the vermis compared to the hemispheres. Unipolar brush cells (UBCs) and Golgi cells are found mainly in the vermis of the posterior lobe also Lugaro cells have a higher packing density in the posterior lobe. Molecular markers such as excitatory amino acid transporter 4, GABA-B receptor subtype 2, phospholipase Cβ3 and neuronal calcium sensor-1 are co-expressed in rostro-caudally oriented bands with Purkinje cells positive for the molecular marker zebrin II (Z+); while metabotropic glutamate receptor R1b, microtubule-associated protein 1A, neurogranin, neuroplastin, and phospholipase Cβ4 are found in zebrin II− bands (Z−). Purkinje cell simple spike frequencies are higher in Purkinje cells located in Z− bands; while simple spike activity is less regular, the complex spike-induced pause in simple spikes is longer, and the post pause facilitation in simple spikes is greater in Z+ bands. Asterisk indicates complex spike; gcl, granule cell layer; ml, molecular layer; pcl, Purkinje cell layer; white matter; Z+, zebrin II+ band; Z−, zebrin II− band. Schematic is based on data from REFS, , , , , , , , , ,
References
-
- Eccles JC, Ito M, Szentágothai J. The Cerebellum as a Neuronal Machine. Springer-Verlag; Berlin: 1967.
-
- Palay SL, Chan-Palay V. Cerebellar cortex: cytology and organization. Springer; Berlin: 1974.
Publication types
MeSH terms
Grants and funding
LinkOut - more resources
Full Text Sources
Other Literature Sources
