. 2015 Jan 5:8:434.
doi: 10.3389/fnins.2014.00434. eCollection 2014.

Feasibility of simultaneous whole-brain imaging on an integrated PET-MRI system using an enhanced 2-point Dixon attenuation correction method

Affiliations

Feasibility of simultaneous whole-brain imaging on an integrated PET-MRI system using an enhanced 2-point Dixon attenuation correction method

Udunna C Anazodo et al. Front Neurosci. .

Abstract

Purpose: To evaluate a potential approach for improved attenuation correction (AC) of PET in simultaneous PET and MRI brain imaging, a straightforward approach that adds bone information missing on Dixon AC was explored.

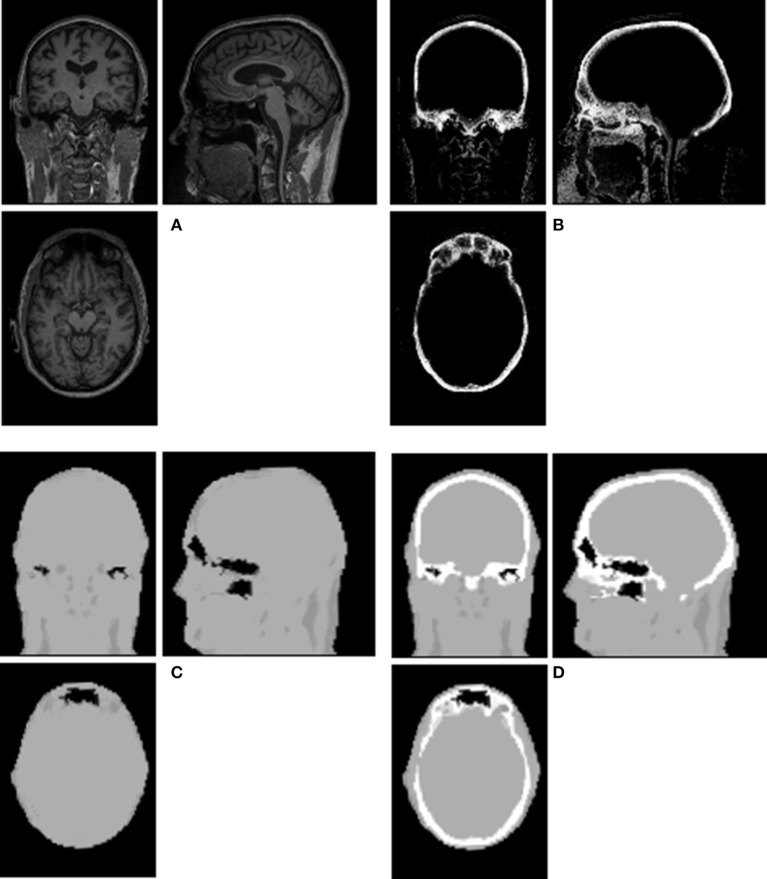
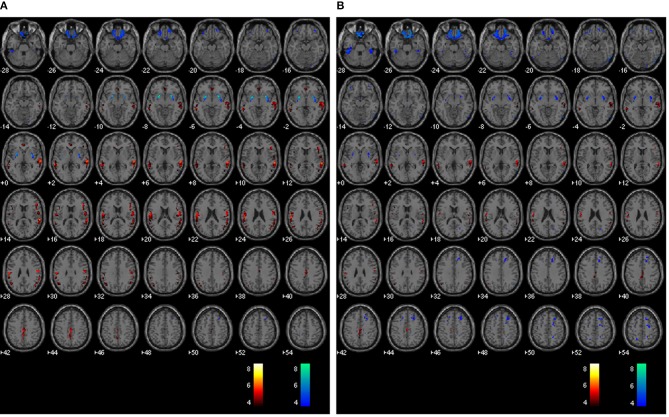
Methods: Bone information derived from individual T1-weighted MRI data using segmentation tools in SPM8, were added to the standard Dixon AC map. Percent relative difference between PET reconstructed with Dixon+bone and with Dixon AC maps were compared across brain regions of 13 oncology patients. The clinical potential of the improved Dixon AC was investigated by comparing relative perfusion (rCBF) measured with arterial spin labeling to relative glucose uptake (rPETdxbone) measured simultaneously with (18)F-flurodexoyglucose in several regions across the brain.

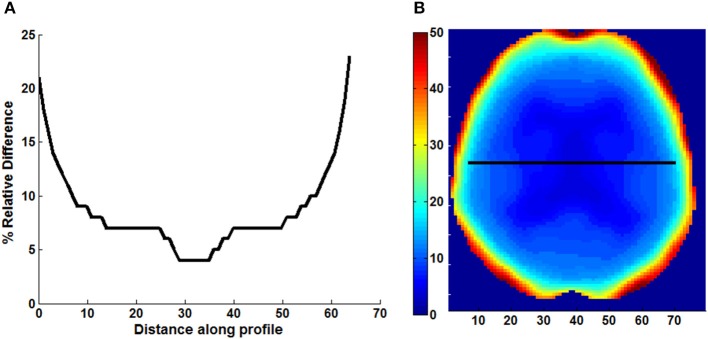
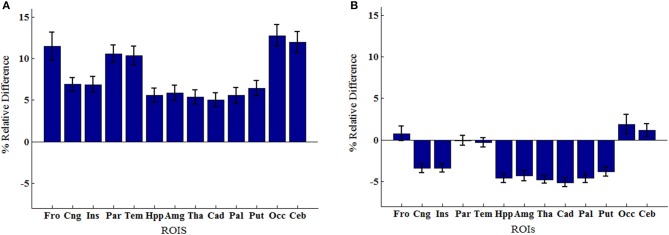
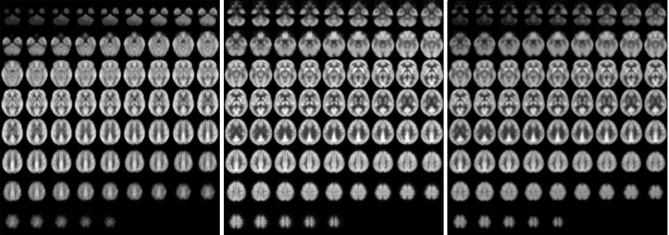
Results: A gradual increase in PET signal from center to the edge of the brain was observed in PET reconstructed with Dixon+bone. A 5-20% reduction in regional PET signals were observed in data corrected with standard Dixon AC maps. These regional underestimations of PET were either reduced or removed when Dixon+bone AC was applied. The mean relative correlation coefficient between rCBF and rPETdxbone was r = 0.53 (p < 0.001). Marked regional variations in rCBF-to-rPET correlation were observed, with the highest associations in the caudate and cingulate and the lowest in limbic structures. All findings were well matched to observations from previous studies conducted with PET data reconstructed with computed tomography derived AC maps.

Conclusion: Adding bone information derived from T1-weighted MRI to Dixon AC maps can improve underestimation of PET activity in hybrid PET-MRI neuroimaging.

Keywords: 18F-fluorodexoyglucose; ASL; FDG; PET-MRI; arterial spin labeling; attenuation correction; cerebral blood flow; glucose uptake.


Figures

Figure 1
Figure 1
Illustration of a Dixon+bone μ-map generated in a representative subject. Images (A) T1-weighted MPRAGE, (B) bone probability map, (C) Dixon μ-map, and (D) Dixon+bone μ-map are shown in axial, coronal and sagittal views of a single slice.
Figure 2
Figure 2
Line profile (A) across the center slice of a map (B) of relative difference (% RD) between PET images reconstructed with Dixon and Dixon+bone μ-maps. Images are presented from a representative subject.
Figure 3
Figure 3
Regions of interest group means percent relative difference (% RD) in (A) mean activity concentration and (B) mean relative activity between PET signals reconstructed with Dixon and Dixon+bone μ-maps. Errors bars represent standard deviation on the means. Regions abbreviations: Fro, Frontal; Cng, Cingulate; Ins, Insula; Par, Parietal; Tem, Temporal; Hpp, Hippocampus; Amg, Amygdala; Tha, Thalamus; Cad, Caudate; Pal, Globus Pallidus; Put, Putamen; Occ, Occipital; Ceb, Cerebellum.
Figure 4
Figure 4
Whole-brain group maps of relative perfusion and relative glucose uptake from; left to right: pCASL-CBF, 18F-FDG-PET reconstructed with Dixon+bone MRAC and 18F-FDG-PET reconstructed with Dixon MRAC. Spatial blurring seen in the bottom row images of the perfusion maps could be minimized with segmented multi-shot 3D GRASE acquisitions.
Figure 5
Figure 5
Whole brain voxel-by-voxel comparison between relative cerebral blood flow and relative 18F-FDG-PET activity reconstructed with Dixon (A) and Dixon+bone (B) μ-maps. Areas with greater relative perfusion are shown in red while areas with greater relative glucose uptake are shown in blue. Statistical differences are set at threshold for cluster >50 voxels, p < 0.05 corrected for multiple comparisons with FDR.

References

    1. Andersen F. L., Ladefoged C. N., Beyer T., Keller S. H., Hansen A. E., Højgaard L., et al. (2014). Combined PET/MR imaging in neurology: MR-based attenuation correction implies a strong spatial bias when ignoring bone. Neuroimage 84, 206–216. 10.1016/j.neuroimage.2013.08.042 - DOI - PubMed
    1. Ashburner J., Friston K. J. (2005). Unified segmentation. Neuroimage 26, 839–851. 10.1016/j.neuroimage.2005.02.018 - DOI - PubMed
    1. Bailey D. L., Barthel H., Beyer T., Boellaard R., Gückel B., Hellwig D., et al. (2013). Summary report of the first international workshop on PET/MR imaging, March 19-23, 2012, Tübingen, Germany. Mol. Imaging Biol. 15, 361–371. 10.1007/s11307-013-0623-1 - DOI - PMC - PubMed
    1. Bentourkia M., Bol A., Ivanoiu A., Labar D., Sibomana M., Coppens A., et al. (2000). Comparison of regional cerebral blood flow and glucose metabolism in the normal brain: effect of aging. J. Neurol. Sci. 181, 19–28. 10.1016/S0022-510X(00)00396-8 - DOI - PubMed
    1. Beyer T., Weigert M., Quick H. H., Pietrzyk U., Vogt F., Palm C., et al. (2008). MR-based attenuation correction for torso-PET/MR imaging: pitfalls in mapping MR to CT data. Eur. J. Nucl. Med. Mol. Imaging 35, 1142–1146. 10.1007/s00259-008-0734-0 - DOI - PubMed

LinkOut - more resources