

Engulfment of activated apoptotic cells abolishes TGF-β-mediated immunoregulation via the induction of IL-6
- PMID: 25601923
- PMCID: PMC4319310
- DOI: 10.4049/jimmunol.1401256
Engulfment of activated apoptotic cells abolishes TGF-β-mediated immunoregulation via the induction of IL-6
Abstract
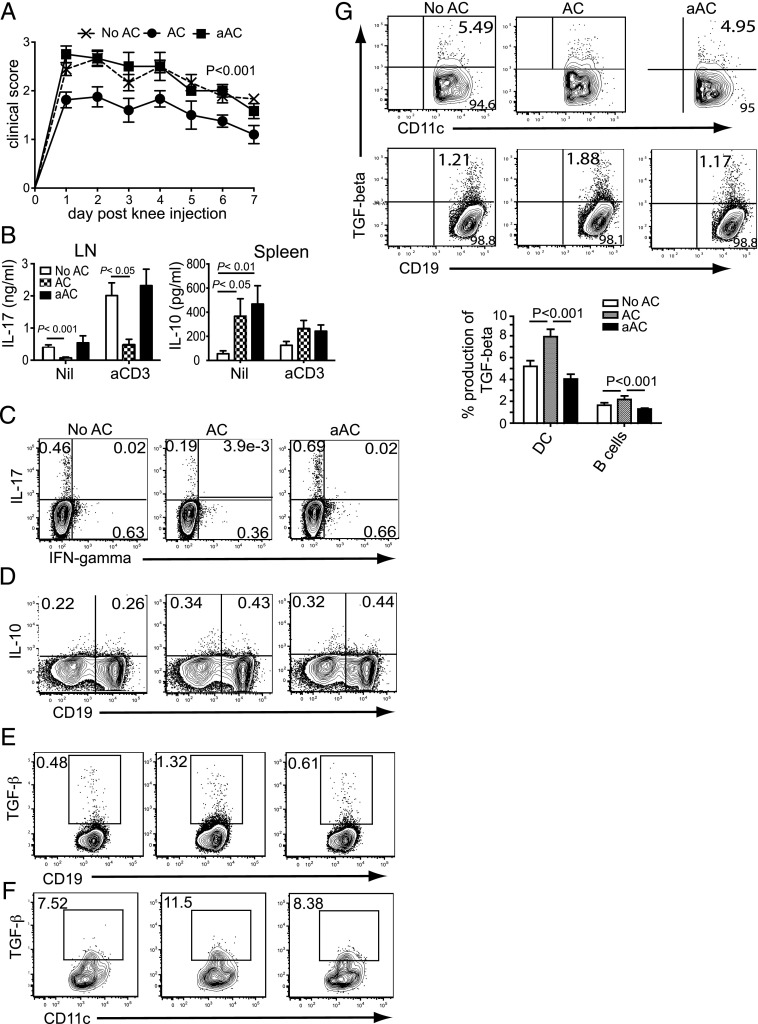
Phagocytosis of apoptotic cells (ACs) is usually a potent immunoregulatory signal but can also promote inflammation. In this article, we show that administration of apoptotic dendritic cells (DCs) inhibited inflammation in vivo through increasing production of TGF-β from intrinsic DCs and B cells. However, ACs derived from LPS-activated DCs failed to restrain inflammation because of a short-lived but marked IL-6 response, which abolished the increase in TGF-β. Inhibition of IL-6 restored the protective anti-inflammatory properties of aACs and the TGF-β response. DCs isolated from mice that had received resting but not activated ACs could transfer the suppression of inflammation to recipient mice. These transferred DCs stimulated B cell TGF-β production and relied on an intact B cell compartment to limit inflammation. These results highlight how the activation state of AC governs their ability to control inflammation through reciprocal regulation of IL-6 and TGF-β.
Copyright © 2015 The Authors.
Figures


Similar articles
-
DNA methylation governs the dynamic regulation of inflammation by apoptotic cells during efferocytosis.Sci Rep. 2017 Feb 7;7:42204. doi: 10.1038/srep42204. Sci Rep. 2017. PMID: 28169339 Free PMC article.
-
Macrophages that have ingested apoptotic cells in vitro inhibit proinflammatory cytokine production through autocrine/paracrine mechanisms involving TGF-beta, PGE2, and PAF.J Clin Invest. 1998 Feb 15;101(4):890-8. doi: 10.1172/JCI1112. J Clin Invest. 1998. PMID: 9466984 Free PMC article.
-
Cytokine production in association with phagocytosis of apoptotic cells by immature dendritic cells.Cell Immunol. 2003 Dec;226(2):105-15. doi: 10.1016/j.cellimm.2003.11.008. Cell Immunol. 2003. PMID: 14962498
-
Apoptotic cell administration enhances pancreatic islet engraftment by induction of regulatory T cells and tolerogenic dendritic cells.Cell Mol Immunol. 2013 Sep;10(5):393-402. doi: 10.1038/cmi.2013.16. Epub 2013 Jul 22. Cell Mol Immunol. 2013. PMID: 23872920 Free PMC article.
-
Cancer cell immune escape and tumor progression by exploitation of anti-inflammatory and pro-inflammatory responses.Cancer Biol Ther. 2005 Sep;4(9):924-33. doi: 10.4161/cbt.4.9.2101. Epub 2005 Sep 16. Cancer Biol Ther. 2005. PMID: 16177562 Review.
Cited by
-
Mini-Review: The Administration of Apoptotic Cells for Treating Rheumatoid Arthritis: Current Knowledge and Clinical Perspectives.Front Immunol. 2021 Feb 25;12:630170. doi: 10.3389/fimmu.2021.630170. eCollection 2021. Front Immunol. 2021. PMID: 33717160 Free PMC article. Review.
-
Apoptotic cell infusion treats ongoing collagen-induced arthritis, even in the presence of methotrexate, and is synergic with anti-TNF therapy.Arthritis Res Ther. 2016 Aug 11;18(1):184. doi: 10.1186/s13075-016-1084-0. Arthritis Res Ther. 2016. PMID: 27516061 Free PMC article.
-
DNA methylation governs the dynamic regulation of inflammation by apoptotic cells during efferocytosis.Sci Rep. 2017 Feb 7;7:42204. doi: 10.1038/srep42204. Sci Rep. 2017. PMID: 28169339 Free PMC article.
-
Harnessing Apoptotic Cell Clearance to Treat Autoimmune Arthritis.Front Immunol. 2017 Oct 9;8:1191. doi: 10.3389/fimmu.2017.01191. eCollection 2017. Front Immunol. 2017. PMID: 29062314 Free PMC article. Review.
-
Phagocytosis imprints heterogeneity in tissue-resident macrophages.J Exp Med. 2017 May 1;214(5):1281-1296. doi: 10.1084/jem.20161375. Epub 2017 Apr 21. J Exp Med. 2017. PMID: 28432199 Free PMC article.
References
-
- Henson P. M., Hume D. A. 2006. Apoptotic cell removal in development and tissue homeostasis. Trends Immunol. 27: 244–250. - PubMed
-
- Fadok V. A., Bratton D. L., Konowal A., Freed P. W., Westcott J. Y., Henson P. M. 1998. Macrophages that have ingested apoptotic cells in vitro inhibit proinflammatory cytokine production through autocrine/paracrine mechanisms involving TGF-beta, PGE2, and PAF. J. Clin. Invest. 101: 890–898. - PMC - PubMed
-
- Voll R. E., Herrmann M., Roth E. A., Stach C., Kalden J. R., Girkontaite I. 1997. Immunosuppressive effects of apoptotic cells. Nature 390: 350–351. - PubMed
-
- Savill J., Dransfield I., Gregory C., Haslett C. 2002. A blast from the past: clearance of apoptotic cells regulates immune responses. Nat. Rev. Immunol. 2: 965–975. - PubMed
-
- Muñoz L. E., Lauber K., Schiller M., Manfredi A. A., Herrmann M. 2010. The role of defective clearance of apoptotic cells in systemic autoimmunity. Nat. Rev. Rheumatol. 6: 280–289. - PubMed
Publication types
MeSH terms
Substances
Grants and funding
LinkOut - more resources
Full Text Sources
Other Literature Sources
