

Delay differential analysis of time series
- PMID: 25602777
- PMCID: PMC4374491
- DOI: 10.1162/NECO_a_00706
Delay differential analysis of time series
Abstract
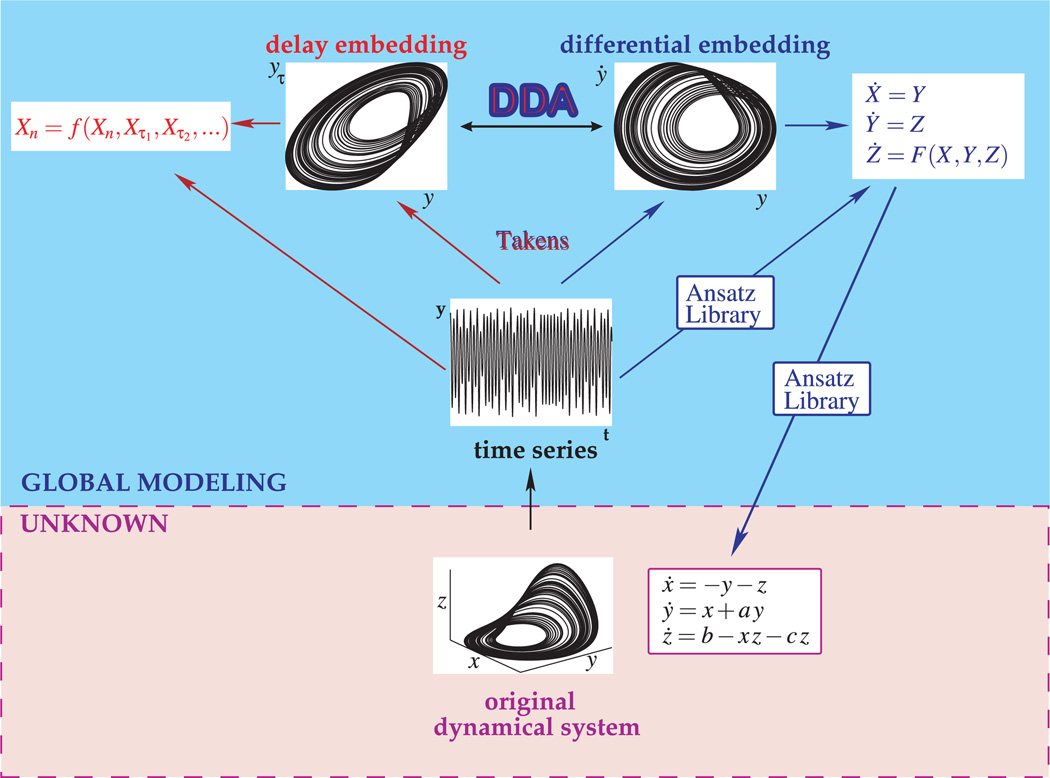
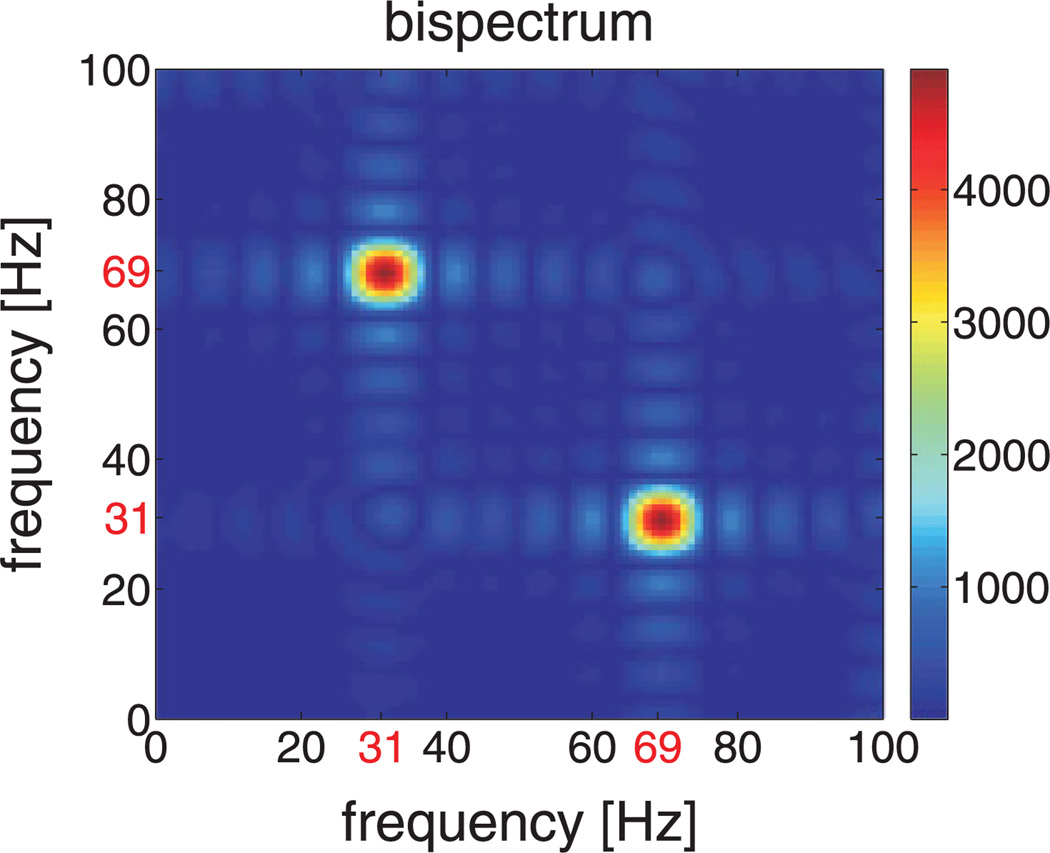
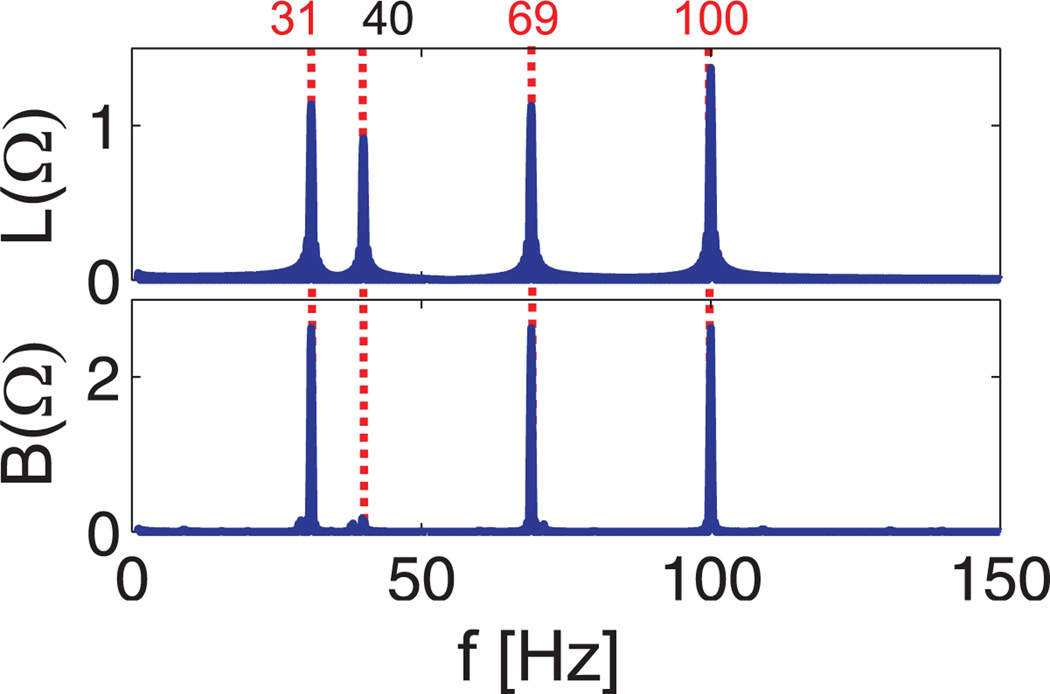
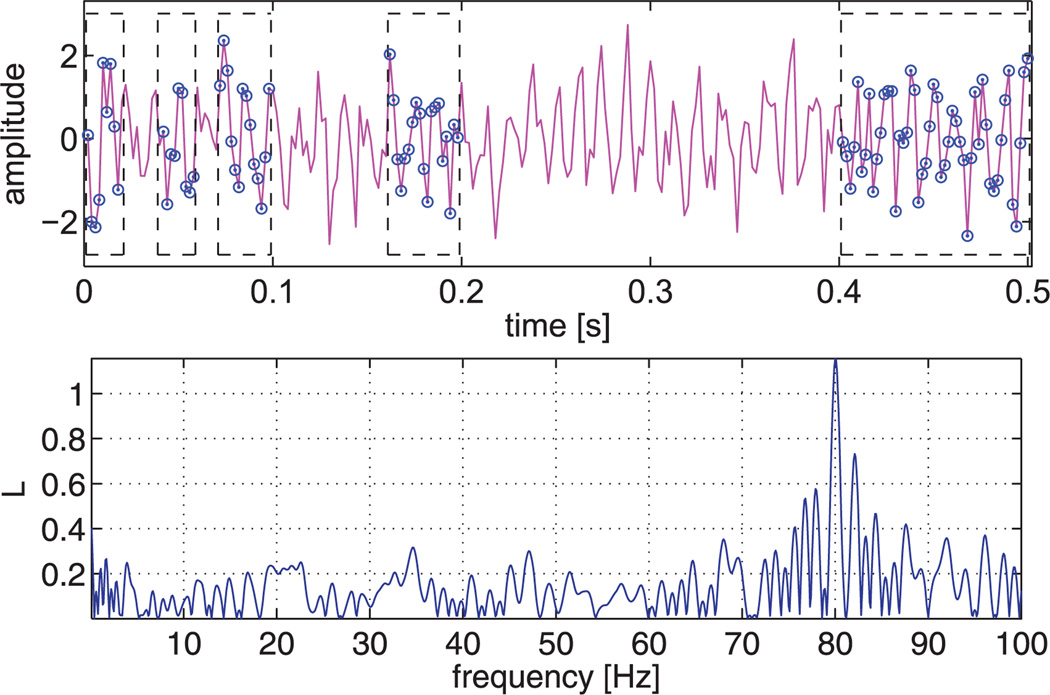
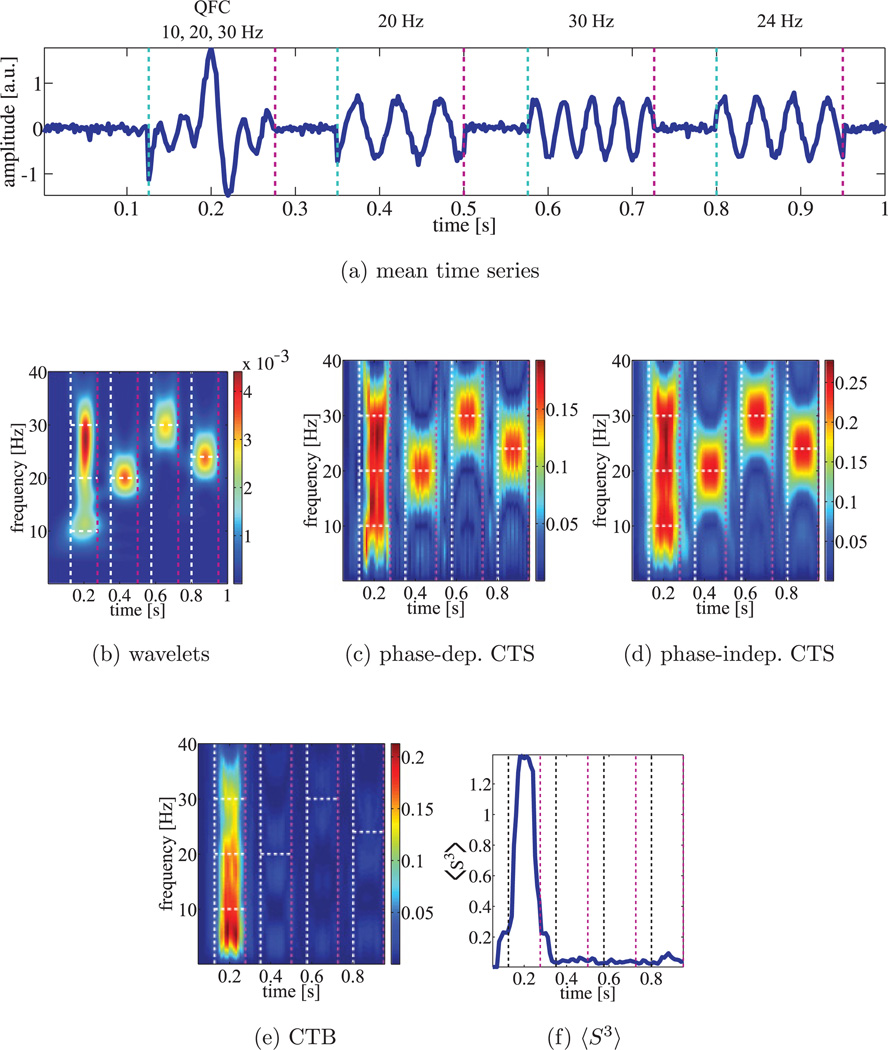
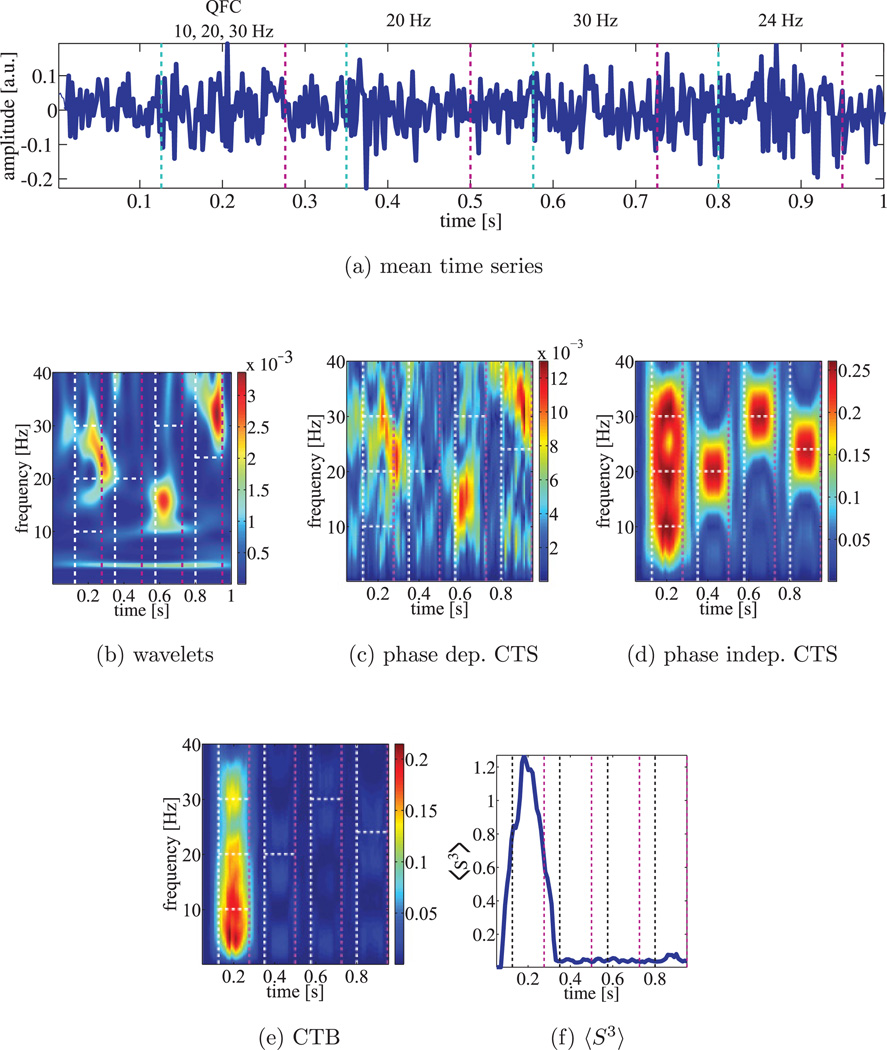
Nonlinear dynamical system analysis based on embedding theory has been used for modeling and prediction, but it also has applications to signal detection and classification of time series. An embedding creates a multidimensional geometrical object from a single time series. Traditionally either delay or derivative embeddings have been used. The delay embedding is composed of delayed versions of the signal, and the derivative embedding is composed of successive derivatives of the signal. The delay embedding has been extended to nonuniform embeddings to take multiple timescales into account. Both embeddings provide information on the underlying dynamical system without having direct access to all the system variables. Delay differential analysis is based on functional embeddings, a combination of the derivative embedding with nonuniform delay embeddings. Small delay differential equation (DDE) models that best represent relevant dynamic features of time series data are selected from a pool of candidate models for detection or classification. We show that the properties of DDEs support spectral analysis in the time domain where nonlinear correlation functions are used to detect frequencies, frequency and phase couplings, and bispectra. These can be efficiently computed with short time windows and are robust to noise. For frequency analysis, this framework is a multivariate extension of discrete Fourier transform (DFT), and for higher-order spectra, it is a linear and multivariate alternative to multidimensional fast Fourier transform of multidimensional correlations. This method can be applied to short or sparse time series and can be extended to cross-trial and cross-channel spectra if multiple short data segments of the same experiment are available. Together, this time-domain toolbox provides higher temporal resolution, increased frequency and phase coupling information, and it allows an easy and straightforward implementation of higher-order spectra across time compared with frequency-based methods such as the DFT and cross-spectral analysis.
Figures
References
-
- Boashash B. Higher-order statistical signal processing. Hoboken, NJ: Wiley; 1995.
-
- Boersma P. Accurate short-term analysis of the fundamental frequency and the harmonics-to-noise ratio of a sampled sound. Proceedings 17 of the Institute of Phonetic Sciences, University of Amsterdam. 1993:97–110.
-
- Bracewell R. The Fourier transform and its applications. New York: McGraw-Hill; 1965.
-
- Chan Y, Langford R. Spectral estimation via the high-order Yule-Walker equations. IEEE Transactions on Acoustics, Speech and Signal Processing. 1982;30(5):689–698.