

Association between hospitalization for pneumonia and subsequent risk of cardiovascular disease
- PMID: 25602997
- PMCID: PMC4687729
- DOI: 10.1001/jama.2014.18229
Association between hospitalization for pneumonia and subsequent risk of cardiovascular disease
Abstract
Importance: The risk of cardiovascular disease (CVD) after infection is poorly understood.
Objective: To determine whether hospitalization for pneumonia is associated with an increased short-term and long-term risk of CVD.
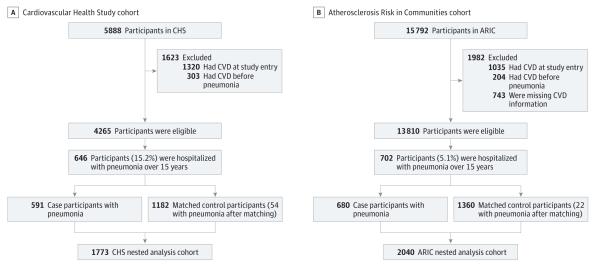
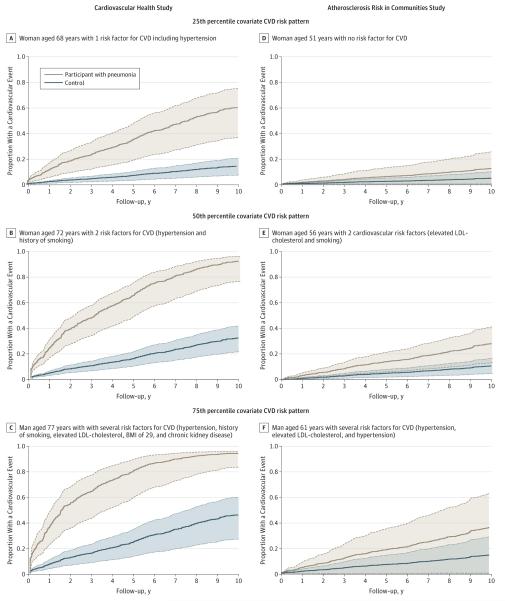
Design, settings, and participants: We examined 2 community-based cohorts: the Cardiovascular Health Study (CHS, n = 5888; enrollment age, ≥65 years; enrollment period, 1989-1994) and the Atherosclerosis Risk in Communities study (ARIC, n = 15,792; enrollment age, 45-64 years; enrollment period, 1987-1989). Participants were followed up through December 31, 2010. We matched each participant hospitalized with pneumonia to 2 controls. Pneumonia cases and controls were followed for occurrence of CVD over 10 years after matching. We estimated hazard ratios (HRs) for CVD at different time intervals, adjusting for demographics, CVD risk factors, subclinical CVD, comorbidities, and functional status.
Exposures: Hospitalization for pneumonia.
Main outcomes and measures: Incident CVD (myocardial infarction, stroke, and fatal coronary heart disease).
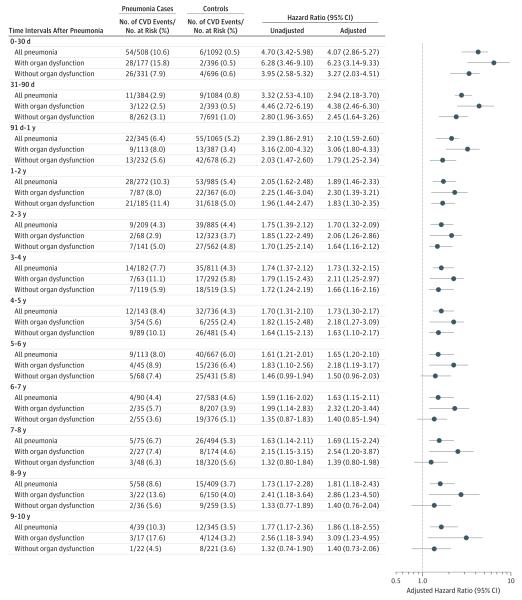
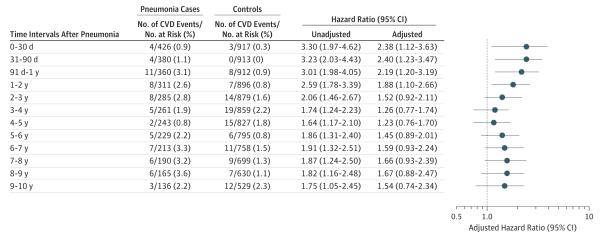
Results: Of 591 pneumonia cases in CHS, 206 had CVD events over 10 years after pneumonia hospitalization. CVD risk after pneumonia was highest in the first year. CVD occurred in 54 cases and 6 controls in the first 30 days (HR, 4.07; 95% CI, 2.86-5.27); 11 cases and 9 controls between 31 and 90 days (HR, 2.94; 95% CI, 2.18-3.70); and 22 cases and 55 controls between 91 days and 1 year (HR, 2.10; 95% CI, 1.59-2.60). Additional CVD risk remained elevated into the tenth year, when 4 cases and 12 controls developed CVD (HR, 1.86; 95% CI, 1.18-2.55). In ARIC, of 680 pneumonia cases, 112 had CVD over 10 years after hospitalization. CVD occurred in 4 cases and 3 controls in the first 30 days (HR, 2.38; 95% CI, 1.12-3.63); 4 cases and 0 controls between 31 and 90 days (HR, 2.40; 95% CI, 1.23-3.47); 11 cases and 8 controls between 91 days and 1 year (HR, 2.19; 95% CI, 1.20-3.19); and 8 cases and 7 controls during the second year (HR, 1.88; 95% CI, 1.10-2.66). After the second year, the HRs were no longer statistically significant.
Conclusions and relevance: Hospitalization for pneumonia was associated with increased short-term and long-term risk of CVD, suggesting that pneumonia may be a risk factor for CVD.
Figures
Comment in
-
Hospitalization for pneumonia and risk of cardiovascular disease.JAMA. 2015 May 5;313(17):1753. doi: 10.1001/jama.2015.3130. JAMA. 2015. PMID: 25942728 No abstract available.
-
Hospitalization for pneumonia and risk of cardiovascular disease--reply.JAMA. 2015 May 5;313(17):1753-4. doi: 10.1001/jama.2015.3133. JAMA. 2015. PMID: 25942729 No abstract available.
References
-
- NHLBI [Accessed June 13, 2013];Morbidity and mortality: 2012 chartbook on cardiovascular lung and blood diseases. http://www.nhlbi.nih.gov/files/docs/research/2012_ChartBook_508.pdf.
-
- Corrales-Medina VF, Madjid M, Musher DM. Role of acute infection in triggering acute coronary syndromes. Lancet Infect Dis. 2010;10(2):83–92. - PubMed
-
- Corrales-Medina VF, Musher DM, Shachkina S, Chirinos JA. Acute pneumonia and the cardiovascular system. Lancet. 2013;381(9865):496–505. - PubMed
Publication types
MeSH terms
Grants and funding
- UL1 TR000005/TR/NCATS NIH HHS/United States
- HHSN268201100010C/HL/NHLBI NIH HHS/United States
- HHSN268201100011I/HL/NHLBI NIH HHS/United States
- N01 HC055019/HC/NHLBI NIH HHS/United States
- HHSN268201100006C/HL/NHLBI NIH HHS/United States
- K23GM083215/GM/NIGMS NIH HHS/United States
- N01 HC085079/HL/NHLBI NIH HHS/United States
- R01 HL080295/HL/NHLBI NIH HHS/United States
- HHSN268201100007I/HL/NHLBI NIH HHS/United States
- HL080295/HL/NHLBI NIH HHS/United States
- R01 AG023629/AG/NIA NIH HHS/United States
- N01 HC085081/HL/NHLBI NIH HHS/United States
- N01 HC55222/HC/NHLBI NIH HHS/United States
- HHSN268201100012C/HL/NHLBI NIH HHS/United States
- R01GM097471/GM/NIGMS NIH HHS/United States
- TL1 TR000145/TR/NCATS NIH HHS/United States
- HHSN268201100009I/HL/NHLBI NIH HHS/United States
- N01 HC085080/HL/NHLBI NIH HHS/United States
- HHSN268201100008C/HL/NHLBI NIH HHS/United States
- U01 HL080295/HL/NHLBI NIH HHS/United States
- HHSN268201100008I/HL/NHLBI NIH HHS/United States
- HHSN268201100005G/HL/NHLBI NIH HHS/United States
- N01 HC085082/HL/NHLBI NIH HHS/United States
- HHSN268201100007C/HL/NHLBI NIH HHS/United States
- HHSN268200800007C/HL/NHLBI NIH HHS/United States
- N01 HC085086/HL/NHLBI NIH HHS/United States
- N01 HC085083/HL/NHLBI NIH HHS/United States
- HHSN268201100011C/HL/NHLBI NIH HHS/United States
- K23 GM083215/GM/NIGMS NIH HHS/United States
- HHSN268201200036C/HL/NHLBI NIH HHS/United States
- R01 GM097471/GM/NIGMS NIH HHS/United States
- N01 HC055222/HL/NHLBI NIH HHS/United States
- HHSN268201100005I/HL/NHLBI NIH HHS/United States
- HHSN268201100009C/HL/NHLBI NIH HHS/United States
- HHSN268201100005C/HL/NHLBI NIH HHS/United States
- AG023629/AG/NIA NIH HHS/United States
- R56 AG023629/AG/NIA NIH HHS/United States
LinkOut - more resources
Full Text Sources
Other Literature Sources
Medical
