. 2015 Aug;9(8):1700-9.
doi: 10.1038/ismej.2014.246. Epub 2015 Jan 20.

Extracellular matrix structure governs invasion resistance in bacterial biofilms

Affiliations

Extracellular matrix structure governs invasion resistance in bacterial biofilms

Carey D Nadell et al. ISME J. 2015 Aug.

Abstract

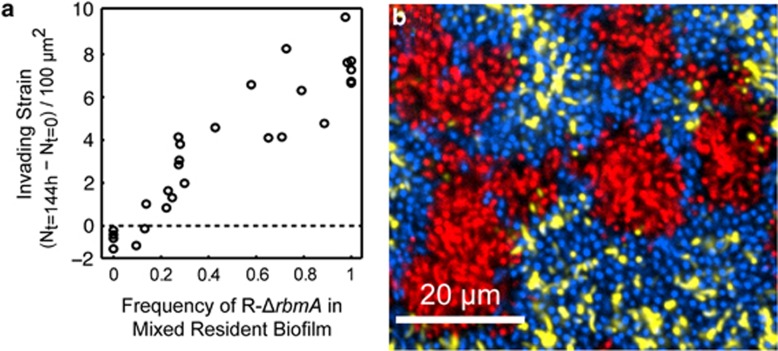
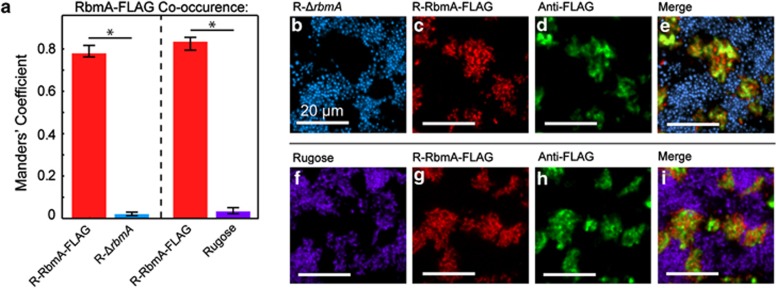
Many bacteria are highly adapted for life in communities, or biofilms. A defining feature of biofilms is the production of extracellular matrix that binds cells together. The biofilm matrix provides numerous fitness benefits, including protection from environmental stresses and enhanced nutrient availability. Here we investigate defense against biofilm invasion using the model bacterium Vibrio cholerae. We demonstrate that immotile cells, including those identical to the biofilm resident strain, are completely excluded from entry into resident biofilms. Motile cells can colonize and grow on the biofilm exterior, but are readily removed by shear forces. Protection from invasion into the biofilm interior is mediated by the secreted protein RbmA, which binds mother-daughter cell pairs to each other and to polysaccharide components of the matrix. RbmA, and the invasion protection it confers, strongly localize to the cell lineages that produce it.


Figures

Figure 1
Figure 1
Resident biofilms suppress adherence and subsequent biomass accumulation of planktonic cell populations. (ad) Attachment and growth of invading strains when introduced to open glass substrata or to resident biofilms. Bars denote medians and represent summed cell counts in all biofilm layers per 100 μm2 of substratum; error bars denote interquartile ranges with n=9. Asterisks indicate P<0.05 for Mann–Whitney U tests with Bonferroni correction for 16 pairwise comparisons. (e) Attachment of Motility+ Matrix+ (yellow) to open glass and (f) their biomass accumulation after 24 h. (g) Attachment of Motility+ Matrix+ (yellow) to a resident biofilm (red), and (h) their biomass accumulation after 24 h. Images in (eh) are top-down views of three-dimensional maximum intensity projections.
Figure 2
Figure 2
(a) Adhesion and subsequent growth of Motility+ Matrix+ cells in the presence of resident Rugose biofilm (red line), resident R-ΔrbmA biofilm (blue line), or no biofilm (black line). Data points indicate means and represent summed cell counts in all biofilm layers per 100 μm2 of substratum; error bars denote the s.d. with n=4. (b) Rugose biofilm (red) and (c) R-ΔrbmA biofilm (blue) at 24 h and following challenge by the Motility+ Matrix+ invader (yellow). Central images in (b) and (c) are single optical planes 6 μm above the glass–biofilm interface, with z-projections at the right of each panel. (d) Height-stratified profiles of invasion by a Motility+ Matrix+ planktonic population introduced to fully confluent Rugose biofilms (red bars) and R-ΔrbmA biofilms (blue bars). Bars denote means and represent cell counts per optical section per 100 μm2; error bars denote the s.d. with n=12. (e) Histograms of resident neighbor cell distances in confluent Rugose biofilms (red bars, top inset) and R-ΔrbmA biofilms (blue bars, bottom inset), with distribution medians indicated by the arrows at the top of the panel.
Figure 3
Figure 3
Invasion of resident biofilms comprising a mixture of the Rugose strain and the R-ΔrbmA strain. (a) Change in invader cell count as a function of the fraction of R-ΔrbmA cells within resident biofilms. Data points represent the change in cell count summed over all biofilm layers per 100 μm2 of substratum. The horizontal dotted line denotes no change in number of invader cells. Spearman rank correlation: n=28, ρ=0.906, P<10−7. (b) A single optical plane 6 μm above the glass–biofilm interface. The resident biofilm consists of Rugose cells (red) and R-ΔrbmA cells (blue). Invading Motility+ Matrix+ cells are yellow.
Figure 4
Figure 4
(a) Localization of anti-FLAG fluorescence to Rugose cells producing RbmA-FLAG and to co-inoculated R-ΔrbmA cells, which do not produce RbmA (left two bars); localization of anti-FLAG to Rugose cells producing RbmA-FLAG and to co-inoculated Rugose cells producing un-tagged RbmA (right two bars). Bars denote medians, and error bars denote interquartile ranges for n=6–8. Asterisks denote P<0.05 for Mann-Whitney U tests. (be) R-ΔrbmA cells (blue), or (fi) Rugose cells producing un-tagged RbmA (purple) were co-inoculated with R-RbmA-FLAG cells producing FLAG-tagged RbmA (red). A Cy-3-conjugated anti-FLAG antibody was used to visualize RbmA-FLAG localization (green).

References

    1. Abee T, Kovács ÁT, Kuipers OP, van der Veen S. Biofilm formation and dispersal in Gram-positive bacteria. Curr Opin Biotech. 2011;22:172–179. - PubMed
    1. Absalon C, Van Dellen K, Watnick PI. A communal bacterial adhesin anchors biofilm and bystander cells to surfaces. PLoS Pathog. 2011;7:e1002210. - PMC - PubMed
    1. Ai H, Henderson JN, Remington SJ, Campbell RE. Directed evolution of a monomeric, bright and photostable version of Clavularia cyan fluorescent protein: structural characterization and applications in fluorescence imaging. Biochem J. 2006;400:531–540. - PMC - PubMed
    1. Anderson MS, Garcia EC, Cotter PA. Kind discrimination and competitive exclusion mediated by contact-dependent growth inhibition systems shape biofilm community structure. PLoS Pathog. 2014;10:e1004076. - PMC - PubMed
    1. Amarasekare P, Nisbet RM. Spatial heterogeneity, source-sink dynamics, and the local coexistence of competing species. Am Nat. 2001;158:572–584. - PubMed

Publication types

MeSH terms