

Dynamic cortical lateralization during olfactory discrimination learning
- PMID: 25604039
- PMCID: PMC4386967
- DOI: 10.1113/jphysiol.2014.288381
Dynamic cortical lateralization during olfactory discrimination learning
Abstract
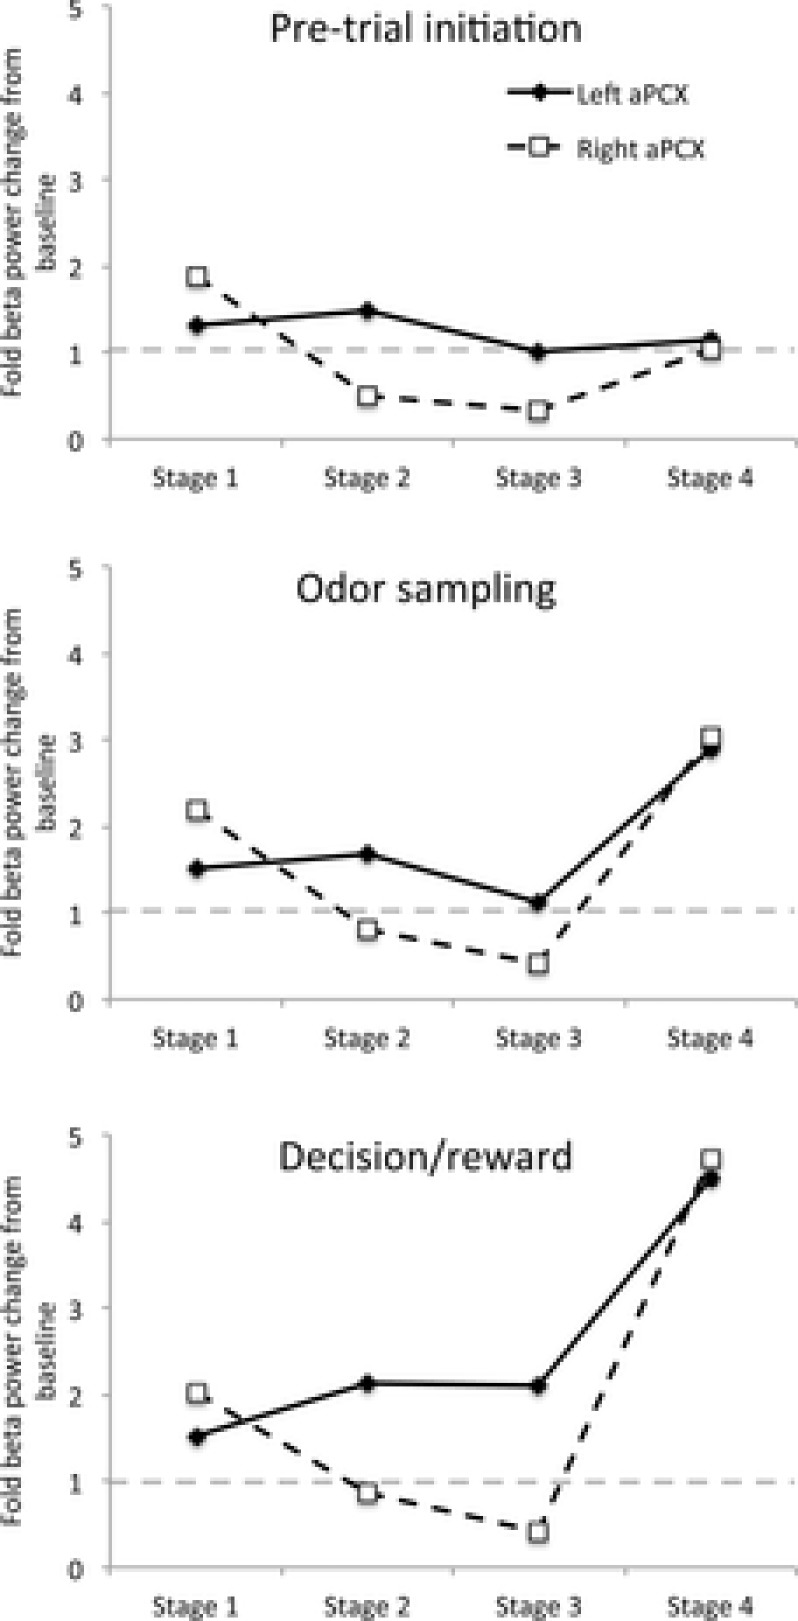
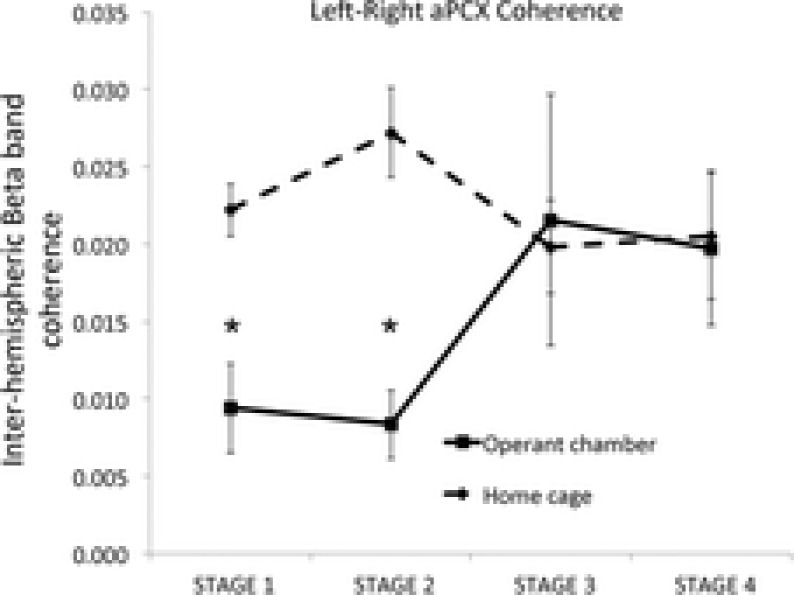
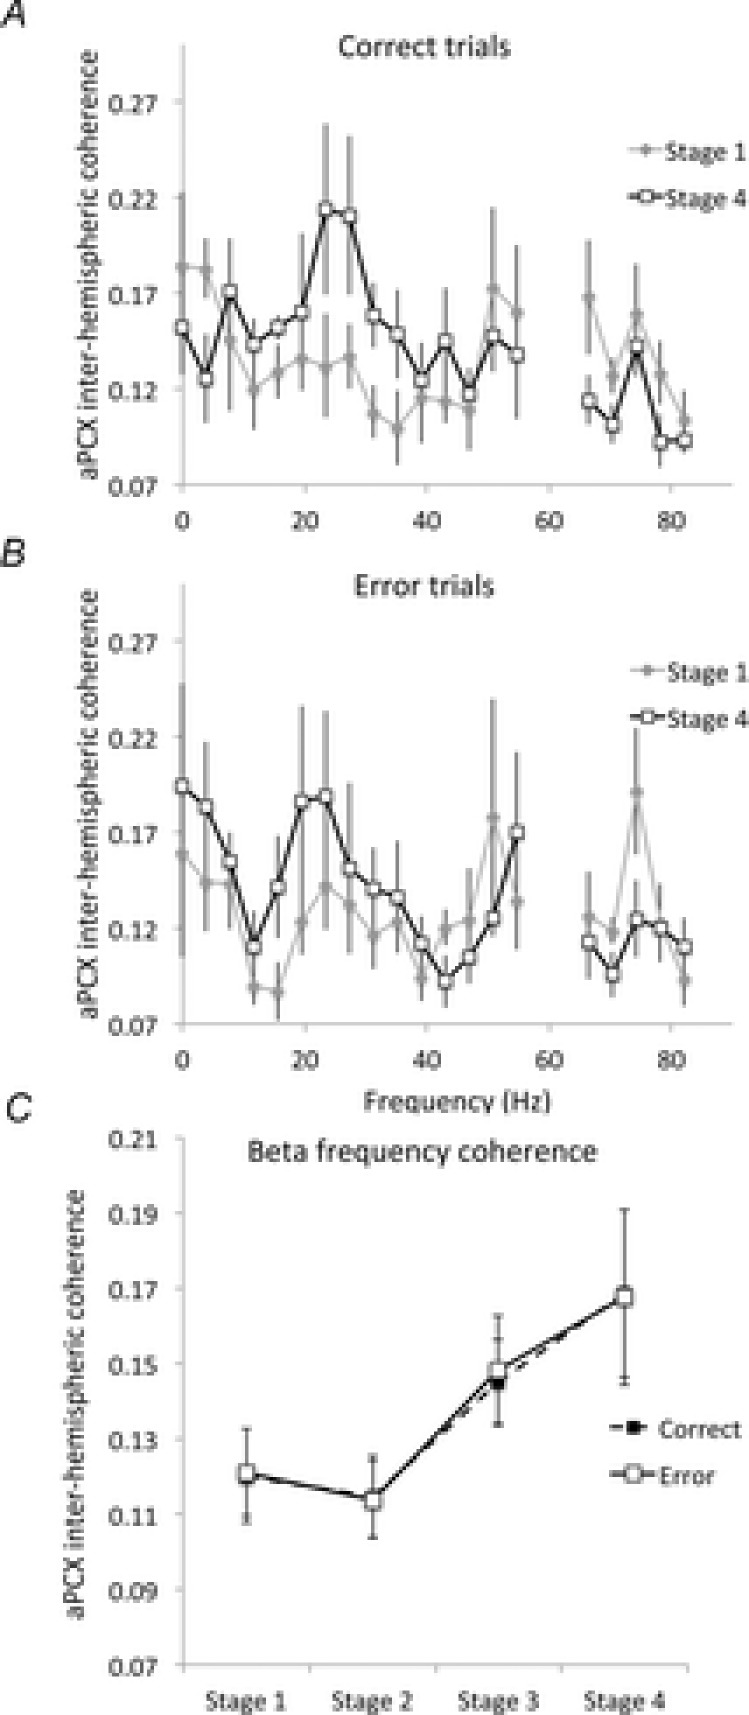
Bilateral cortical circuits are not necessarily symmetrical. Asymmetry, or cerebral lateralization, allows functional specialization of bilateral brain regions and has been described in humans for such diverse functions as perception, memory and emotion. There is also evidence for asymmetry in the human olfactory system, although evidence in non-human animal models is lacking. In the present study, we took advantage of the known changes in olfactory cortical local field potentials that occur over the course of odour discrimination training to test for functional asymmetry in piriform cortical activity during learning. Both right and left piriform cortex local field potential activities were recorded. The results obtained demonstrate a robust interhemispheric asymmetry in anterior piriform cortex activity that emerges during specific stages of odour discrimination learning, with a transient bias toward the left hemisphere. This asymmetry is not apparent during error trials. Furthermore, functional connectivity (coherence) between the bilateral anterior piriform cortices is learning- and context-dependent. Steady-state interhemispheric anterior piriform cortex coherence is reduced during the initial stages of learning and then recovers as animals acquire competent performance. The decrease in coherence is seen relative to bilateral coherence expressed in the home cage, which remains stable across conditioning days. Similarly, transient, trial-related interhemispheric coherence increases with task competence. Taken together, the results demonstrate transient asymmetry in piriform cortical function during odour discrimination learning until mastery, suggesting that each piriform cortex may contribute something unique to odour memory.
© 2015 The Authors. The Journal of Physiology © 2015 The Physiological Society.
Figures
Similar articles
-
Distinct roles of bulbar muscarinic and nicotinic receptors in olfactory discrimination learning.J Neurosci. 2014 Aug 20;34(34):11244-60. doi: 10.1523/JNEUROSCI.1499-14.2014. J Neurosci. 2014. PMID: 25143606 Free PMC article.
-
Odor fear conditioning modifies piriform cortex local field potentials both during conditioning and during post-conditioning sleep.PLoS One. 2011 Mar 23;6(3):e18130. doi: 10.1371/journal.pone.0018130. PLoS One. 2011. PMID: 21448432 Free PMC article.
-
Task-Correlated Cortical Asymmetry and Intra- and Inter-Hemispheric Separation.Sci Rep. 2017 Nov 6;7(1):14602. doi: 10.1038/s41598-017-15109-x. Sci Rep. 2017. PMID: 29097760 Free PMC article.
-
Dynamics of learning-induced cellular modifications in the cortex.Biol Cybern. 2005 Jun;92(6):360-6. doi: 10.1007/s00422-005-0564-0. Epub 2005 May 18. Biol Cybern. 2005. PMID: 15906082 Review.
-
[Involvement of the olfactory system in learning and memory: a close correlation between the olfactory deficit and the course of Alzheimer's disease?].Yakubutsu Seishin Kodo. 1991 Aug;11(4):223-35. Yakubutsu Seishin Kodo. 1991. PMID: 1799095 Review. Japanese.
Cited by
-
Validation of Olfactory Network Based on Brain Structural Connectivity and Its Association With Olfactory Test Scores.Front Syst Neurosci. 2021 Apr 13;15:638053. doi: 10.3389/fnsys.2021.638053. eCollection 2021. Front Syst Neurosci. 2021. PMID: 33927597 Free PMC article.
-
Loss of TRPC2 function in mice alters sex differences in brain regions regulating social behaviors.J Comp Neurol. 2023 Oct;531(15):1550-1561. doi: 10.1002/cne.25528. Epub 2023 Jul 27. J Comp Neurol. 2023. PMID: 37496437 Free PMC article.
-
Emergence of β-Band Oscillations in the Aged Rat Amygdala during Discrimination Learning and Decision Making Tasks.eNeuro. 2017 Oct 6;4(5):ENEURO.0245-17.2017. doi: 10.1523/ENEURO.0245-17.2017. eCollection 2017 Sep-Oct. eNeuro. 2017. PMID: 29034315 Free PMC article.
-
Odor Identification in Rats: Behavioral and Electrophysiological Evidence of Learned Olfactory-Auditory Associations.eNeuro. 2019 Aug 8;6(4):ENEURO.0102-19.2019. doi: 10.1523/ENEURO.0102-19.2019. Print 2019 Jul/Aug. eNeuro. 2019. PMID: 31362955 Free PMC article.
-
Bilateral and unilateral odor processing and odor perception.Commun Biol. 2020 Apr 1;3(1):150. doi: 10.1038/s42003-020-0876-6. Commun Biol. 2020. PMID: 32238904 Free PMC article. Review.
References
-
- Arora RC. Meltzer HY. Laterality and 3H-imipramine binding: studies in the frontal cortex of normal controls and suicide victims. Biol Psychiatry. 1991;29:1016–1022. - PubMed
-
- Bellas DN, Novelly RA. Eskenazi B. Olfactory lateralization and identification in right hemisphere lesion and control patients. Neuropsychologia. 1989;27:1187–1191. - PubMed
Publication types
MeSH terms
Grants and funding
LinkOut - more resources
Full Text Sources
Other Literature Sources