. 2015 Jan 21:8:37.
doi: 10.1186/s13071-015-0650-7.

An association of Aquaporin-4 with the immunoregulation of liver pathology in mice infected with Schistosoma japonicum

Affiliations

An association of Aquaporin-4 with the immunoregulation of liver pathology in mice infected with Schistosoma japonicum

Weiwei Zhang et al. Parasit Vectors. .

Abstract

Background: Schistosomiasis is a chronic parasitic disease that affects approximately 200 million people. In Schistosomiasis japonica and mansoni, parasite eggs were trapped in host liver and stimulated the CD4(+)T cell responses to regulate the formation of the granulomas. Subsequently, excessive granulomatous response in some heavily, and/or repeatedly infected individuals could result in chronic liver fibrosis and circulatory impairment. Thus, elucidation of the mechanisms of these responses will not only provide more information to better understand the mechanisms of the immunoregulation in schistosomiasis, but also help to design new therapies to control granuloma-associated immunopathology. The role of aquaporin-4 (AQP4) in water transport has been extensively investigated in the central nervous system (CNS). Recently, studies have shown that AQP4 expresses in immune system and lack of AQP4 in mice results in significantly less CD4(+)CD25(+) T regulatory cells (Treg cells) under physiological condition, one of the subpopulations of CD4(+)T cells which restrains immunopathology in hosts with schistosomiasis. However, little information exists regarding the contribution of AQP4 to the immune regulation in schistosome infection.

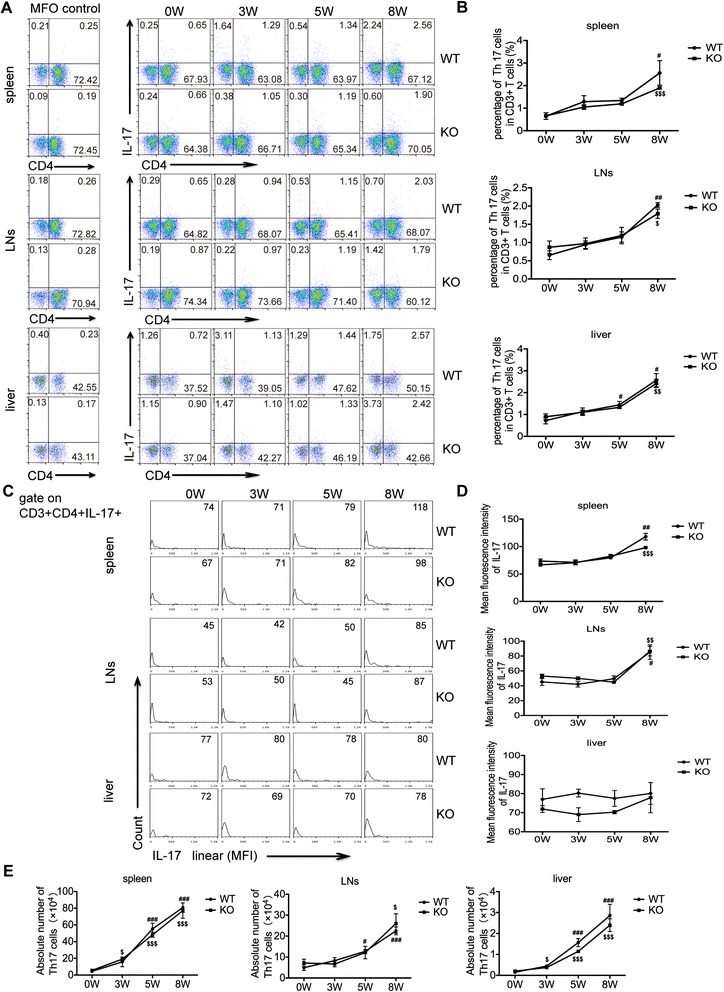
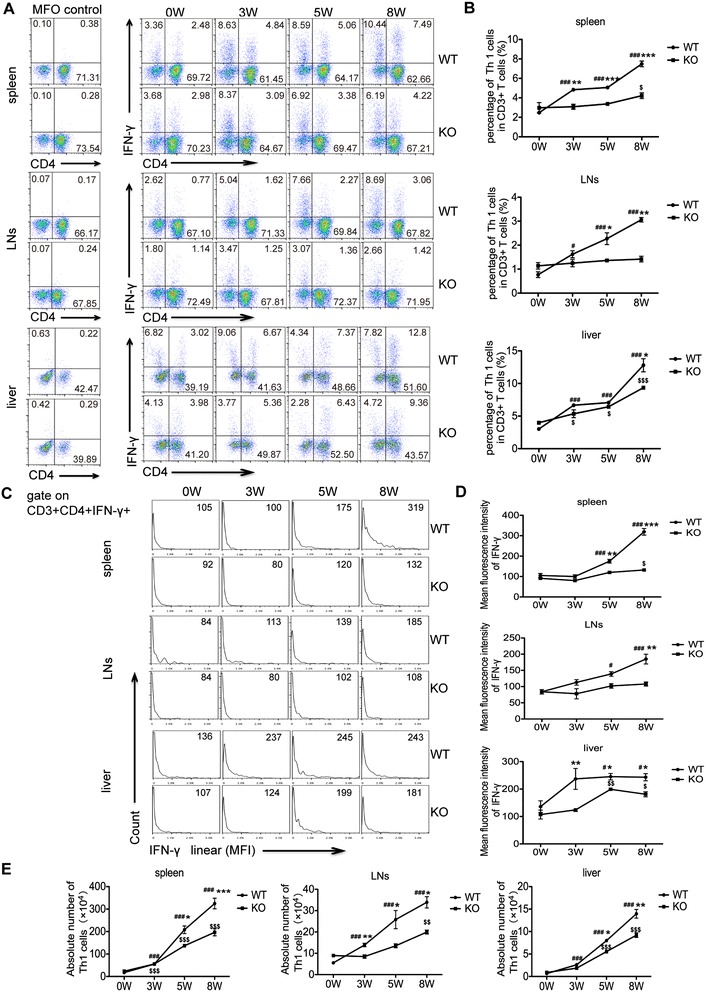
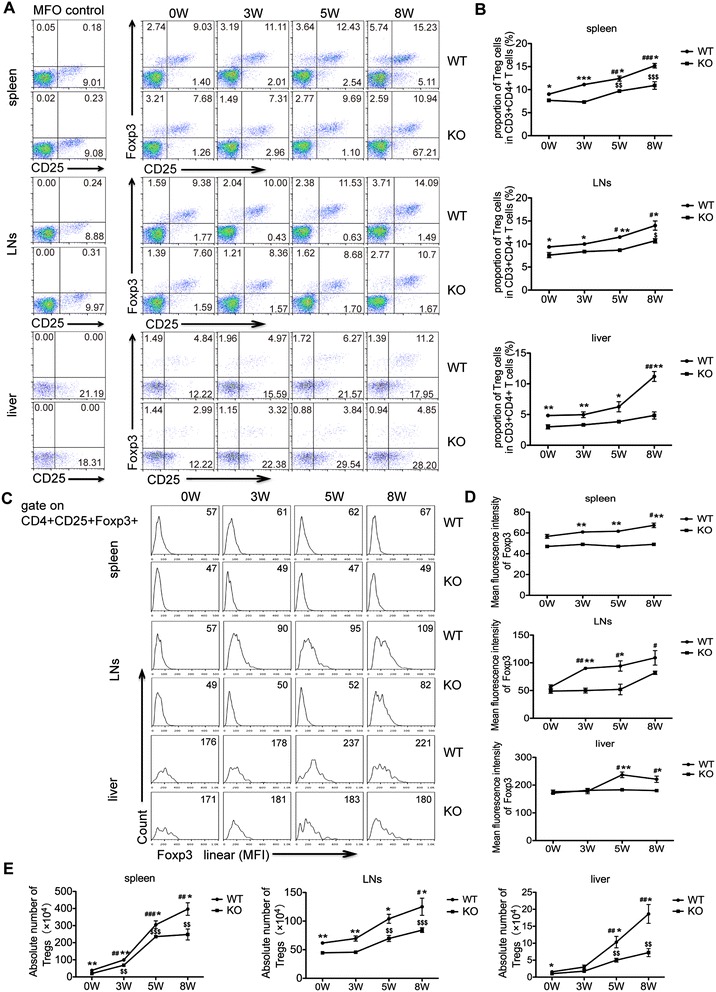
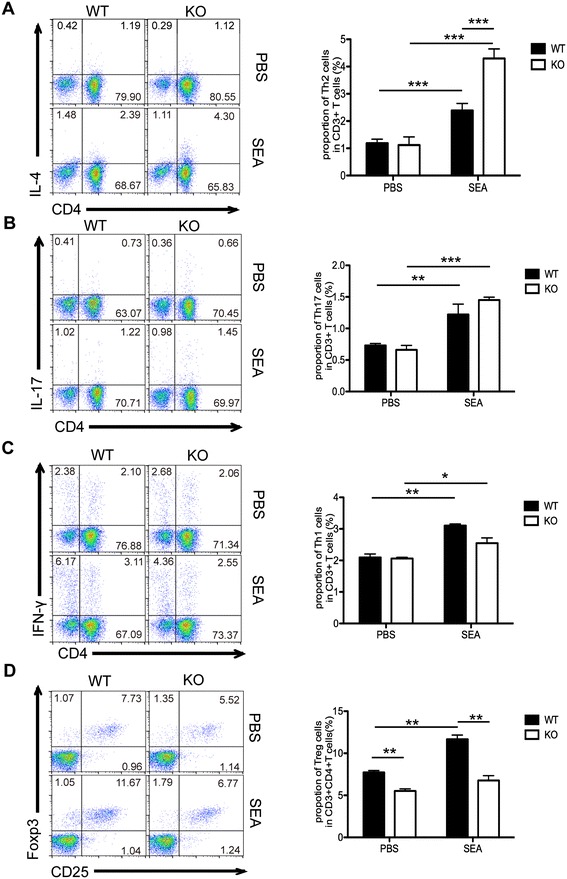
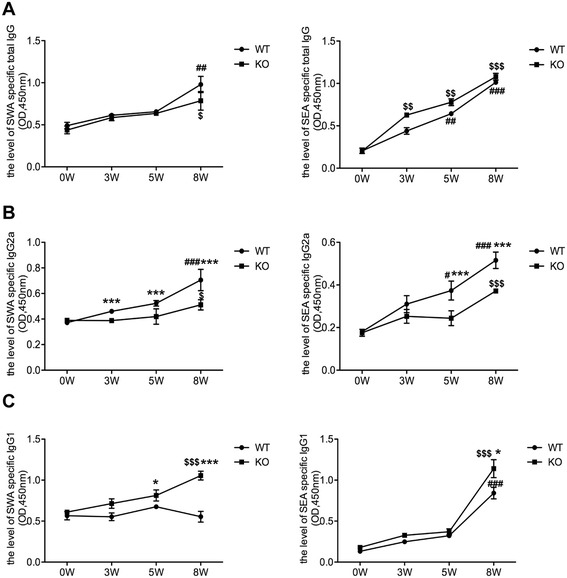
Methods: The liver granulomatous response in S. japonicum-infected AQP4 knockout (KO) mice and its wild-type (WT) littermates were detected by staining liver sections with hematoxylin and eosin. The generation of various CD4(+) T subsets, including Th1, Th2, Th17, and Treg cells were analyzed by flow cytometry. In addition, the levels of total IgG, IgG1, IgG2a in serum of infected mice were detected by ELISA assay.

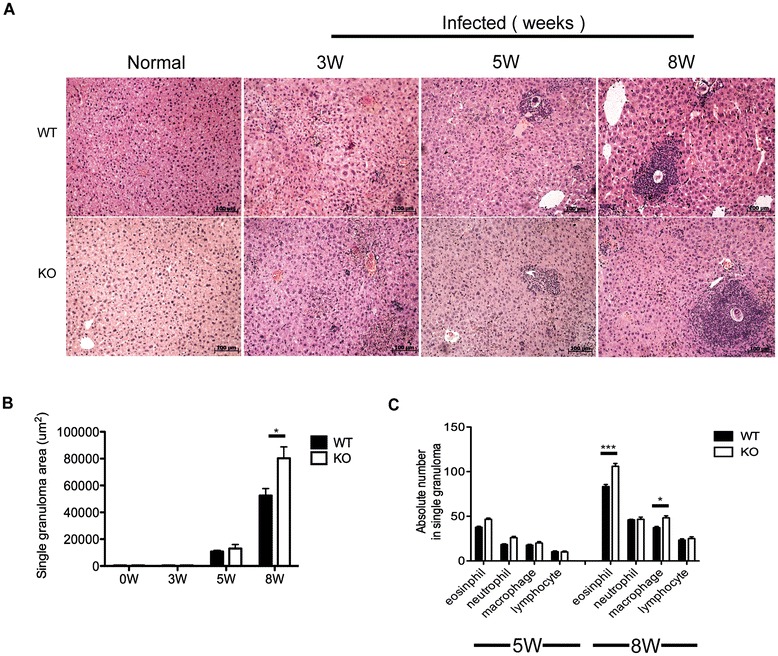
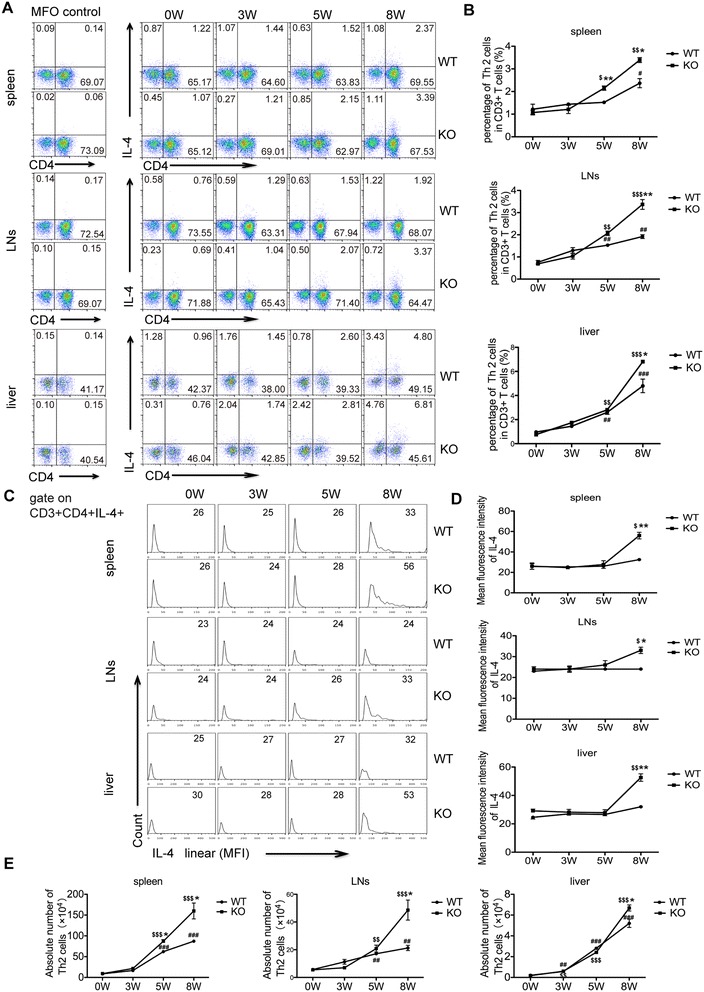
Results: Our results showed an enhanced granulomatous response with increased accumulation of eosinophils and macrophages around eggs in the liver of AQP4 KO mice with Schistosomiasis japonica. In addition, our study demonstrated enhanced Th2 but reduced Th1 and Treg cells generation in AQP4 KO mice with Schistosomiasis japonica, which may, at least partly, account for the enhancement of the liver granuloma formation.

Conclusion: Our study for the first time provides evidences that AQP4 has an association with the immunoregulation of the liver granuloma formation, which may confer a new option for schistosomiasis treatment.


Figures

Figure 1
Figure 1
S. japonicum infection results in an exacerbated liver granulomatous inflammation in AQP4 KO mice. At 0,3, 5,8 weeks post-infection, four AQP4 WT or KO mice were randomly chosen and sacrificed. Liver sections were stained with HE for microscopic examination. (A) Histopathology in the livers (magnification: 100×). Results are representative of two independent experiments. (B) Sizes of the granulomas were measured by computer-assisted morphometric analysis. (C) Absolute numbers of neutrophils, eosinophils, lymphocytes and macrophages in the granulomas. Values are given as mean ± SD of 8 AQP4 WT or KO mice from two independent experiments. *P < 0.05; **P < 0.01; ***P < 0.001.
Figure 2
Figure 2
Worm and egg burdens are similar in AQP4 KO and WT mice infected with Schistosoma japonicum . At 3, 5, and 8 weeks after S. japonicum infection, four AQP4 WT or KO mice were randomly chosen and sacrificed and then perfused to calculate adult worms (A) or worm pairs (B). (C) The number of eggs extracted from the liver was determined by microscopic examination. Values are given as mean ± SD of 8 mice from two independent experiments. *P < 0.05; **P < 0.01; ***P < 0.001.
Figure 3
Figure 3
Th2 cell responses are stronger in S. japonicum- infected AQP4 KO mice . Four AQP4 WT or KO mice were randomly chosen and sacrificed at 0, 3, 5, 8 weeks post-infection. (A) FCM analysis of Th2 cell subsets in AQP4 WT and KO mouse splenocytes, mesenteric lymphocytes and hepatocytes. (B) The kinetics of the percentages (gated on CD3+ cells) of Th2 cells in total CD3+ T cells in AQP4 WT and KO mouse spleens, mesenteric lymph nodes and livers. Representative histograms obtained by FCM analysis (C) of mean fluorescence intensity (MFI) of IL-4 expression in Th2 cells (D). (E) The kinetics of the absolute numbers of Th2 cells in AQP4 WT and KO mouse spleens, mesenteric lymph nodes and livers. Results are expressed as mean ± SD of 8 mice from two independent experiments. #P < 0.05, ##P < 0.01, ###P < 0.001 vs. AQP4 WT-0 W; $P < 0.05, $$P < 0.01, $$$P < 0.001 vs. AQP4 KO-0 W; *P < 0.05, **P < 0.01, ***P < 0.001 Th2 cells from AQP4 KO mice vs. from AQP4 WT mice at 0, 3, 5, 8 weeks post-infection.
Figure 4
Figure 4
Th17 cell responses show no statistically significant difference between AQP4 KO and WT mice after S. japonicum infection. At 0, 3, 5, 8 weeks post-infection, four AQP4 WT or KO mice were sacrificed and single cell suspension of splenocytes, mesenteric lymphocytes or liver cells were prepared for FCM analysis of Th17 cells. (A) The cells were gated on CD3+ splenocytes,lymphocytes or liver cells from AQP4 WT or KO mice for the detection of Th17 cells. (B) The proportion (gated on CD3+ cells) of Th17 cells in the spleen, lymph nodes and livers. Representative histograms obtained by FCM analysis (C) of mean fluorescence intensity (MFI) of IL-17 expression in Th17 cell (D). (E) The absolute number of Th17 cells in the spleen, lymph nodes and livers. Data represent means ± SD of 8 mice from two independent experiments. #P < 0.05, ##P < 0.01, ###P < 0.001 vs. AQP4 WT-0 W; $P < 0.05, $$P < 0.01, $$$P < 0.001 vs. AQP4 KO-0 W; *P < 0.05, **P < 0.01, ***P < 0.001 Th17 cells from AQP4 KO mice vs. from AQP4 WT mice at 0, 3, 5, 8 weeks post-infection.
Figure 5
Figure 5
Th1 cell responses are decreased in S. japonicum- infected AQP4 KO mice . (A) At 0, 3, 5, 8 weeks post-infection, the generation of IFN-γ producing-CD3+CD4+ cells in the spleen, lymph nodes and liver of AQP4 WT and KO mice was determined by intracellular staining and FCM. (B) The proportion (gated on CD3+ cells) of Th1 cells in mouse spleen, lymph nodes and livers. Representative histograms obtained by FCM analysis (C) of mean fluorescence intensity (MFI) of IFN-γ expression in Th1 cells (D). (E) The absolute number of Th1 cells in mouse spleen, lymph nodes and livers. Data represent means ± SD of 8 mice from two independent experiments. #P < 0.05, ##P < 0.01, ###P < 0.001 vs. AQP4 WT-0 W; $P < 0.05, $$P < 0.01, $$$P < 0.001 vs. AQP4 KO-0 W; *P < 0.05, **P < 0.01, ***P < 0.001 Th1 cells from AQP4 KO mice vs. from AQP4 WT mice at 0, 3, 5, 8 weeks post-infection.
Figure 6
Figure 6
Treg cells are reduced in S. japonicum- infected AQP4 KO mice . (A) FCM analysis from one representative experiment. At 0, 3, 5, 8 weeks post-infection, four AQP4 WT or KO mice were sacrificed and single cell suspensions of splenocytes, mesenteric lymphocytes or liver cells were prepared for FCM analysis of Treg cells. (B) Proportions of Treg cells in CD3+CD4+ T cells isolated from the spleen, mesenteric lymph nodes, and liver. Representative histograms obtained by FCM analysis (C) of mean fluorescence intensity (MFI) of Foxp3 expression in Treg cells (D). (E) The absolute number of Treg cells in the spleen, lymph nodes or liver from AQP4 WT and KO mice. Data represent means ± SD of 8 mice from two independent experiments. #P < 0.05, ##P < 0.01, ###P < 0.001 vs. AQP4 WT-0 W; $P < 0.05, $$P < 0.01, $$$P < 0.001 vs. AQP4 KO-0 W; *P < 0.05, **P < 0.01, ***P < 0.001 Treg cells from AQP4 KO mice vs. from AQP4 WT mice at 0, 3, 5, 8 weeks post-infection.
Figure 7
Figure 7
CD4 + T cells from AQP4 KO mice display higher Th2 but lower Treg cells induction upon SEA stimulation in vitro . 8 weeks older AQP4 WT or KO mice were sacrificed, and single cell suspensions of splenocytes were prepared and in vitro stimulated with SEA as described in Materials and Methods for FCM. Cells were gated on the CD3+ population for analysis of proportions of Th2 (A), Th17 (B), and Th1 (C) cells in CD3+ T cells or on CD3+CD4+ population for analysis of proportion of Treg cells (D) in CD3+CD4+ T cells. FCM analyses were from one representative experiment. Results are expressed as mean ± SD of 24 mice from 3 independent experiments. *P < 0.05; **P < 0.01; ***P < 0.001.
Figure 8
Figure 8
AQP4 KO mice show higher IgG1 but lower IgG2a levels after S. japonicum infection . At 0, 3, 5, 8 weeks post-infection, four AQP4 WT or KO mice were sacrificed and the serum samples were collected for standard ELISA using the SWA and SEA as the coated antigen. (A) The kinetics of the level of total IgG in the serum from AQP4 WT or KO mouse. SEA and SWA specific IgG2a (B) and IgG1 (C) antibodies in serum from S. japonicum infected AQP4 WT and KO mice were detected by ELISA. Results are expressed as mean ± SD of 8 mice from two independent experiments. #P < 0.05, ##P < 0.01, ###P < 0.001 vs. AQP4 WT-0 W; $P < 0.05, $$P < 0.01, $$$P < 0.001 vs. AQP4 KO-0 W; *P < 0.05, **P < 0.01, ***P < 0.001 total IgG, IgG1 and IgG2a cells from AQP4 KO mice vs. from AQP4 WT mice at 0, 3, 5, 8 weeks post-infection.

References

    1. Gryseels B, Polman K, Clerinx J, Kestens L. Human schistosomiasis. Lancet. 2006;368:1106–18. doi: 10.1016/S0140-6736(06)69440-3. - DOI - PubMed
    1. Li XX, Zhou XN. Co-infection of tuberculosis and parasitic diseases in humans: a systematic review. Parasit Vectors. 2013;6:79. doi: 10.1186/1756-3305-6-79. - DOI - PMC - PubMed
    1. Pearce EJ, MacDonald AS. The immunobiology of schistosomiasis. Nat Rev Immunol. 2002;2:499–511. doi: 10.1038/nri843. - DOI - PubMed
    1. Wilson MS, Mentink-Kane MM, Pesce JT, Ramalingam TR, Thompson R, Wynn TA. Immunopathology of schistosomiasis. Immunol Cell Biol. 2007;85:148–54. doi: 10.1038/sj.icb.7100014. - DOI - PMC - PubMed
    1. Hams E, Aviello G, Fallon PG. The schistosoma granuloma: friend or foe? Front Immunol. 2013;4:89. doi: 10.3389/fimmu.2013.00089. - DOI - PMC - PubMed

Publication types

LinkOut - more resources