. 2015 Feb 20;6(5):2843-55.
doi: 10.18632/oncotarget.3066.

MicroRNA 196B regulates FAS-mediated apoptosis in colorectal cancer cells

Affiliations

MicroRNA 196B regulates FAS-mediated apoptosis in colorectal cancer cells

Ji-Su Mo et al. Oncotarget. .

Abstract

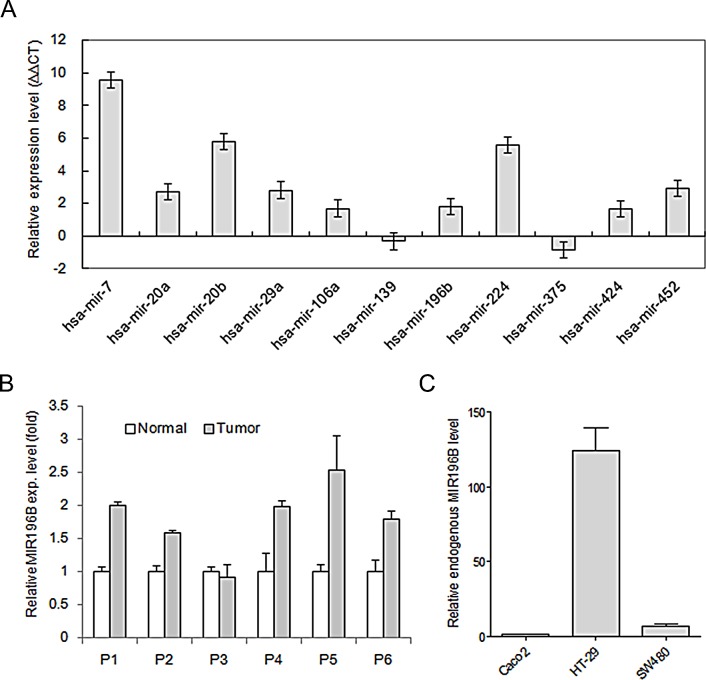
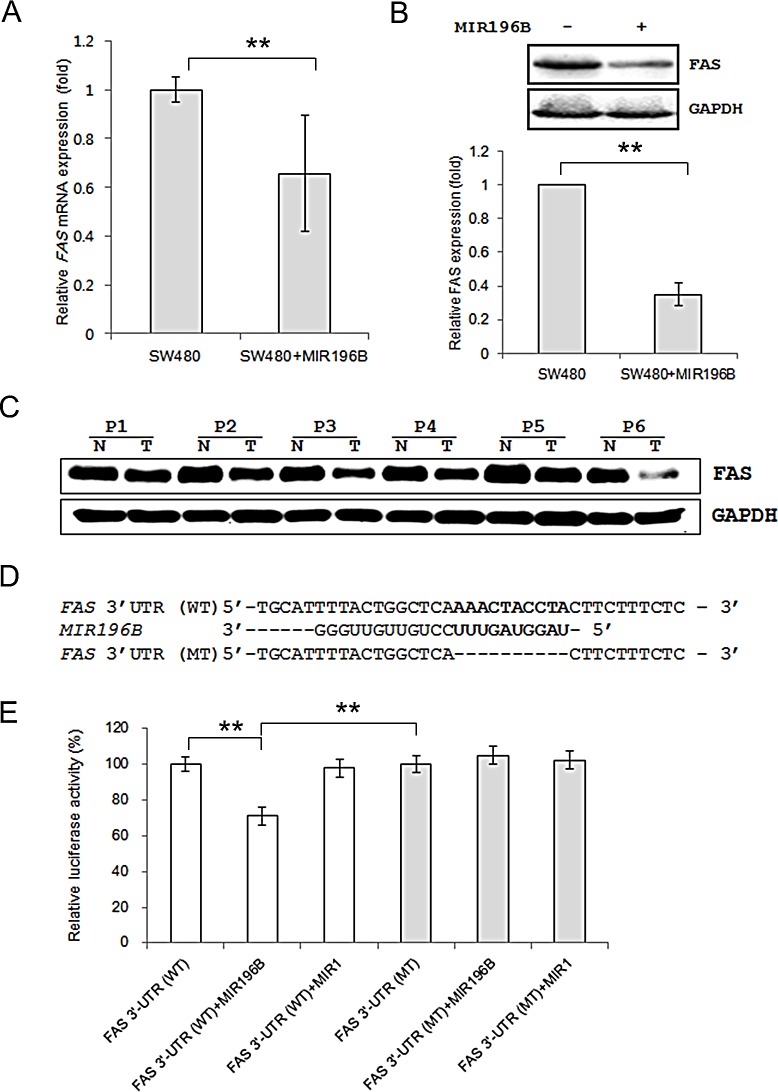
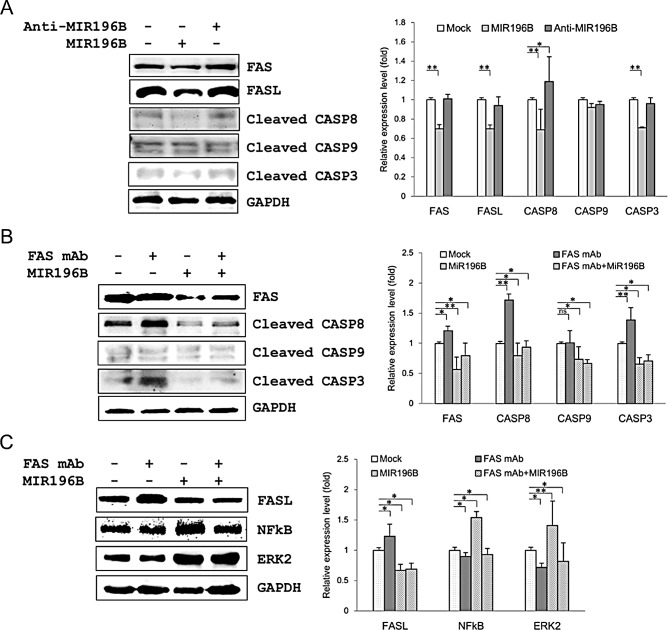
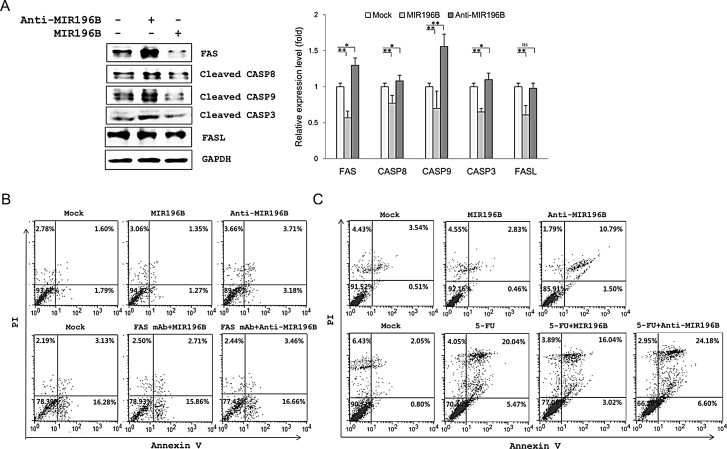
Using miRNA microarray analysis, we identified 31 miRNAs that were significantly up-regulated or down-regulated in colon cancer tissues. We chose MIR196B, which was specifically up-regulated in colon cancer, for further study. We identified 18 putative MIR196B target genes by comparing between the mRNAs down-regulated in MIR196B-overexpressed cells and the assumed MIR196B target genes predicted by public bioinformatics tools. The association between MIR196B and FAS was verified in this study. FAS expression was constitutively elevated in normal human colorectal tissues. However, its expression was often reduced in human colorectal cancer. The decrease in FAS expression could be responsible for the reduction of apoptosis in colorectal cancer cells. In colorectal cancer tissue, we showed that MIR196B up-regulation was mutually followed by down regulation of FAS expression. We also showed that MIR196B directly repressed FAS expression in colorectal cells. Furthermore, anti-MIR196B up-regulated FAS expression and increased apoptosis in colorectal cancer cell lines. Our results suggest that the up-regulation of MIR196B modulates apoptosis in colorectal cancer cells by partially repressing FAS expression and that anti-MIR196B could be a potential candidate as an anti-cancer drug in colorectal cancer therapy.


Conflict of interest statement

Conflict of Interest

The authors have no competing interest to declare

Figures

Figure 1
Figure 1. qRT-PCR analysis of miRNA expression in tissues and cells
(A) The expression of 11 miRNAs was validated using four colon cancer tissue samples and matched normal colon tissue samples. miRNAs levels were normalized with colon specific RNU48. Values are presented as the relative levels (∆∆CT) of the miRNAs in colon cancer tissues. P < 0.01 for all miRNAs by paired t-test. (B) MIR196B expression in 6 pairs of colorectal cancer tissue samples and adjacent normal colorectal tissue samples. Values are presented as the fold-change in tumor tissue relative to normal tissue. P1, P2, P5, and P6 indicate patients with colon cancer. P3 and P4 indicate patients with rectal cancer. P < 0.05 for MIR196B by paired t-test. (C) The relative endogenous MIR196B expression levels in three colorectal cancer cell lines. Values are presented as the fold-change in HT29 or SW480 cells relative to Caco2 cells. P < 0.01 for MIR196B by t-test. Data represent the mean ± S.D. of three independent experiments, each carried out in duplicate.
Figure 2
Figure 2. FAS is a direct target gene of MIR196B
(A) qRT-PCR analysis of FAS expression in SW480 cells. SW480 cells were mock-transfected or transfected with pre-MIR196B. Cells were harvested 48 h after transfection. Total RNA was extracted and used for qRT-PCR. Values are presented as the fold-change in MIR196B-overexpressing cells relative to non-transfected cells. The experiment was performed in duplicate and repeated five times. (B) FAS protein levels in MIR196B-overexpressing cells and non-transfected cells. Protein was extracted 72 h after transfection for western blot analysis. (C) FAS expression in 6 pairs of colon cancer tissue samples and adjacent normal colon tissue samples. All samples are from patients with colon cancer. (D) Sequence alignment of the wild-type (WT) and mutated (MT) MIR196B target site in the 3′-UTR of FAS. A human FAS 3′ UTR containing the wild-type and mutant MIR196B binding sequence was cloned downstream of the luciferase reporter gene. (E) A luciferase reporter plasmid containing the WT or MT FAS 3′ UTR was co-transfected into SW480 cells with pre-MIR1 as a negative control or pre-MIR196B. Luciferase activity was determined using the dual luciferase assay. Results are shown as the relative firefly luciferase activity normalized to Renilla luciferase activity. Data assessed from three independent experiments and the P values were calculated by t-test (* P < 0.05; ** P < 0.01).
Figure 3
Figure 3. MIR196B regulates FAS-mediated apoptosis in SW480 cells
(A) Western blot analyses of FAS, FasL, and FAS-mediated molecules in MIR196B- or anti-MIR196B-transfected SW480 cells. Proteins were extracted 72 h after transfection for western blot analysis. The data shown were normalized to GAPDH levels and are presented as fold-change in MIR196B- or anti-MIR196B-transfected cells relative to mock-transfected cells. The experiment was repeated four times. (B) Western blot analyses of FAS and FAS-mediated molecules in FAS mAb-treated or MIR196B-transfected SW480 cells. (C) Western blot analyses of FasL, NF-κB, and ERK2 in FAS mAb-treated or MIR196B-transfected SW480 cells. Protein was extracted 72 h after MIR196B transfection or FAS mAb treatment or 48 h after MIR196B transfection into cells cultured with FAS mAb for 24 h. The data shown were normalized to GAPDH levels and are presented as the fold-change in MIR196B-transfected or FAS mAb-treated cells relative to mock-treated cells. Data assessed from four independent experiments and the P values were calculated by t-test (* P < 0.05; ** P < 0.01; ns = not significant).
Figure 4
Figure 4. MIR196B regulates FAS-mediated apoptosis in SW480 or HT29 cells
(A) Western blot analyses of FAS, FasL, and FAS-mediated molecules in MIR196B- or anti-MIR196B-transfected HT29 cells. Experiments were repeated four times and the P values were calculated by t-test (* P < 0.05; ** P < 0.01; ns = not significant). (B) Flow cytometry analysis of FAS-mediated apoptosis in MIR196B- or anti-MIR196B-transfected SW480 cells. Cells were cultured in the absence (upper panel) or presence (lower panel) of FAS mAb, stained with annexin V and PI, and analyzed by flow cytometry. The number in each box indicates the percentage of annexin V- and/or PI-positive cells. (C) Flow cytometry analysis of apoptosis in MIR196B- or anti-MIR196B-transfected HT29 cells. Cells were cultured in the absence (upper panel) or presence (lower panel) of 5-FU. Cells were collected 72 h after transfection, stained with annexin V and PI, and analyzed by flow cytometry. The number in each box indicates the percentage of annexin V- and/or PI-positive cells. Experiments were repeated three times with duplicates.

References

    1. Parkin DM, Bray F, Ferlay J, Pisani P. Global cancer statistics, 2002. CA: A Cancer Journal for Clinicians. 2005;55(2):74–108. - PubMed
    1. Swan J, Breen N, Coates RJ, Rimer BK, Lee NC. Progress in cancer screening practices in the United States: results from the 2000 National Health Interview Survey. Cancer. 2003;97:1528–1540. - PubMed
    1. Giovannucci E. Modifiable risk factors for colon cancer. Gastroenterology Clinics of North America. 2002;31(4):925–943. - PubMed
    1. Larsson SC, Orsini N, Wolk A. Diabetes mellitus and risk of colorectal cancer: a meta-analysis. Journal of the National Cancer Institute. 2005;97(22):1679–1687. - PubMed
    1. Itzkowitz SH, Yio X. Inflammation and cancer IV. Colorectal cancer in inflammatory bowel disease: the role of inflammation. American Journal of Physiology - Gastrointestinal and Liver Physiology. 2004;287(1):G7–17. - PubMed

Publication types

MeSH terms