. 2015 Apr;35(7):1182-96.
doi: 10.1128/MCB.00550-14. Epub 2015 Jan 20.

Role of phosphoinositide 3-OH kinase p110β in skeletal myogenesis

Affiliations

Role of phosphoinositide 3-OH kinase p110β in skeletal myogenesis

Ronald W Matheny Jr et al. Mol Cell Biol. 2015 Apr.

Abstract

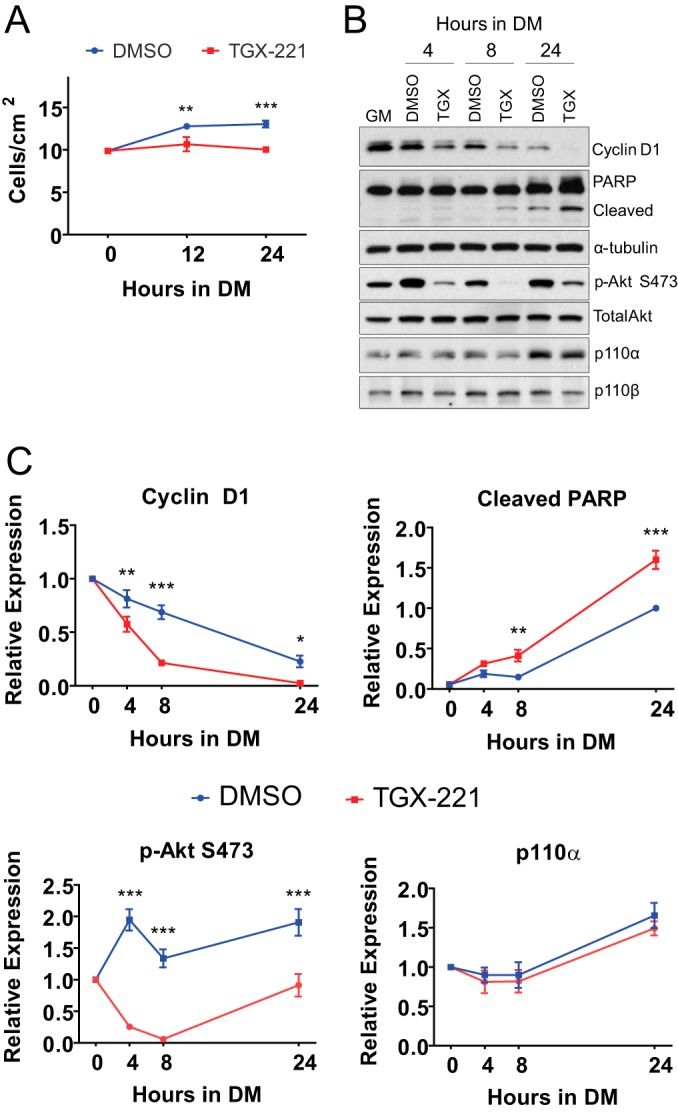
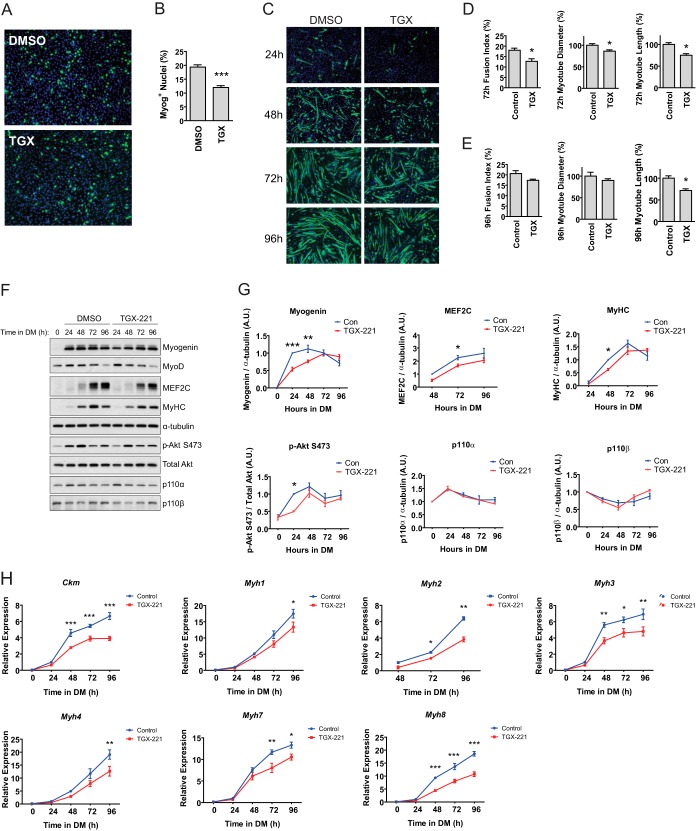
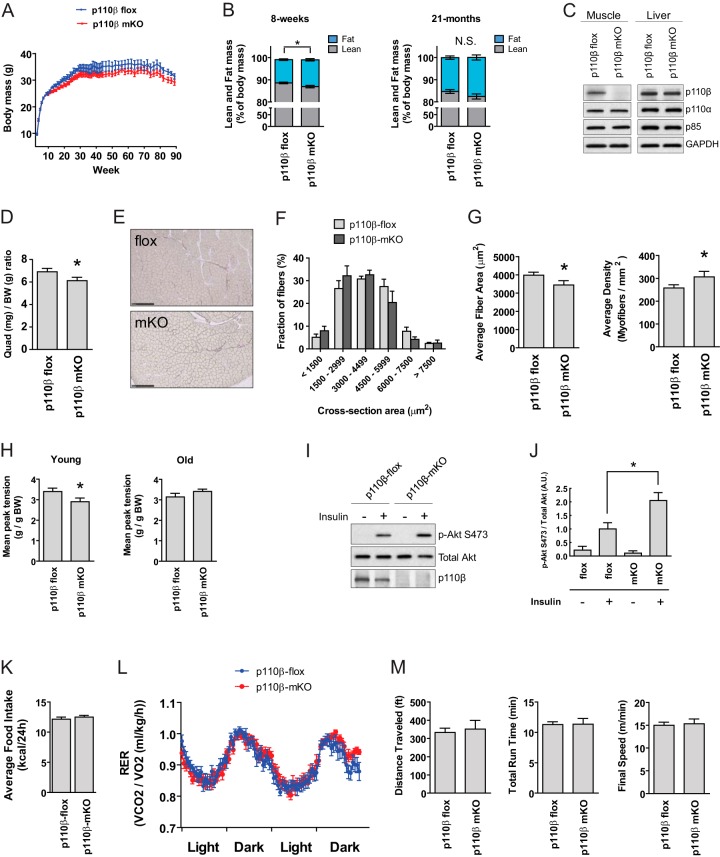
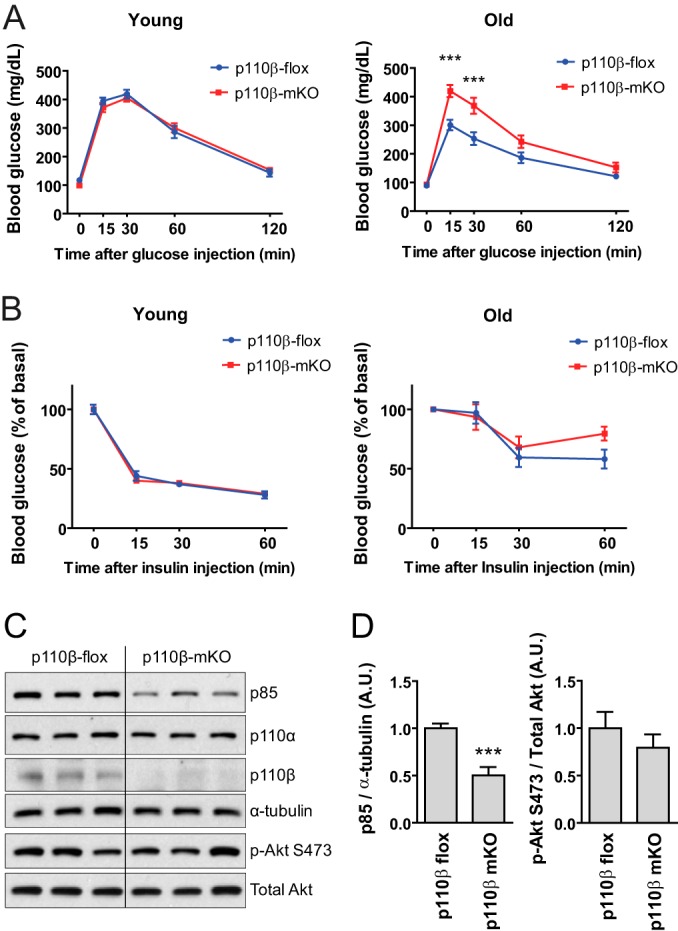
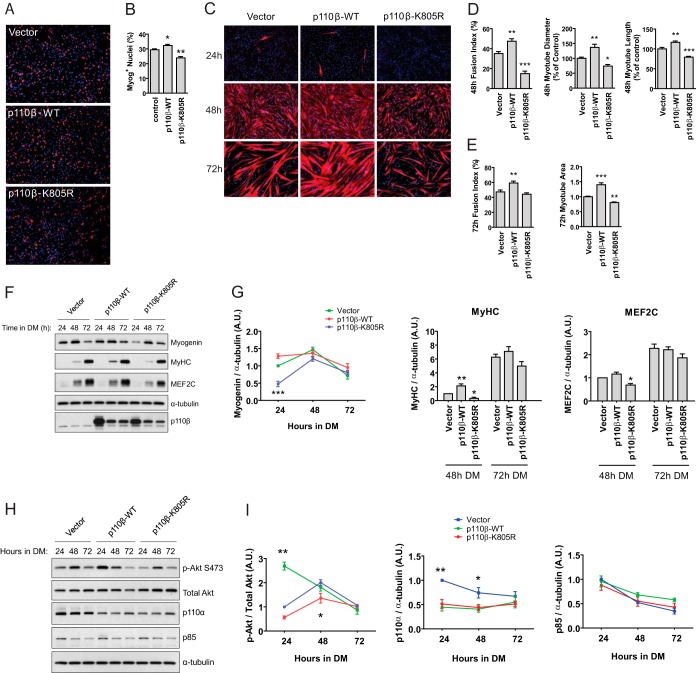
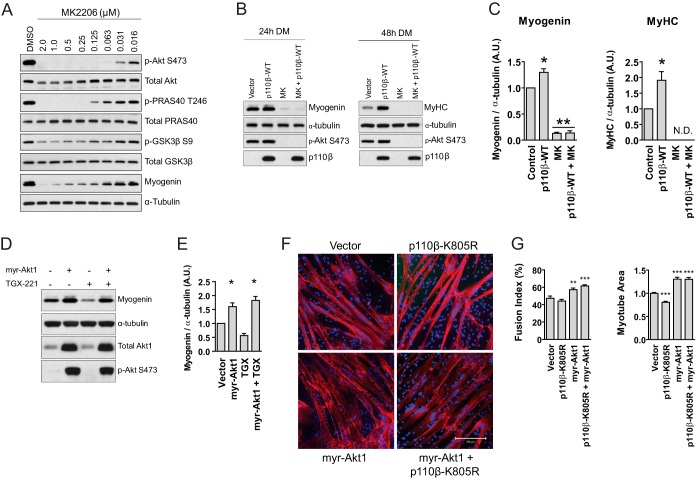
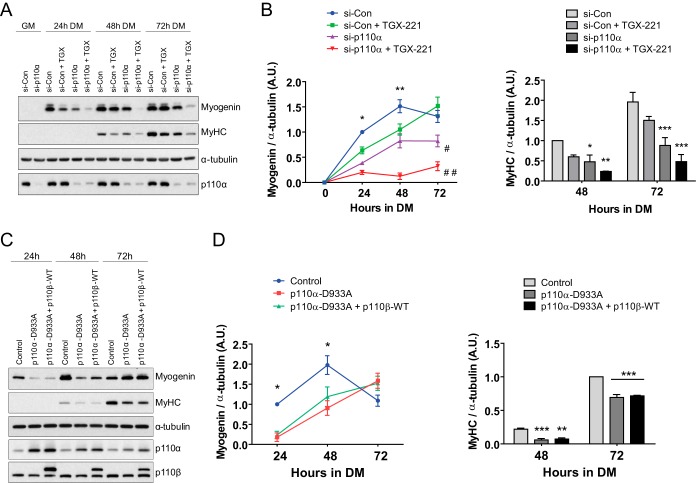
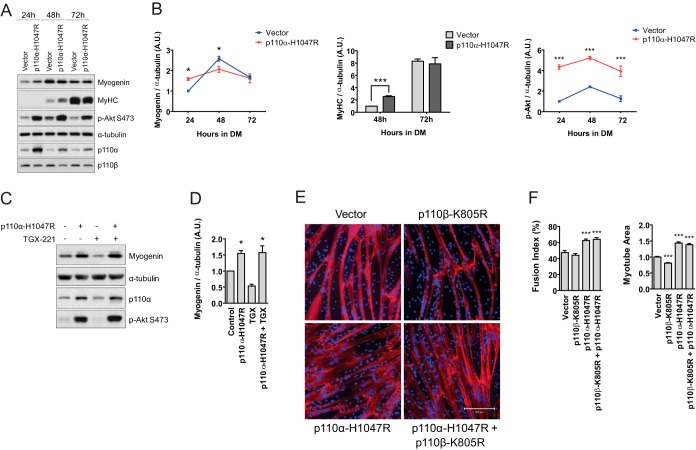
Phosphoinositide 3-OH kinase (PI3K) regulates a number of developmental and physiologic processes in skeletal muscle; however, the contributions of individual PI3K p110 catalytic subunits to these processes are not well-defined. To address this question, we investigated the role of the 110-kDa PI3K catalytic subunit β (p110β) in myogenesis and metabolism. In C2C12 cells, pharmacological inhibition of p110β delayed differentiation. We next generated mice with conditional deletion of p110β in skeletal muscle (p110β muscle knockout [p110β-mKO] mice). While young p110β-mKO mice possessed a lower quadriceps mass and exhibited less strength than control littermates, no differences in muscle mass or strength were observed between genotypes in old mice. However, old p110β-mKO mice were less glucose tolerant than old control mice. Overexpression of p110β accelerated differentiation in C2C12 cells and primary human myoblasts through an Akt-dependent mechanism, while expression of kinase-inactive p110β had the opposite effect. p110β overexpression was unable to promote myoblast differentiation under conditions of p110α inhibition, but expression of p110α was able to promote differentiation under conditions of p110β inhibition. These findings reveal a role for p110β during myogenesis and demonstrate that long-term reduction of skeletal muscle p110β impairs whole-body glucose tolerance without affecting skeletal muscle size or strength in old mice.


Figures

FIG 1
FIG 1
Pharmacological inhibition of p110β inhibits cell proliferation during early differentiation. (A) Numbers of 90% confluent proliferating C2C12 myoblasts in GM harvested either immediately before (0 h) or at 12- or 24-h intervals following treatment with 0.01% DMSO or 1 μM TGX-221 in DM. Each data point represents the mean ± SEM from three independent experiments (**, P < 0.01; ***, P < 0.001). (B) Myoblasts were treated as described in the legend to panel A and harvested following 4, 8, or 24 h of treatment. Western blotting was performed using the antibodies indicated on the right. Blots are representative of those from 3 or 4 independent experiments. (C) Quantification of Western blots from panel B first normalized to the amount of α-tubulin or total Akt (for p-Akt) and then to that of DMSO at 0 h (cyclin D1, p-Akt, p110α) or 24 h (cleaved PARP) (means ± SEMs; n = 3 or 4 independent experiments per time point; *, P < 0.05; **, P < 0.01; ***, P < 0.001).
FIG 2
FIG 2
Pharmacological blockade of p110β delays C2C12 myoblast differentiation. (A) Ninety percent confluent C2C12 myoblasts were treated with 0.01% DMSO or 1 μM TGX-221 (TGX) in DM for 24 h. Cells were then fixed and stained for myogenin (green) and DAPI (blue). Data represent those from three independent experiments. Magnification, ×40. (B) Quantification of myogenin-positive (Myog+) nuclei from the experiment whose results are shown in panel A (means ± SEMs; n = 3 independent experiments; 5 fields were analyzed per experimental point; ***, P < 0.001). (C) Ninety percent confluent myoblasts were treated as described in the legend to panel A and allowed to differentiate for the indicated times before fixation and staining with MyHC (green) and DAPI (blue). Magnification, ×40. (D and E) Fusion index, diameter, and length of myotubes from panel C after 72 h (D) or 96 h (E) in DM (means ± SEMs; n = 3 independent experiments; 5 fields were analyzed per experimental point; *, P < 0.05). (F) Ninety percent confluent proliferating myoblasts were harvested either immediately before (0 h) or at 24-h intervals following treatment with 0.01% DMSO or 1 μM TGX-221 in DM. Western blotting was performed using the antibodies indicated on the right. (G) Quantification of Western blots from panel F normalized to the amount of α-tubulin or total Akt (for p-Akt) (means ± SEMs; n = 3 independent experiments per time point; *, P < 0.05; **, P < 0.01; ***, P < 0.001). A.U., arbitrary units;. (H) Approximately 90% confluent C2C12 myoblasts wereallowed to differentiate for the indicated times before RNA extraction. Real-time PCR was performed using the indicated primers/probes, and the levels of expression were normalized to the level of B2m expression (means ± SEMs; n = 3 independent experiments per time point; *, P < 0.05; **, P < 0.01; ***, P < 0.001).
FIG 3
FIG 3
Genetic ablation of p110β in skeletal muscle reduces muscle size and strength in young mice. (A) Body weights of 3- to 89-week-old mice (n = 9 to 14 per genotype). (B) Fat mass and lean mass of 8-week-old and 21-month-old male mice (means ± SEMs; n = 12 per genotype for 8-week-old mice and n = 8 per genotype for 21-month-old mice; *, P < 0.05; N.S., not significant). (C) Western blots of quadriceps muscle and liver lysates from p110β-flox and p110β-mKO mice. Blots are representative of those for 8 mice per genotype. (D) Quadriceps (Quad) muscle-to-body weight (BW) ratio of age-matched male mice (n = 8 per genotype; *, P < 0.05). (E) Representative cross-section of quadriceps muscle stained with reticulin. (F) Distribution of quadriceps muscle myocyte cross-sectional area for p110β-flox and p110β-mKO mice (means ± SEMs; n = 6 per genotype). (G) Average quadriceps muscle cross-sectional area and myofiber density from the data shown in panel F (means ± SEMs; n = 6 per genotype; *, P < 0.05). (H) Average peak tension from grip strength test normalized to body weight (means ± SEMs; n = 10 per genotype for young [age, ∼8 weeks] mice and n = 9 to 11 per genotype for old [age, ∼20 months] mice; *, P < 0.02). (I) Representative Western blots of quadriceps protein lysates prepared from p110β-flox and p110β-mKO mice treated with saline or insulin for 5 min through inferior vena cava injection. Blots are representative of those from 3 independent experiments. (J) Quantification of p-Akt S473 expression from data shown in panel I (means ± SEMs; n = 3 mice per treatment group; *, P < 0.05). (K) Average food intake over 24 h in 8- to 9-week-old young mice (n = 12 per genotype). (L) Average respiratory exchange ratio (RER; VCO2/VO2) of 8- to 9-week-old p110β-flox and p110β-mKO mice over a 48-h period in metabolic chambers (n = 12 per genotype). (M) Running time, total distance, and final speed during a forced exercise treadmill test in old (age, ∼21.5 months) mice (means ± SEMs; n = 9 per genotype).
FIG 4
FIG 4
Effects of skeletal muscle-specific loss of p110β on metabolism. (A) Following an overnight fast, 8-week-old (Young) or 20.5-month-old (Old) mice were administered 2 g/kg dextrose by intraperitoneal injection. The blood glucose level was determined at the indicated time points (means ± SEMs; n = 8 mice per genotype per age group). (B) Following a 5-h fast, 10-week-old (Young) or 21-month-old (Old) mice were administered 5 U insulin by intraperitoneal injection. Results represent the blood glucose concentration as a percentage of the starting value at the time of injection (time zero) (means ± SEMs; n = 8 mice per genotype per age group). (C) Western blots of lysates of quadriceps muscle from p110β-flox and p110β-mKO mice. (D) Quantification of the blots shown in panel C normalized to the amount of α-tubulin or total Akt, as indicated (means ± SEMs; n = 8 or 9 mice per genotype; ***, P < 0.001).
FIG 5
FIG 5
Overexpression of p110β promotes myogenesis in primary human skeletal myoblasts. (A) Primary human skeletal myoblasts were transduced with the control vector (Vector), wild-type p110β (p110β-WT), or kinase-inactive p110β (p110β-K805R) as described in Materials and Methods. At 24 h following transduction, cells were fixed and stained for myogenin (red) and DAPI (blue). (B) Quantification of myogenin-positive nuclei derived from the experiments whose results are shown in panel A (means ± SEMs; n = 3 independent experiments; 5 fields were analyzed per experimental point; *, P < 0.05; **, P < 0.01). (C) Human skeletal myoblasts were transduced with the indicated constructs and allowed to differentiate for the indicated times before fixation and staining with MyHC (red) and DAPI (blue). Magnification, ×40. (D) Quantification of myotube fusion index, diameter, and length from experiments whose results are shown in panel C after 48 h (means ± SEMs; n = 3 independent experiments; 5 fields were analyzed per experimental point; *, P < 0.05; **, P < 0.01; ***, P < 0.001). (E) Quantification of myotube fusion index and area from experiments whose results are shown in panel C after 72 h of differentiation (means ± SEMs; n = 3 independent experiments; 5 fields were analyzed per experimental point; **, P < 0.01; ***, P < 0.001). (F) Immunoblots for myogenin, MyHC, MEF2C, α-tubulin, and p110β in primary human skeletal myoblasts after 24, 48, or 72 h in DM. (G) Quantification of the blots shown in panel F normalized to the amount of α-tubulin (means ± SEMs; n = 3 independent experiments; *, P < 0.05; **, P < 0.01; ***, P < 0.001). (H) Immunoblots, following 24, 48, or 72 h in DM, for p-Akt S473, total Akt, p110α, p85, and α-tubulin in primary human skeletal myoblasts transduced with the indicated constructs. (I) Quantification of the blots shown in panel H normalized to the amount of total Akt or α-tubulin, as indicated (means ± SEMs; n = 3 independent experiments; *, P < 0.05; **, P < 0.01).
FIG 6
FIG 6
Akt regulates p110β-mediated myoblast differentiation. (A) Ninety percent confluent C2C12 myoblasts were treated with the indicated concentrations of MK2206 or DMSO vehicle (0.01%) in DM and allowed to differentiate for 24 h, followed by Western blotting using the indicated antibodies. (B) Immunoblotting assays were performed on lysates derived from differentiating C2C12 cells expressing the vector control, p110β-WT, or 250 nM MK2206 for 24 or 48 h, as indicated, using the noted antibodies. All treatments received equal quantities of virus or solvent; i.e., cells not exposed to MK2206 (MK) received an equivalent volume of DMSO vehicle, and cells not transduced with p110β-WT were transduced with the vector control. (C) Quantification of the myogenin and MyHC blots shown in panel B normalized to the amount of α-tubulin (means ± SEMs; n = 3 independent experiments per time point; *, P < 0.05; **, P < 0.01; N.D., not detected). (D) C2C12 cells were seeded and transduced with the vector control or myristoylated Akt1 (myr-Akt1) in GM. At 24 h following transduction, GM was switched to DM containing 1 μM TGX-221 or DMSO vehicle, and cells were allowed to differentiate for 24 h. Representative immunoblots for myogenin, α-tubulin, total Akt1, and p-Akt S473 are shown. (E) Quantification of the myogenin blots shown in panel D normalized to the amount of α-tubulin (means ± SEMs; n = 3 independent experiments; *, P < 0.05). (F) Immunocytochemistry of primary human skeletal myoblasts expressing the indicated constructs after 72 h in DM for MyHC (red) and DAPI nuclear stain (blue). Bar = 200 μm. (G) Quantification of fusion index and myotube area for myoblasts from the experiments whose results are shown in panel F (means ± SEMs; n = 3 independent experiments; 5 fields were analyzed per experimental point; **, P < 0.01; ***, P < 0.001).
FIG 7
FIG 7
p110β cannot compensate for p110α during myogenic differentiation. (A) C2C12 myoblasts were reverse transfected with control siRNA (si-Con) or siRNA directed against p110α (si-p110α) and maintained in GM for 24 h. Medium was then switched to DM containing DMSO (si-Con and si-p110α) or 1 μM TGX-221 (si-Con + TGX or si-p110α + TGX) for 24, 48, or 72 h before harvest. Representative Western blots using the antibodies indicated on the right are shown. (B) Quantification of myogenin and MyHC blots shown in panel A normalized to the amount of α-tubulin (means ± SEMs; n = 3 independent experiments per time point; *, P < 0.05; **, P < 0.01; ***, P < 0.001; #, P < 0.01 versus control siRNA at 72 h; ##, P < 0.001 versus control siRNA at 72 h). (C) Primary human skeletal myoblasts were transduced with the control vector (Control), kinase-inactive p110α (p110α-D933A), or kinase-inactive p110α and wild-type p110β (p110α-D933A + p110β-WT) at the time of seeding in DM. All treatments received an equal volume of virus. Protein lysates were harvested at the indicated time points, and Western blotting assays were performed using the indicated antibodies. (D) Quantification of the myogenin and MyHC blots shown in panel C normalized to the amount of α-tubulin (means ± SEMs; n = 3 independent experiments; *, P < 0.05; **, P < 0.01; ***, P < 0.001).
FIG 8
FIG 8
p110α can compensate for p110β inhibition in myoblast differentiation. (A) Immunoblots, following 24, 48, or 72 h in DM, of primary human skeletal myoblasts transduced with either control vector or p110α-H1047R. (B) Quantification of the blots shown in panel A normalized to the amount of α-tubulin (means ± SEMs; n = 3 independent experiments; *, P < 0.05; ***, P < 0.001). (C) C2C12 cells were seeded and transduced in GM with the vector control or p110α-H1047R as described in Materials and Methods. At 24 h following transduction, GM was switched to DM containing 1 μM TGX-221 or DMSO vehicle, and cells were allowed to differentiate for 24 h before harvest. Representative immunoblots for myogenin, α-tubulin, p110α, and p-Akt S473 from three independent experiments are shown. (D) Quantification of the myogenin blots shown in panel C normalized to the amount of α-tubulin (means ± SEMs; n = 3 independent experiments; *, P < 0.05). (E) Immunocytochemistry of primary human skeletal myoblasts expressing the indicated constructs after 72 h in DM for MyHC (red) and DAPI nuclear stain (blue). Bar = 200 μm. (F) Fusion index and myotube area for myotubes from the experiments whose results are shown in panel E (means ± SEMs; n = 3 independent experiments; 5 fields were analyzed per experimental point; ***, P < 0.001).

References

    1. Karalaki M, Fili S, Philippou A, Koutsilieris M. 2009. Muscle regeneration: cellular and molecular events. In Vivo 23:779–796. - PubMed
    1. Kuang S, Rudnicki MA. 2008. The emerging biology of satellite cells and their therapeutic potential. Trends Mol Med 14:82–91. doi:10.1016/j.molmed.2007.12.004. - DOI - PubMed
    1. Schultz E, Gibson MC, Champion T. 1978. Satellite cells are mitotically quiescent in mature mouse muscle: an EM and radioautographic study. J Exp Zool 206:451–456. doi:10.1002/jez.1402060314. - DOI - PubMed
    1. Mauro A. 1961. Satellite cell of skeletal muscle fibers. J Biophys Biochem Cytol 9:493–495. doi:10.1083/jcb.9.2.493. - DOI - PMC - PubMed
    1. Andres V, Walsh K. 1996. Myogenin expression, cell cycle withdrawal, and phenotypic differentiation are temporally separable events that precede cell fusion upon myogenesis. J Cell Biol 132:657–666. doi:10.1083/jcb.132.4.657. - DOI - PMC - PubMed

Publication types

MeSH terms

Substances

LinkOut - more resources