. 2015 Mar 6;290(10):6156-67.
doi: 10.1074/jbc.M114.627109. Epub 2015 Jan 20.

Disruption of a conserved CAP-D3 threonine alters condensin loading on mitotic chromosomes leading to chromosome hypercondensation

Affiliations

Disruption of a conserved CAP-D3 threonine alters condensin loading on mitotic chromosomes leading to chromosome hypercondensation

Muhammed Bakhrebah et al. J Biol Chem. .

Abstract

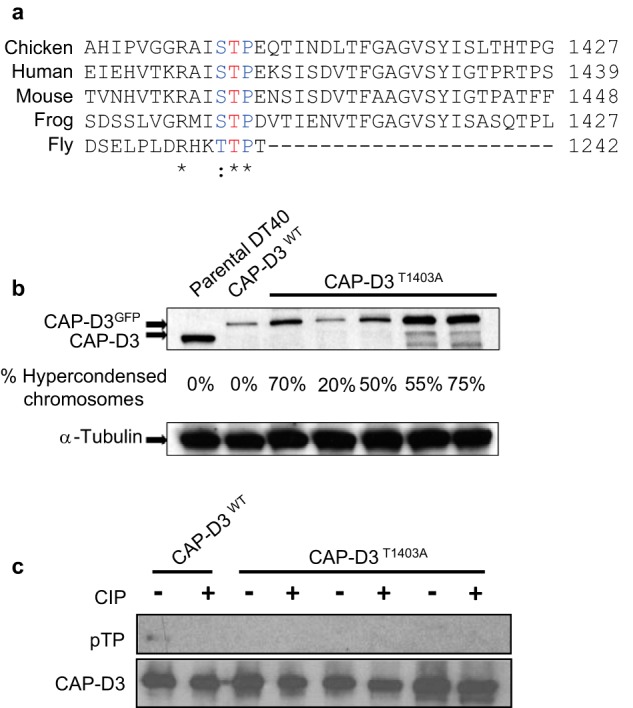
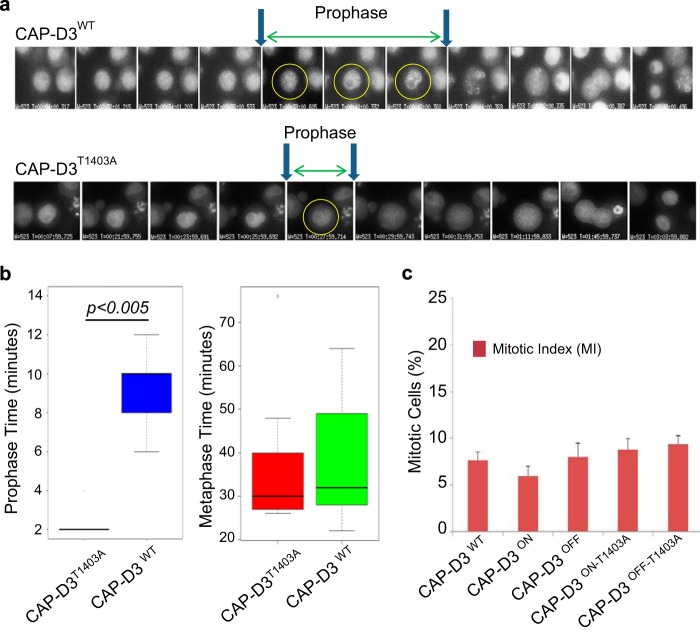
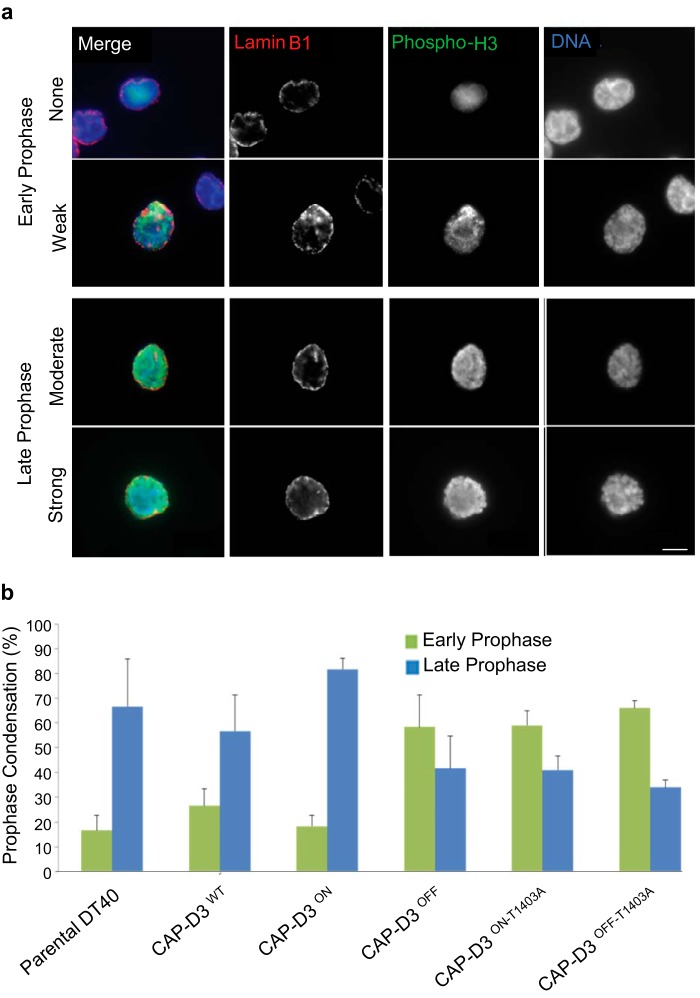
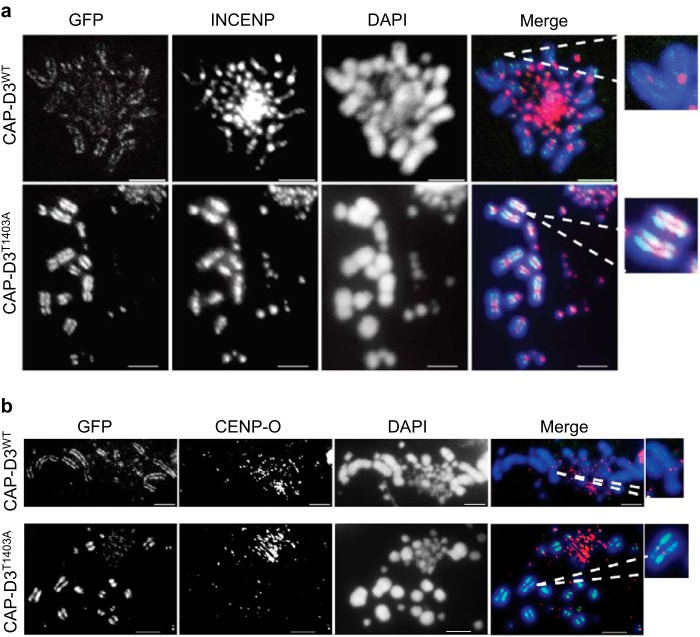
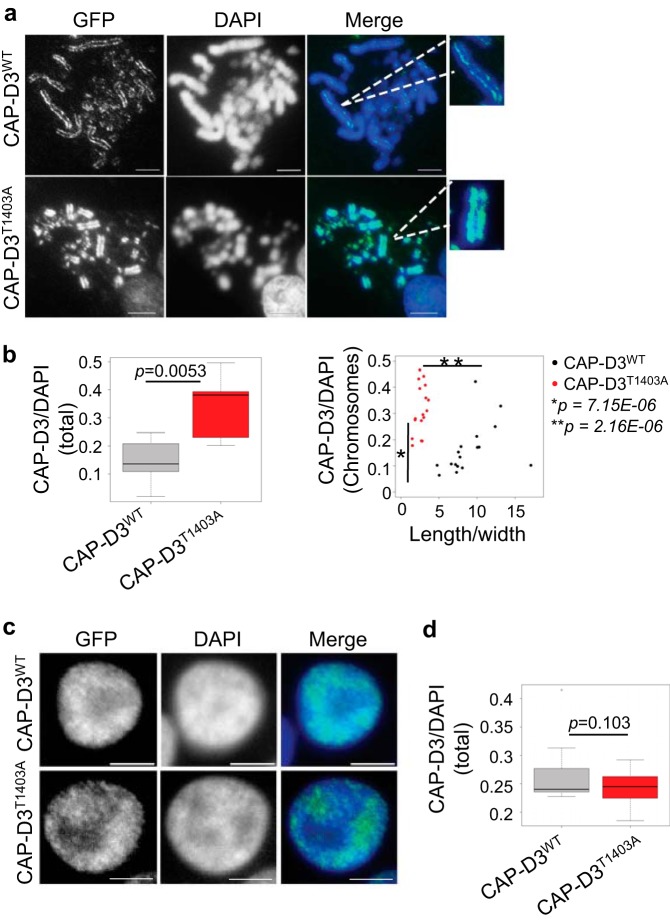
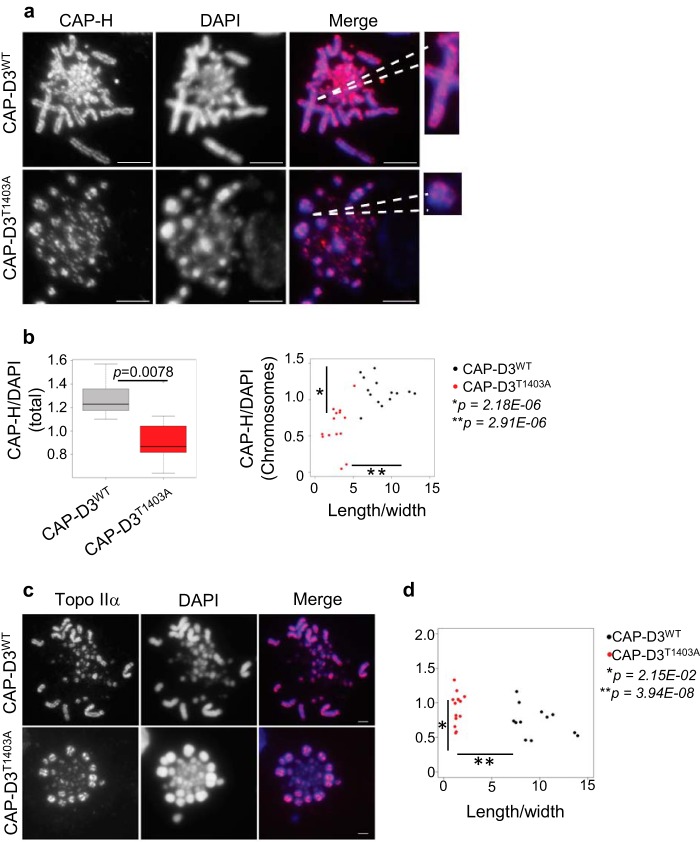
The condensin complex plays a key role in organizing mitotic chromosomes. In vertebrates, there are two condensin complexes that have independent and cooperative roles in folding mitotic chromosomes. In this study, we dissect the role of a putative Cdk1 site on the condensin II subunit CAP-D3 in chicken DT40 cells. This conserved site has been shown to activate condensin II during prophase in human cells, and facilitate further phosphorylation by polo-like kinase I. We examined the functional significance of this phosphorylation mark by mutating the orthologous site of CAP-D3 (CAP-D3(T1403A)) in chicken DT40 cells. We show that this mutation is a gain of function mutant in chicken cells; it disrupts prophase, results in a dramatic shortening of the mitotic chromosome axis, and leads to abnormal INCENP localization. Our results imply phosphorylation of CAP-D3 acts to limit condensin II binding onto mitotic chromosomes. We present the first in vivo example that alters the ratio of condensin I:II on mitotic chromosomes. Our results demonstrate this ratio is a critical determinant in shaping mitotic chromosomes.

Keywords: CdkI, Condensin, Prophase, Mitosis, Chromosome Condensation; Cell Biology; Cell Division; Chromatin Structure; Chromosomes; Mitosis.


Figures

FIGURE 1.
FIGURE 1.
Generation of CAP-D3T1403A chicken DT40 cells. A, conservation of the CAP-D3 Cdk1 site in metazoans. The conserved threonine, is highlighted in red. B, Western analysis of CAP-D3T1403A mutants used in the study along side parental DT40 and CAP-D3WT cells. Note, CAP-D3WT and CAP-D3T1403A were grown in Dox for 48 h extinguishing the untagged CAP-D3 and leaving only the tagged form (hence the band shift between parental and transgenic cell lines). The percentage of hypercondensed chromosomes is listed below for each cell line. C, pulldown analyses show Thr-1403 is a phosphosite in chicken DT40 cells. CAP-D3WT and CAP-D3T1403A cells were pulled down using the SBP tag and analyzed with a specific phosphothreonine-proline (pTP) antibody. Pulldowns were performed in duplicate with calf intestinal phosphatase (CIP) added to one at 37 °C for 30 min. The pTP mouse monoclonal antibody was used first and the blot was reprobed with rabbit anti-CAP-D3 antibody to confirm the specificity of the band and ensure equivalent loading.
FIGURE 2.
FIGURE 2.
Mutation of CAP-D3 T1403A in chicken DT40 results in hypercondensed mitotic chromosomes. A, chromosome phenotypic analysis of chromosome spreads from DT40 parental, CAP-D3WT, CAP-D3 KO (CAP-D3ON/OFF), and CAP-D3T1403A asynchronous cells, in the presence or absence of Dox (at 48 h +Dox for all cell lines, except for CAP-D3 KO cell line at 24 h +Dox due to cell death). A total of five independent CAP-D3T1403A clones were used in the analysis. Representative images of normal, hypercondensed, and wiggly chromosomes are shown on the right. Scale bar represents 5 μm. B, analysis of chromosome bridge defects in WT, CAP-D3 WTGFP, CAP-D3 KO, and CAP-D3T1403A cell lines. Five independent CAP-D3T1403A clones were used for scoring, and 20 anaphases were scored per cell line. Examples of normal and bridged anaphases are depicted on the right. Scale bar represents 5 μm. C, growth curves of CAP-D3 KO, CAP-D3WT, and CAP-D3T1403A cell lines ±Dox for 72 h, with time points taken every 24 h. Three CAP-D3T1403A cell lines were used in the analysis and the plot represents the average division time for each mutant.
FIGURE 3.
FIGURE 3.
Measurements of chromosome length and width in CAP-D3T1403A cells. A, the chromosomal scaffold protein KIF4A was used as a marker to identify and measure the length (axis) of mitotic chromosomes, whereas the width was measured by DNA stained with DAPI. KIF4A staining is shown on the left panels and DAPI on the right panels. For scoring purposes, the largest chromosome (chromosome 1) in each spread was measured for length using KIF4A and width using DAPI for DNA (examples in inset). Scale bar represents 5 μm. B, scatter plot analyzing parental DT40, CAP-D3WT, and CAP-D3T1403A chromosomes from asynchronous cells. To calculate the width and length, the longest chromosome from each spread (chromosome 1) was analyzed and plotted. Mutant and wild type cells were treated with Dox for 48 h. Two representative CAP-D3T1403A clones were used. All cells were fixed with methanol:acetic acid and dropped onto slides before immunostaining with anti-KIF4A. C, merged example of immunofluorescence of CAP-D3WT and CAP-D3T1403A spreads stained with KIF4A (red) and DAPI (blue) for DNA and used for scoring in A.
FIGURE 4.
FIGURE 4.
Live cell imaging and analysis of CAP-D3WT and CAP-D3T1403A. A, examples of CAP-D3WT and CAP-D3T1403A live cell imaging analysis during mitosis. Images were taken every 2 min up to prophase. After prophase, selective images are shown for metaphase, anaphase, telophase, and cytokinesis from the same movies. Note that CAP-D3T1403A cells segregate chromosomes normally. B, quantitation of time in prophase and time from NEBD to anaphase for CAP-D3WT and CAP-D3T1403A. Note the very short prophase of mutant relative to wild type. There is no statistical significance between CAP-D3WT and CAP-D3T1403A for the metaphase to anaphase transition. C, the mitotic index for CAP-D3WT, CAP-D3T1403A, and CAP-D3 KO cells. This was calculated as the percentage of phospho-H3 positive cells from total cells. Our calculation of mitotic index includes anaphase and telophase cells. Five independent CAP-D3T1403A clones were used for the scoring.
FIGURE 5.
FIGURE 5.
Analysis of prophase stages using phospho-H3 staining. a, cells are fixed and stained with anti-phospho-H3 serine 10 (green), lamin B1 (red), and DAPI (blue) for DNA. After NEBD, the nuclear envelope is dispersed, and therefore only cells with intact lamin B1 and positive for phospho-H3 are included. Prophase analysis is divided into early (with no or weak DNA condensation) and late (moderate to strong). Scale bar represents 5 μm. b, quantitation of early and late prophase images from fixed analyses for parental DT40, CAP-D3 KO, CAP-D3WT, and CAP-D3T1403A cells. Five independent CAP-D3T1403A clones were used for the scoring and 20 prophases were scored per cell line.
FIGURE 6.
FIGURE 6.
INCENP staining is abnormal in CAP-D3T1403A cells. A, asynchronous CAP-D3WT and CAP-D3T1403A cells were grown in medium with Dox for 48 h and subjected to a hypotonic treatment, then cytospun and fixed with 4% paraformaldehyde. Cells were stained with anti-INCENP antibody (red), with chromosomes counterstained with DAPI (blue). GFP (green) represents CAP-D3 signal. Representative images are shown. Scale bar is 5 μm. B, asynchronous CAP-D3WT and CAP-D3T1403A cells were grown in medium with Dox for 24 h and subjected to a hypotonic treatment, then cytospun and fixed with 4% paraformaldehyde. Cells were stained with anti-CENP-O antibody (red), with chromosomes counterstained with DAPI (blue). GFP (green) represents CAP-D3 signal. Representative images are shown. Scale bar represents 5 μm.
FIGURE 7.
FIGURE 7.
CAP-D3 is overloaded on CAP-D3T1403A mitotic chromosomes. A, asynchronous CAP-D3WT and CAP-D3T1403A cells were grown in medium with Dox for 48 h and subjected to a hypotonic treatment, then cytospun and fixed with 4% paraformaldehyde with DNA stained with DAPI (blue). Scale bar represents 5 μm. GFP (green) represents CAP-D3 signal. GFP and DAPI intensity were measured as described under ”Experimental Procedures.“ B, box plot are the relative intensity of CAP-D3WT to DAPI of whole cells (p = 0.0053, n = 10). Scatter plot and relative intensity of CAP-D3WT/DAPI of the largest individual chromosomes to the ratio of chromosome length/width (p = 7.15E-06 and 2.16E-08, n = 18). C, asynchronous CAP-D3WT and CAP-D3T1403A cells were grown in medium with Dox for 24 h and subjected to hypotonic treatment, cytospun, fixed with 4% paraformaldehyde, and the DNA stained with DAPI. Scale bar, 5 μm. Interphase cells were selected, GFP and DAPI intensity were measured as described under ”Experimental Procedures.“ D, box plot of the relative intensity of CAP-D3-GFP to DAPI of interphase cells (p = 0.103, n = 10).
FIGURE 8.
FIGURE 8.
CAP-H is reduced on CAP-D3T1403A mitotic chromosomes. A, asynchronous CAP-D3WT and CAP-D3T1403A cells were grown in medium with Dox for 48 h and subjected to a hypotonic treatment, cytospun, and stained with anti-CAP-H antibody (red), with chromosomes counterstained with DAPI (blue), scale bar represents 5 μm. CAP-H and DAPI intensity were measured as described under ”Experimental Procedures.“ B, box plots are the relative intensity of CAP-H to DAPI of whole cells (p = 0.0078, n = 10). Scatter plot and relative intensity of CAP-H/DAPI of the largest individual chromosomes to the ratio of chromosome length/width (p = 2.18E-05 and 2.91E-08, n = 14). C, representative image of Topo IIα binding in mitotic chromosome spreads of asynchronous CAP-D3WT and CAP-D3T1403A cells stained with Topo IIα (red) and DAPI (blue). Scale bar, 5 μm. D, scatter plot of the relative intensity of Topo IIα/DAPI of the largest individual chromosomes to the ratio of chromosome length/width (p = 2.15E-02, p = 3.94E-08, n = 14).

References

    1. Flemming W. (1878) Zur Kenntniss der Zelle und ihrer Theilungs-Erscheinungen. Schriften des Naturwissenschaftlichen Vereins für Schleswig-Holstein 3, 23–27
    1. Belmont A. S. (2006) Mitotic chromosome structure and condensation. Curr. Opin. Cell Biol. 18, 632–638 - PubMed
    1. Moser S. C., Swedlow J. R. (2011) How to be a mitotic chromosome. Chromosome Res. 19, 307–319 - PMC - PubMed
    1. Vagnarelli P. (2012) Mitotic chromosome condensation in vertebrates. Exp. Cell Res. 318, 1435–1441 - PubMed
    1. Kornberg R. D. (1974) Chromatin structure: a repeating unit of histones and DNA. Science 184, 868–871 - PubMed

MeSH terms

LinkOut - more resources