. 2015 Mar 6;290(10):6338-48.
doi: 10.1074/jbc.M114.631788. Epub 2015 Jan 20.

The inhibitor protein (IF1) of the F1F0-ATPase modulates human osteosarcoma cell bioenergetics

Affiliations

The inhibitor protein (IF1) of the F1F0-ATPase modulates human osteosarcoma cell bioenergetics

Simona Barbato et al. J Biol Chem. .

Abstract

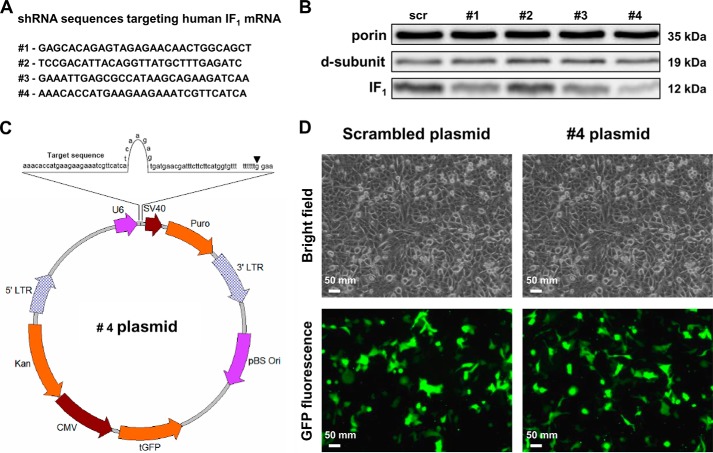
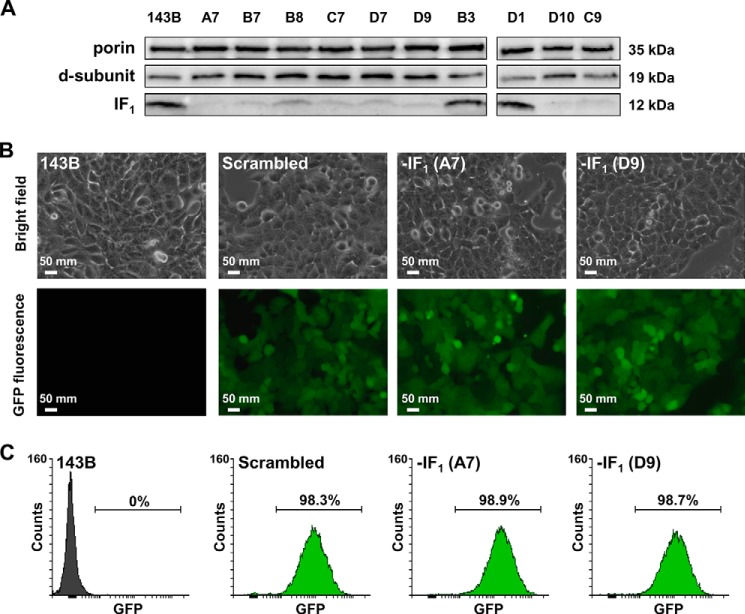
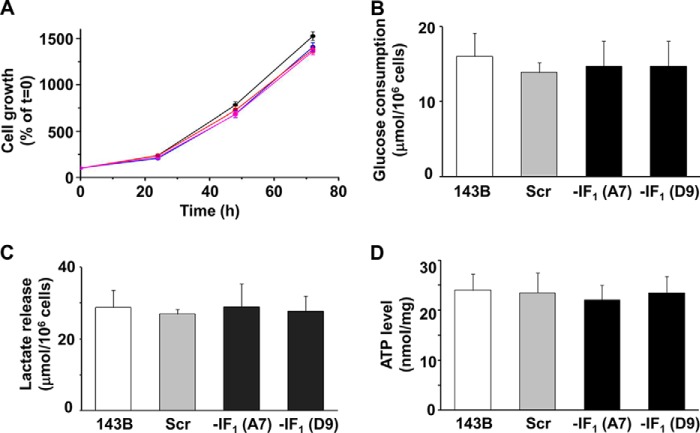
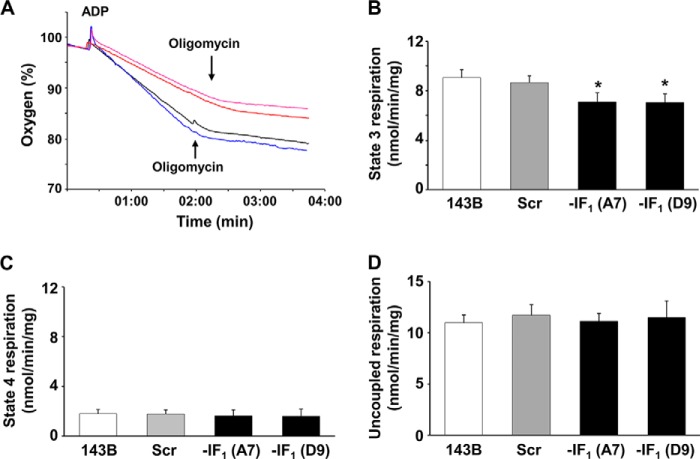
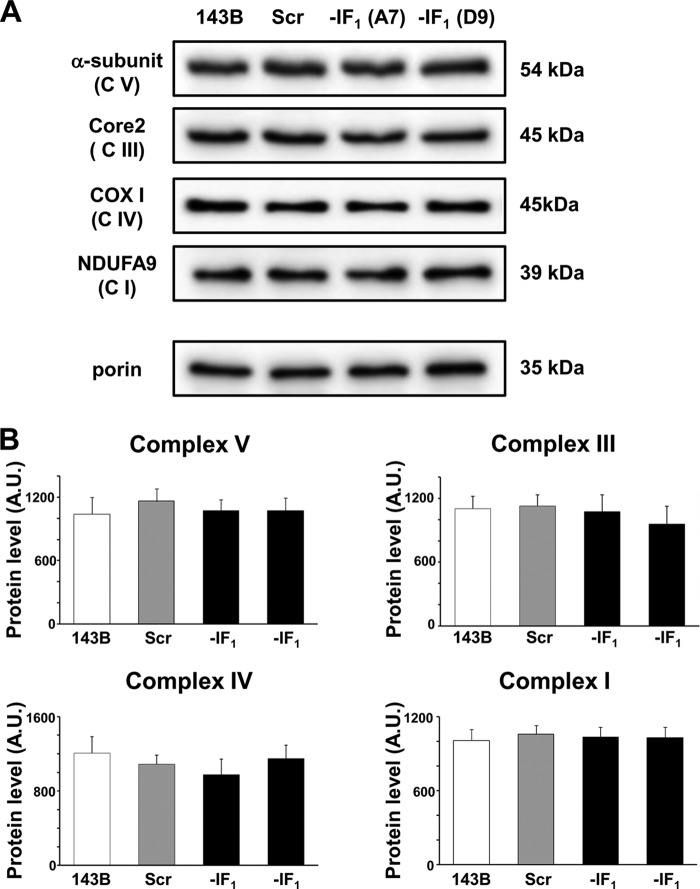
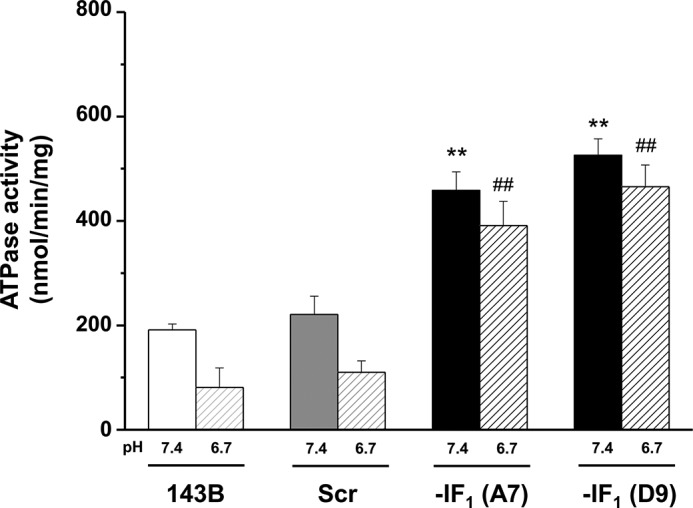
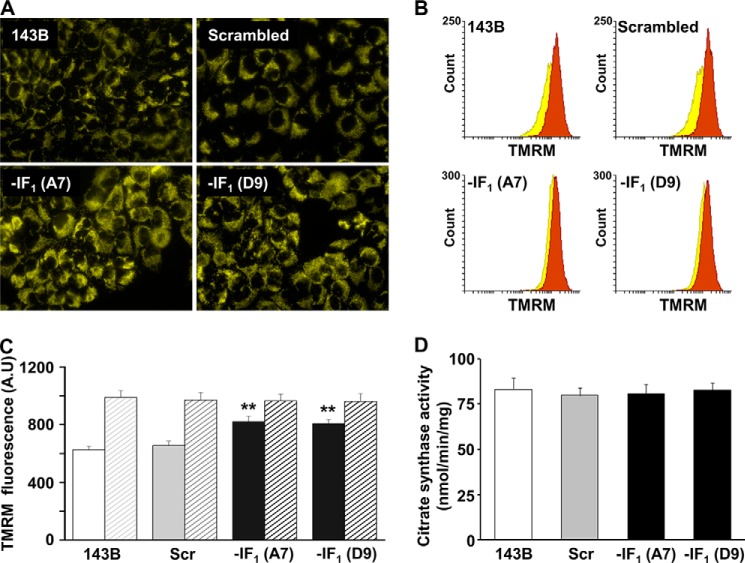
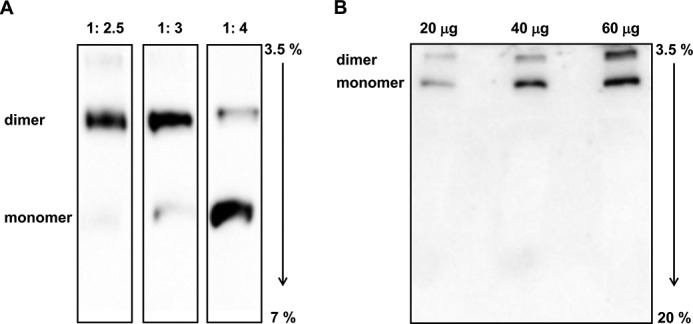
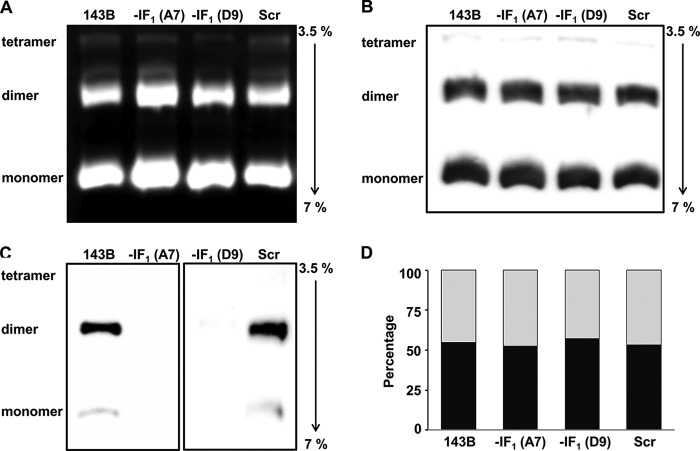
The bioenergetics of IF1 transiently silenced cancer cells has been extensively investigated, but the role of IF1 (the natural inhibitor protein of F1F0-ATPase) in cancer cell metabolism is still uncertain. To shed light on this issue, we established a method to prepare stably IF1-silenced human osteosarcoma clones and explored the bioenergetics of IF1 null cancer cells. We showed that IF1-silenced cells proliferate normally, consume glucose, and release lactate as controls do, and contain a normal steady-state ATP level. However, IF1-silenced cells displayed an enhanced steady-state mitochondrial membrane potential and consistently showed a reduced ADP-stimulated respiration rate. In the parental cells (i.e. control cells containing IF1) the inhibitor protein was found to be associated with the dimeric form of the ATP synthase complex, therefore we propose that the interaction of IF1 with the complex either directly, by increasing the catalytic activity of the enzyme, or indirectly, by improving the structure of mitochondrial cristae, can increase the oxidative phosphorylation rate in osteosarcoma cells grown under normoxic conditions.

Keywords: ATP Synthase; Bioenergetics; Cancer; F1F0-ATPase; IF1; Metabolism; Mitochondria; Oxidative Phosphorylation.


Figures

FIGURE 1.
FIGURE 1.
Silencing of the IF1 inhibitor protein: assessment of the most efficient shRNA sequence. A, nucleotide sequence of the four shRNA constructs, spanning the 3′ end of the IF1 mRNA, cloned in the pGFP-V-RS vector. B, immunoblot analysis of the IF1 protein level of 143B osteosarcoma cells transiently cotransfected with both the IF1 overexpression plasmid and alternatively one of the shRNA (#1–4 plasmids) or scrambled plasmids, as detailed under ”Experimental Procedures.“ C, map of plasmid #4 showing the complete sequence of the construct (target sequence, loop and reverse complementary sequence), cloned under the control of the U6 promoter, and the termination sequence TTTTTT located immediately downstream of the shRNA construct. D, brightfield and fluorescence microscopy images of 143B cells transiently transfected with either the scrambled or the sh-IF1 #4 plasmids (magnification ×10). The pictures are representative of several observations.
FIGURE 2.
FIGURE 2.
Sorting of IF1-silenced clones: silencing efficacy and transfection homogeneity. A, immunoblot analysis of the IF1 protein level in parental (143B cells), scrambled clones (B3 and D1), and IF1-depleted clones (A7, B7, B8, C7, C9, D7, D9, D10). Porin and F1F0-ATPase d-subunit were both used as mitochondrial loading controls. B, brightfield and fluorescence (GFP) microscopy images of 143B cells, scrambled clone B3 and IF1-silenced clones A7 and D9 (magnification ×10). The pictures are representative of several optical fields. C, typical flow cytometry GFP-positive cells distribution in controls and IF1-depleted clones.
FIGURE 3.
FIGURE 3.
IF1 silencing does not change cell growth or metabolic parameters. A, cell growth of human osteosarcoma 143B cell line (black), scrambled (blue), and IF1-silenced clones (red, A7 and magenta, D9). B, glucose consumption and C, lactate release analysis performed in parental, scrambled (Scr), and IF1-silenced cells grown for 24 h. D, ATP levels measured in parental, scrambled, and IF1-silenced cells cultured for 24 h. The ATP content of each sample was normalized to the protein and expressed as nanomole/mg of protein. Bars indicate the mean ± S.D. of three independent experiments.
FIGURE 4.
FIGURE 4.
Mitochondrial respiration changes in IF1-depleted cells. A, typical Complex I-driven oxygen consumption traces obtained in digitonin-permeabilized cells after energizing mitochondria with glutamate/malate, followed by addition of ADP and oligomycin A. Parental (black line), scrambled (blue line), and IF1-depleted cells (red and magenta lines) were represented. State 3 (B), state 4 (C), and uncoupled (D) respiration rate, expressed as nanomole of O2/min/mg of protein, were represented. Histograms show the mean ± S.D. of three independent experiments. *, p < 0.05 indicates the statistical significance of data compared with both parental and scrambled cells.
FIGURE 5.
FIGURE 5.
Immunodetection of OXPHOS complexes after SDS-PAGE separation in parental, scrambled, and IF1-silenced cells. A, typical electrophoretic separation and immunodetection of OXPHOS complex subunits in cell lysates of IF1-silenced cells. B, scanned images were quantitated using Image Lab Software and data were normalized with respect to the porin content, taken as an internal standard. Relative protein levels of OXPHOS subunits were expressed as arbitrary units. The histograms show the mean ± S.D. of two independent experiments.
FIGURE 6.
FIGURE 6.
Oligomycin-sensitive ATP hydrolysis activity in IF1-depleted cells. Oligomycin-sensitive ATP hydrolysis activity measured in mitochondria isolated from controls and IF1-silenced clones. Mitochondria were isolated using different buffers at either pH 7.4 (filled bars) or 6.7 (hashed bars) during the extraction procedure. Histograms showing the mean ± S.D. of three independent experiments. **, p < 0.01 and ##, p < 0.01 indicates the statistical significance of data compared with both parental and scrambled mitochondria isolated at pH 7.4 and 6.7, respectively.
FIGURE 7.
FIGURE 7.
IF1 silencing enhances the mitochondrial membrane potential in human osteosarcoma cells. A, parental, scrambled, and IF1-depleted cells were loaded with 20 nm TMRM and fluorescence images were obtained using an inverted fluorescence microscope (magnification ×40). B, flow cytometry analysis of cellular populations stained with TMRM, in the absence (yellow) or presence (brown) of oligomycin. C, histogram graph showing the flow cytometry semiquantitative evaluation of the mitochondrial membrane potential of controls and IF1-depleted cells in the absence (filled bars) or presence (dashed bars) of oligomycin. Bars show the mean ± S.D. of six independent experiments; **, p < 0.01 indicates the statistical significance of data compared with controls. D, citrate synthase activity expressed as nanomole/min/mg of protein. Bars show the mean ± S.D. of five independent experiments.
FIGURE 8.
FIGURE 8.
BN-PAGE and immunoblotting analysis of IF1-ATP synthase complexes in parental cells. A, representative immunodetection of IF1 bound to the different forms of ATP synthase when different digitonin:protein ratio were used. Immunodetection of IF1 was performed after separation of dimeric and monomeric ATP synthase by BN-PAGE (3.5–7% gradient) followed by blotting onto nitrocellulose membrane. B, typical immunoblotting analysis showing the specificity of IF1 binding to ATP synthase complexes in mitochondria of parental cells. Mitochondria were exposed to 3.5:1 (w/w) digitonin:protein ratio and the extract was applied to a 3.5–20% polyacrylmide gradient gel. Three different protein loading amounts were analyzed.
FIGURE 9.
FIGURE 9.
The inhibitor protein does not affect the dimerization of ATP synthase. A, representative in-gel activity staining of the monomeric and oligomeric ATP synthase forms extracted from digitonin-treated mitochondria of parental, scrambled, and IF1-depleted cells and separated by BN-PAGE. B, monomeric and oligomeric distribution analysis of the ATP synthase performed by immunodetection of the F1 α-subunit after separation of the proteins by BN-PAGE, followed by blotting of the native complexes onto nitrocellulose membrane. C, immunoblot analysis of the IF1 binding to the ATP synthase complexes. The same amount of protein used in panels A and B were loaded. D, histograms represent the densitometric analysis of the monomer (dark bar) and dimer (gray bar) of the ATP synthase complex immunodetected and shown in panel B. The representative data were confirmed in three independent experiments.

References

    1. Hanahan D., Weinberg R. A. (2011) Hallmarks of cancer: the next generation. Cell 144, 646–674 - PubMed
    1. Frezza C., Gottlieb E. (2009) Mitochondria in cancer: not just innocent bystanders. Semin. Cancer Biol. 19, 4–11 - PubMed
    1. Moreno-Sánchez R., Rodríguez-Enríquez S., Marín-Hernández A., Saavedra E. (2007) Energy metabolism in tumor cells. FEBS J. 274, 1393–1418 - PubMed
    1. Sánchez-Cenizo L., Formentini L., Aldea M., Ortega A. D., García-Huerta P., Sánchez-Aragó M., Cuezva J. M. (2010) Up-regulation of the ATPase inhibitory factor 1 (IF1) of the mitochondrial H+-ATP synthase in human tumors mediates the metabolic shift of cancer cells to a Warburg phenotype. J. Biol. Chem. 285, 25308–25313 - PMC - PubMed
    1. Ichikawa N., Ushida S., Kawabata M., Masazumi Y. (1999) Nucleotide sequence of cDNA coding the mitochondrial precursor protein of the ATPase inhibitor from humans. Biosci. Biotechnol. Biochem. 63, 2225–2227 - PubMed

Publication types

MeSH terms