. 2015 Jun;64(6):1976-87.
doi: 10.2337/db14-1257. Epub 2015 Jan 20.

Regulation of glucose tolerance and sympathetic activity by MC4R signaling in the lateral hypothalamus

Affiliations

Regulation of glucose tolerance and sympathetic activity by MC4R signaling in the lateral hypothalamus

Donald A Morgan et al. Diabetes. 2015 Jun.

Abstract

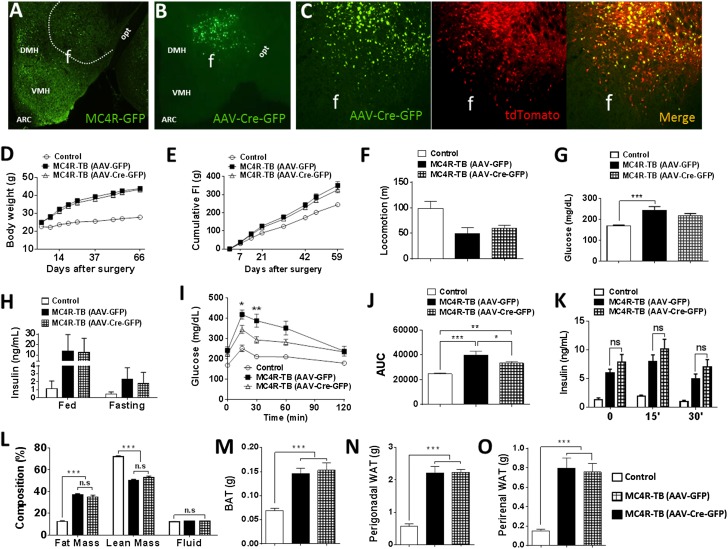
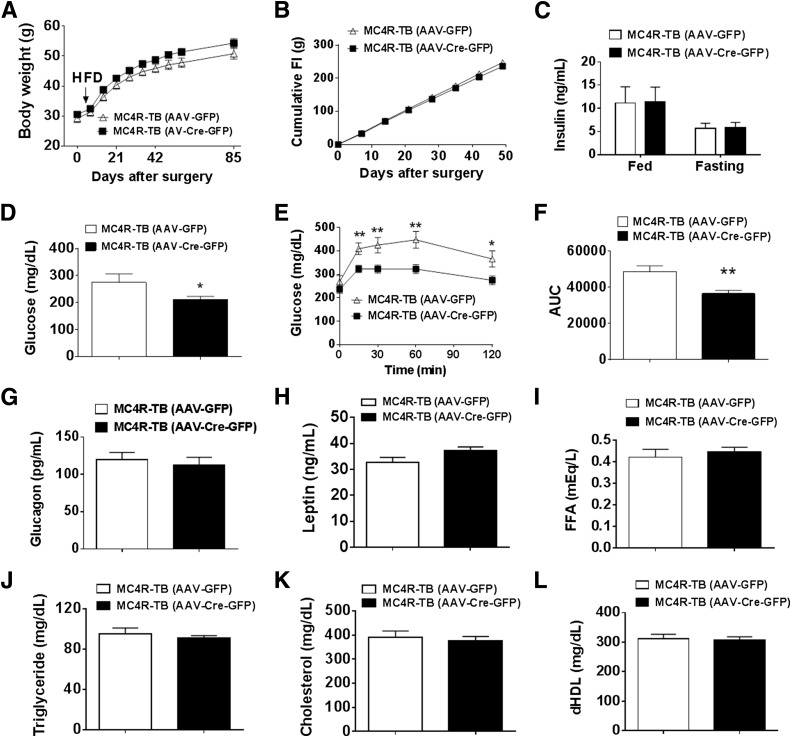
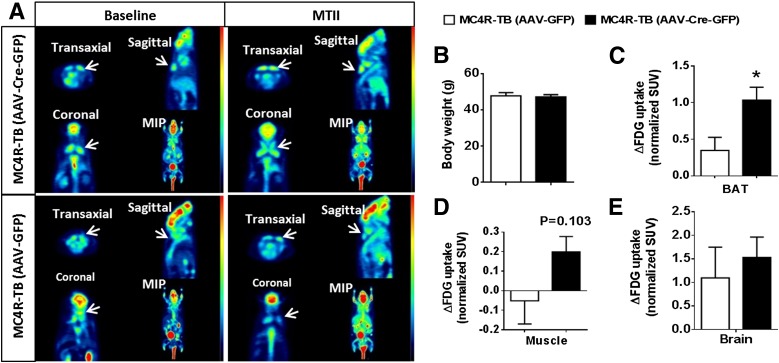
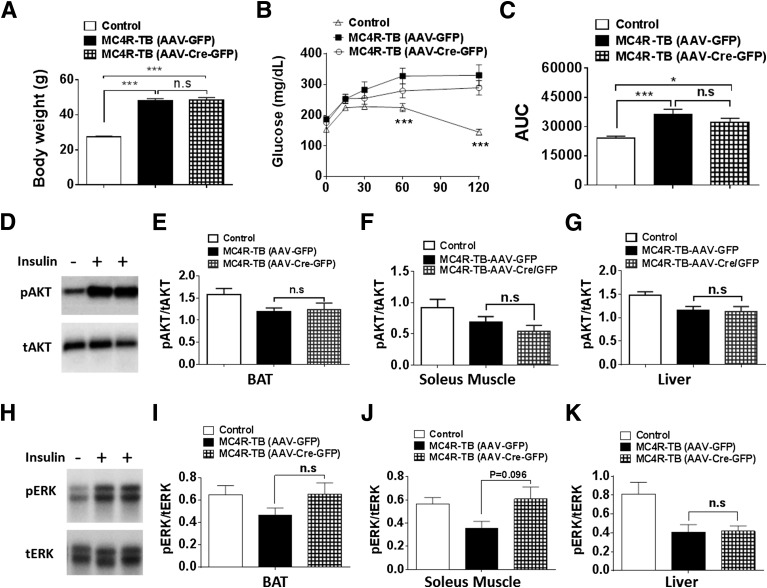
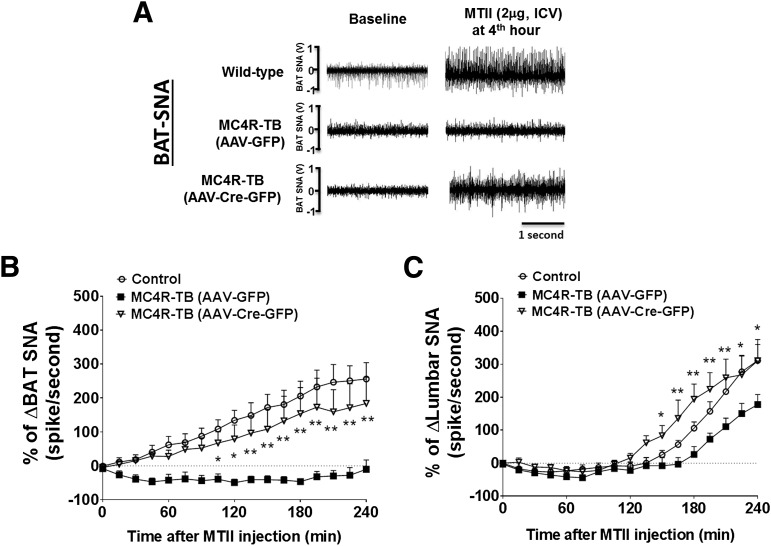
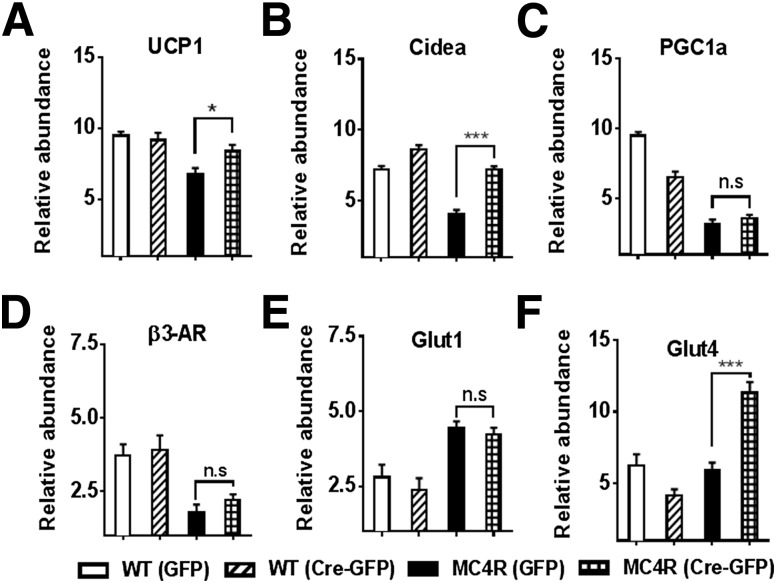
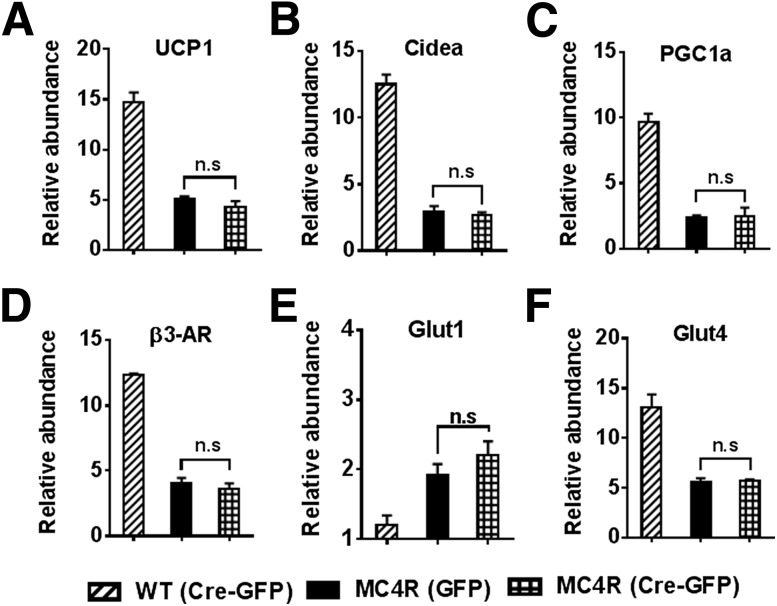
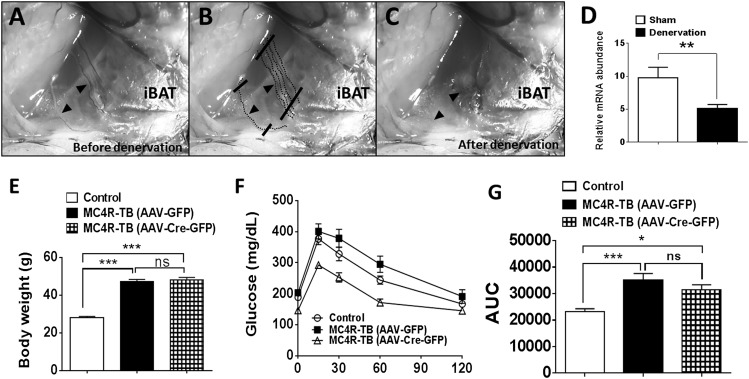
Melanocortin 4 receptor (MC4R) signaling mediates diverse physiological functions, including energy balance, glucose homeostasis, and autonomic activity. Although the lateral hypothalamic area (LHA) is known to express MC4Rs and to receive input from leptin-responsive arcuate proopiomelanocortin neurons, the physiological functions of MC4Rs in the LHA are incompletely understood. We report that MC4R(LHA) signaling regulates glucose tolerance and sympathetic nerve activity. Restoring expression of MC4Rs specifically in the LHA improves glucose intolerance in obese MC4R-null mice without affecting body weight or circulating insulin levels. Fluorodeoxyglucose-mediated tracing of whole-body glucose uptake identifies the interscapular brown adipose tissue (iBAT) as a primary source where glucose uptake is increased in MC4R(LHA) mice. Direct multifiber sympathetic nerve recording further reveals that sympathetic traffic to iBAT is significantly increased in MC4R(LHA) mice, which accompanies a significant elevation of Glut4 expression in iBAT. Finally, bilateral iBAT denervation prevents the glucoregulatory effect of MC4R(LHA) signaling. These results identify a novel role for MC4R(LHA) signaling in the control of sympathetic nerve activity and glucose tolerance independent of energy balance.


Figures

Figure 1
Figure 1
Reactivation of MC4RLHA signaling improves glucose tolerance in chow-fed mice without affecting food intake and body weight. AC: Representative images show the location of MC4R-GFP neurons in the dorsomedial part of LHA (A) where AAV-Cre-GFP microinfusion was made (B); AAV-Cre-GFP was validated in tdTomato reporter mouse by observing Cre-GFP (green) and tdTomato (red) fluorescent signals (C). After stereotaxic delivery of AAV into the LHA of young adult male mice, body weight gain (D), cumulative food intake (E), locomotor activity (F), basal blood glucose (G) and insulin (H) levels, GTT (I) and its AUC analysis (J), insulin secretion response to intraperitoneal glucose (1 g/kg) (K), body composition (L), and the mass of regional fat pads, including BAT (M), perigonadal WAT (N), and perirenal WAT (O), were measured in chow-fed mice. Data are mean ± SEM [for DJ and LO, n = 10, 7, and 12 for control, MC4R-TB (AAV-GFP), and MC4R-TB (AAV-Cre-GFP), respectively; for K, n = 9, 7, and 8 for control, MC4R-TB (AAV-GFP), and MC4R-TB (AAV-Cre-GFP), respectively]. *P < 0.05, **P < 0.01, ***P < 0.001 by one-way or two-way ANOVA with Bonferroni post hoc analysis. ARC, arcuate nucleus of hypothalamus; AUC, area under the curve; DMH, dorsomedial hypothalamic nucleus; f, fornix; FI, food intake; opt, optic tract; VMH, ventromedial hypothalamic nucleus.
Figure 2
Figure 2
Reactivation of MC4RLHA signaling improves hyperglycemia and glucose tolerance in HFD-fed mice without affecting food intake or body weight. After stereotaxic delivery of AAV into the LHA of young adult male MC4R-TB mice, body weight gain (A), cumulative food intake (B), basal blood insulin (C) and glucose (D) levels, GTT (E) and its AUC analysis (F), and blood glucagon (G), leptin (H), FFA (I), triglyceride (J), cholesterol (K), and dHDL (L) levels were measured in HFD-fed mice. Data are mean ± SEM [n = 9 and 17 for MC4R-TB (AAV-GFP) and MC4R-TB (AAV-Cre-GFP), respectively]. *P < 0.05, **P < 0.01 by two-way ANOVA with Bonferroni post hoc analysis or by Student t test. AUC, area under the curve; dHDL, direct HDL; FFA, free fatty acid; FI, food intake.
Figure 3
Figure 3
Restoration of MC4RLHA signaling increases FDG uptake in iBAT. A: Representative images showing FDG uptake in iBAT at baseline and after MTII administration. B: Body weight of each group of mice used in FDG PET/CT scanning. CE: The change of FDG uptake (normalized SUV) by MTII in iBAT (C), muscle (D), and brain (E). Data are mean ± SEM [n = 6 for both MC4R-TB (AAV-GFP) and MC4R-TB (AAV-Cre-GFP)]. *P < 0.05 by Student t test. MIP, maximum intensity projection; SUV, standardized uptake value.
Figure 4
Figure 4
Restoration of MC4RLHA signaling does not affect hepatic gluconeogenesis and peripheral insulin signaling. A: Body weight of each group of mice used in PTT. B and C: PTT (2 g/kg) and its AUC analysis [n = 10, 9, and 11 for control, MC4R-TB (AAV-GFP), and MC4R-TB (AAV-Cre-GFP), respectively]. Representative Western blot image of bolus insulin (5 units)–mediated induction of pAKT (D) and pERK (H) in iBAT of WT mice. EG: Immunoblotting quantification of an induction of pAKT by bolus insulin in iBAT (E), soleus muscle (F), and liver (G) (n = 5–6/group). IK: Immunoblotting quantification of an induction of pERK by bolus insulin in iBAT (I), soleus muscle (J), and liver (K) (n = 7–9/group). Data are mean ± SEM. *P < 0.05, ***P < 0.001 by one-way or two-way ANOVA with Bonferroni post hoc analysis. AUC, area under the curve; tAKT, total AKT; tERK, total ERK.
Figure 5
Figure 5
Reactivation of MC4RLHA signaling normalizes impaired SNA response to MTII in iBAT and muscle of MC4R-null mice. A: Representative images showing iBAT SNA recording at baseline and at the 4th hour of ICV MTII. B: Four-hour time course of MTII-induced changes of iBAT SNA from baseline activity [n = 10, 7, and 7 for control, MC4R-TB (AAV-GFP), and MC4R-TB (AAV-Cre-GFP), respectively]. C: Four-hour time course of MTII-induced changes of lumbar SNA from baseline activity [n = 10, 6, and 6 for control, MC4R-TB (AAV-GFP), and MC4R-TB (AAV-Cre-GFP), respectively]. Data are mean ± SEM. *P < 0.05, **P < 0.01 by two-way ANOVA with Bonferroni post hoc analysis [comparison between MC4R-TB (AAV-GFP) and MC4R-TB (AAV-Cre-GFP) groups].
Figure 6
Figure 6
The effect of restoration of MC4RLHA signaling on iBAT gene expression. Whole iBAT tissues were collected from chow-fed 16–18-week-old male mice (n = 6/group), snap frozen in liquid nitrogen, and processed for total mRNA extraction. Quantitative PCR was performed to determine relative abundance of expression of UCP1 (A), Cidea (B), PGC1a (C), β3-AR (D), Glut1 (E), and Glut4 (F). Data are mean ± SEM. *P < 0.05, ***P < 0.001 by one-way ANOVA with Bonferroni post hoc analysis.
Figure 7
Figure 7
The effect of restoration of MC4RLHA signaling on inguinal WAT gene expression. Whole iBAT tissues were collected from chow-fed 16–18-week-old male mice [n = 6 for each group of WT (AAV-Cre-GFP), MC4R-TB (AAV-GFP), and MC4R-TB (AAV-Cre-GFP) mice], snap frozen in liquid nitrogen, and processed for total mRNA extraction. Quantitative PCR was performed to determine relative abundance of expression of UCP1 (A), Cidea (B), PGC1a (C), β3-AR (D), Glut1 (E), and Glut4 (F). Data are mean ± SEM.
Figure 8
Figure 8
Bilateral iBAT denervation prevents the glucoregulatory effect of MC4RLHA signaling. A: Representative image showing five branches of intercostal nerves (arrows) before denervation. B: Five branches of intercostal nerves were sectioned out as shown. C: Representative image showing postsurgical iBAT denervation. D: iBAT denervation in WT male mice significantly decreased UCP1 mRNA expression in iBAT compared with sham control WT mice. E: Body weight of each group of mice after 1 week of iBAT denervation. F and G: GTT and its AUC analysis after iBAT denervation. Data are mean ± SEM. *P < 0.05, **P < 0.01, ***P < 0.001 by Student t test or one-way ANOVA with Bonferroni post hoc analysis. AUC, area under the curve.

References

    1. Hossain P, Kawar B, El Nahas M. Obesity and diabetes in the developing world—a growing challenge. N Engl J Med 2007;356:213–215 - PubMed
    1. Myers MG Jr, Olson DP. Central nervous system control of metabolism. Nature 2012;491:357–363 - PubMed
    1. Kleinridders A, Könner AC, Brüning JC. CNS-targets in control of energy and glucose homeostasis. Curr Opin Pharmacol 2009;9:794–804 - PubMed
    1. Cone RD. Anatomy and regulation of the central melanocortin system. Nat Neurosci 2005;8:571–578 - PubMed
    1. Vaisse C, Clement K, Durand E, Hercberg S, Guy-Grand B, Froguel P. Melanocortin-4 receptor mutations are a frequent and heterogeneous cause of morbid obesity. J Clin Invest 2000;106:253–262 - PMC - PubMed

Publication types