. 2015 Jun;64(6):2002-14.
doi: 10.2337/db14-0704. Epub 2015 Jan 20.

A novel role for subcutaneous adipose tissue in exercise-induced improvements in glucose homeostasis

Affiliations

A novel role for subcutaneous adipose tissue in exercise-induced improvements in glucose homeostasis

Kristin I Stanford et al. Diabetes. 2015 Jun.

Abstract

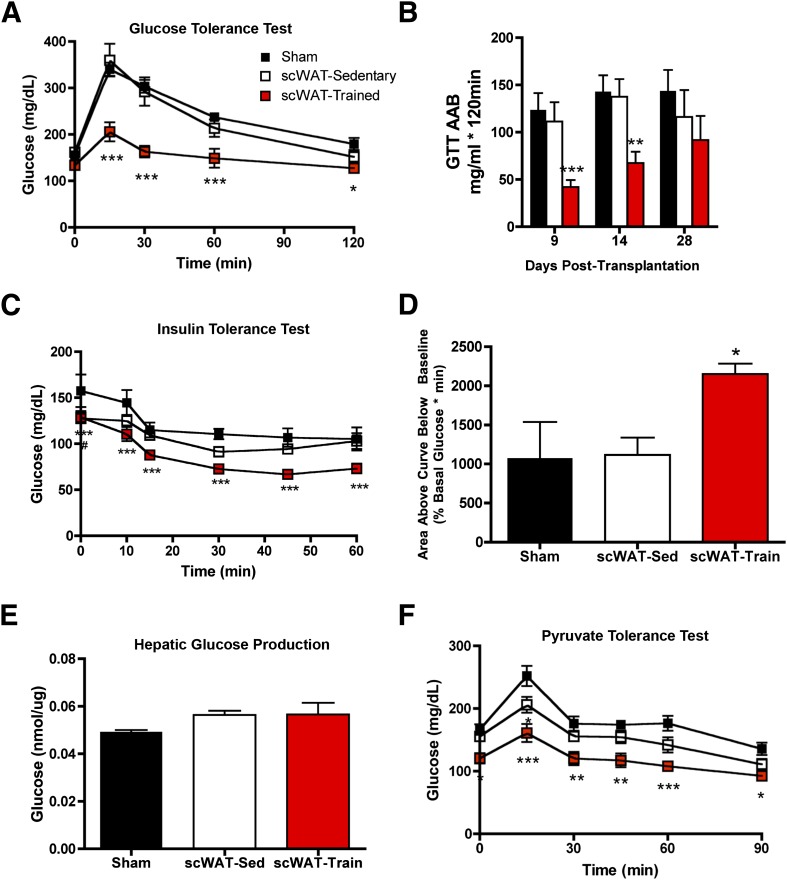
Exercise training improves whole-body glucose homeostasis through effects largely attributed to adaptations in skeletal muscle; however, training also affects other tissues, including adipose tissue. To determine whether exercise-induced adaptations to adipose tissue contribute to training-induced improvements in glucose homeostasis, subcutaneous white adipose tissue (scWAT) from exercise-trained or sedentary donor mice was transplanted into the visceral cavity of sedentary recipients. Remarkably, 9 days post-transplantation, mice receiving scWAT from exercise-trained mice had improved glucose tolerance and enhanced insulin sensitivity compared with mice transplanted with scWAT from sedentary or sham-treated mice. Mice transplanted with scWAT from exercise-trained mice had increased insulin-stimulated glucose uptake in tibialis anterior and soleus muscles and brown adipose tissue, suggesting that the transplanted scWAT exerted endocrine effects. Furthermore, the deleterious effects of high-fat feeding on glucose tolerance and insulin sensitivity were completely reversed if high-fat-fed recipient mice were transplanted with scWAT from exercise-trained mice. In additional experiments, voluntary exercise training by wheel running for only 11 days resulted in profound changes in scWAT, including the increased expression of ∼1,550 genes involved in numerous cellular functions including metabolism. Exercise training causes adaptations to scWAT that elicit metabolic improvements in other tissues, demonstrating a previously unrecognized role for adipose tissue in the beneficial effects of exercise on systemic glucose homeostasis.


Figures

Figure 1
Figure 1
Transplantation of scWAT from trained mice improves glucose tolerance and increases whole-body insulin sensitivity. A and B: Mice were transplanted with 0.85 g scWAT from trained or sedentary mice or were sham operated. For GTTs, mice were injected with 2 g glucose/kg body wt i.p. A: GTT at 9 days post-transplantation. B: Glucose AAB at 9, 14, and 28 days post-transplantation. Data are the mean ± SEM (n = 5–12/group; *P < 0.05; **P < 0.01; ***P < 0.001). For ITTs, mice were injected with 1 unit insulin/kg i.p. and measured at 9 days post-transplantation (C); the area above the curve below the baseline is shown (D). Data are reported as the mean ± SEM (n = 4/group; *P < 0.05; ***P < 0.001; and #P < 0.001 Sedentary scWAT vs. Sham). E: Hepatic glucose production was measured in isolated hepatocytes. Data are reported as the mean ± SEM (n = 6–12/group). For PTTs, mice were injected with pyruvate 2 g/kg body wt i.p. Results of PTTs conducted at 9 days post-transplantation (F) and represented as the AAB (G). Data are the mean ± SEM (n = 5–12/group). H: Liver triglycerides at 9 days post-transplantation. Data are the mean ± SEM (n = 5–12/group; *P < 0.05; **P < 0.01; ***P < 0.001). I and J: Mice were transplanted with 0.85 g scWAT from trained or sedentary mice into the subcutaneous cavity or were sham operated. GTT (I) and glucose AUC (J) are represented as the AAB at 9 days post-transplantation for mice transplanted with 0.85 g scWAT into the subcutaneous cavity. Data are the mean ± SEM (n = 6–8/group). Asterisks represent differences between sham-operated mice and all transplanted groups (*P < 0.05; **P < 0.01). K: GTT results at 9 days post-transplantation for mice receiving 0.85 g scWAT from trained and sedentary 12-week-old mice and sedentary 6-week-old mice. Asterisks represent differences between scWAT from exercise-trained (scWAT-Train) mice and all control groups (*P < 0.05; **P < 0.01; ***P < 0.001; #P < 0.05 compared with mice transplanted with scWAT from sedentary [scWAT-Sed] 6-week-old mice).
Figure 1
Figure 1
Transplantation of scWAT from trained mice improves glucose tolerance and increases whole-body insulin sensitivity. A and B: Mice were transplanted with 0.85 g scWAT from trained or sedentary mice or were sham operated. For GTTs, mice were injected with 2 g glucose/kg body wt i.p. A: GTT at 9 days post-transplantation. B: Glucose AAB at 9, 14, and 28 days post-transplantation. Data are the mean ± SEM (n = 5–12/group; *P < 0.05; **P < 0.01; ***P < 0.001). For ITTs, mice were injected with 1 unit insulin/kg i.p. and measured at 9 days post-transplantation (C); the area above the curve below the baseline is shown (D). Data are reported as the mean ± SEM (n = 4/group; *P < 0.05; ***P < 0.001; and #P < 0.001 Sedentary scWAT vs. Sham). E: Hepatic glucose production was measured in isolated hepatocytes. Data are reported as the mean ± SEM (n = 6–12/group). For PTTs, mice were injected with pyruvate 2 g/kg body wt i.p. Results of PTTs conducted at 9 days post-transplantation (F) and represented as the AAB (G). Data are the mean ± SEM (n = 5–12/group). H: Liver triglycerides at 9 days post-transplantation. Data are the mean ± SEM (n = 5–12/group; *P < 0.05; **P < 0.01; ***P < 0.001). I and J: Mice were transplanted with 0.85 g scWAT from trained or sedentary mice into the subcutaneous cavity or were sham operated. GTT (I) and glucose AUC (J) are represented as the AAB at 9 days post-transplantation for mice transplanted with 0.85 g scWAT into the subcutaneous cavity. Data are the mean ± SEM (n = 6–8/group). Asterisks represent differences between sham-operated mice and all transplanted groups (*P < 0.05; **P < 0.01). K: GTT results at 9 days post-transplantation for mice receiving 0.85 g scWAT from trained and sedentary 12-week-old mice and sedentary 6-week-old mice. Asterisks represent differences between scWAT from exercise-trained (scWAT-Train) mice and all control groups (*P < 0.05; **P < 0.01; ***P < 0.001; #P < 0.05 compared with mice transplanted with scWAT from sedentary [scWAT-Sed] 6-week-old mice).
Figure 2
Figure 2
Transplantation of scWAT increases glucose uptake into skeletal muscle and BAT. A–H: Mice were transplanted with 0.85 g scWAT from sedentary or trained mice or were sham operated and were studied 9 days post-transplantation. Mice were fasted overnight and anesthetized, and [3H]2-deoxyglucose/g body wt was administered via retro-orbital injection in the presence of saline (Basal) or 1 mg/kg body wt glucose (Glucose). Blood glucose (A) and insulin (B) levels were measured, and glucose uptake was measured in tibialis anterior (C), soleus (D), gastrocnemius (E), EDL (F), BAT (G), and heart (H) muscles. Data are reported as the mean ± SEM. Asterisks indicate statistical significance compared with sham-operated mice (n = 6/group; *P < 0.05, **P < 0.01, ***P < 0.001).
Figure 3
Figure 3
Transplantation of scWAT from exercise-trained mice improves glucose tolerance in mice on a high-fat diet. In GTTs, mice were injected with 2 g glucose/kg body wt i.p. A: GTT results at 9 days post-transplantation in mice fed a high-fat diet. The dashed line indicates a representative group of chow-fed, sham-operated mice 9 days post-transplantation. B: Glucose AUC represented as the AAB at 9 days post-transplantation. Data are reported as the mean ± SEM (n = 5/group). Asterisks represent differences between sham-treated high-fat–fed mice and all transplanted groups (*P < 0.05, **P < 0.01; ***P < 0.001).
Figure 4
Figure 4
Exercise training increases the “browning” of scWAT. A–G: Mice were housed in wheel cages for 11 days of exercise training, and scWAT was analyzed. Representative heat map of the 50 genes most significantly increased (A) and decreased (B) by 11 days of exercise training. Expressions of Prdm16 (C) and Ucp1 (D) mRNA of scWAT from trained mice were increased compared with scWAT from sedentary mice, and Prdm16 expression was increased to the expression level of BAT; immunofluorescence of UCP1 revealed an increased expression in scWAT from trained mice (E); and the OCR was significantly increased in scWAT from trained mice (F) compared with scWAT from sedentary mice (n = 7/group; *P < 0.05, **P < 0.01, ***P < 0.001). G: H-E staining revealed the presence of multilocular droplets in the scWAT from trained mice (black arrows indicate the presence of multilocular droplets; open arrows indicate blood vessels). A.U., arbitrary units; Sed, sedentary mice; Train, trained mice.
Figure 4
Figure 4
Exercise training increases the “browning” of scWAT. A–G: Mice were housed in wheel cages for 11 days of exercise training, and scWAT was analyzed. Representative heat map of the 50 genes most significantly increased (A) and decreased (B) by 11 days of exercise training. Expressions of Prdm16 (C) and Ucp1 (D) mRNA of scWAT from trained mice were increased compared with scWAT from sedentary mice, and Prdm16 expression was increased to the expression level of BAT; immunofluorescence of UCP1 revealed an increased expression in scWAT from trained mice (E); and the OCR was significantly increased in scWAT from trained mice (F) compared with scWAT from sedentary mice (n = 7/group; *P < 0.05, **P < 0.01, ***P < 0.001). G: H-E staining revealed the presence of multilocular droplets in the scWAT from trained mice (black arrows indicate the presence of multilocular droplets; open arrows indicate blood vessels). A.U., arbitrary units; Sed, sedentary mice; Train, trained mice.
Figure 5
Figure 5
Characteristics of mice transplanted with scWAT. A: H-E stains of transplanted scWAT from sedentary (scWAT-Sed) and trained (scWAT-Train) mice 9 days post-transplantation. Arrows indicate the presence of multilocular droplets. B: Glucose uptake into transplanted scWAT from mice transplanted with 0.85 g scWAT from sedentary or trained mice (n = 6/group). C: At 9 days post-transplantation, awake mice were exposed to a temperature of 4°C, and body temperature was measured. Data are reported as the mean ± SEM (n = 6/group; *P < 0.05 compared with sham-treated controls).

Comment in

References

    1. Colberg SR, Sigal RJ, Fernhall B, et al. .; American College of Sports Medicine; American Diabetes Association . Exercise and type 2 diabetes: the American College of Sports Medicine and the American Diabetes Association: joint position statement executive summary. Diabetes Care 2010;33:2692–2696 - PMC - PubMed
    1. Boström P, Wu J, Jedrychowski MP, et al. . A PGC1-α-dependent myokine that drives brown-fat-like development of white fat and thermogenesis. Nature 2012;481:463–468 - PMC - PubMed
    1. Bonadonna RC, Del Prato S, Saccomani MP, et al. . Transmembrane glucose transport in skeletal muscle of patients with non-insulin-dependent diabetes. J Clin Invest 1993;92:486–494 - PMC - PubMed
    1. Stallknecht B, Vinten J, Ploug T, Galbo H. Increased activities of mitochondrial enzymes in white adipose tissue in trained rats. Am J Physiol 1991;261:E410–E414 - PubMed
    1. Sutherland LN, Bomhof MR, Capozzi LC, Basaraba SA, Wright DC. Exercise and adrenaline increase PGC-1alpha mRNA expression in rat adipose tissue. J Physiol 2009;587:1607–1617 - PMC - PubMed

Publication types