. 2015 Feb 3;112(5):E440-9.
doi: 10.1073/pnas.1423216112. Epub 2015 Jan 20.

Real-time resolution of point mutations that cause phenovariance in mice

Affiliations

Real-time resolution of point mutations that cause phenovariance in mice

Tao Wang et al. Proc Natl Acad Sci U S A. .

Abstract

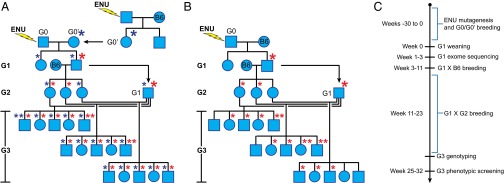
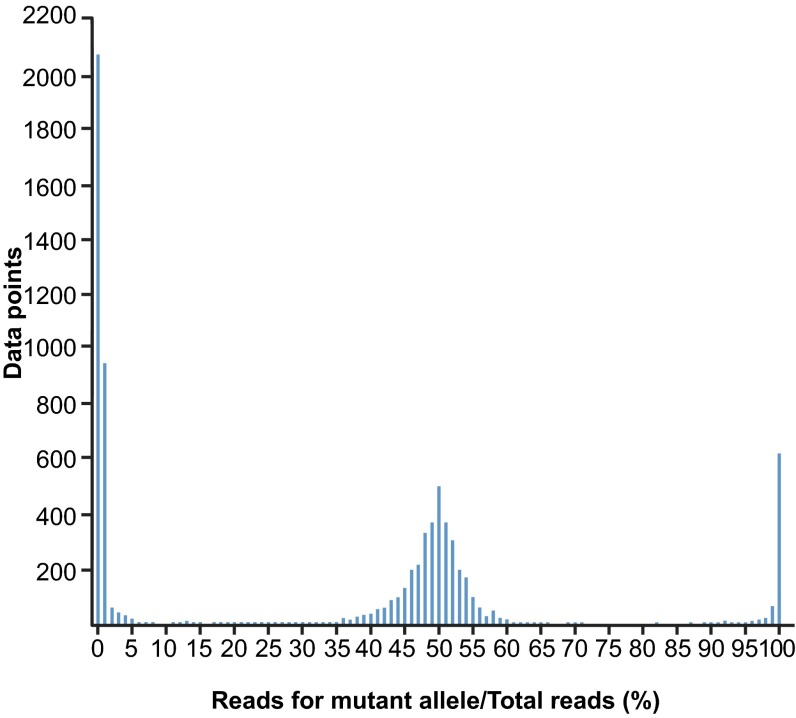
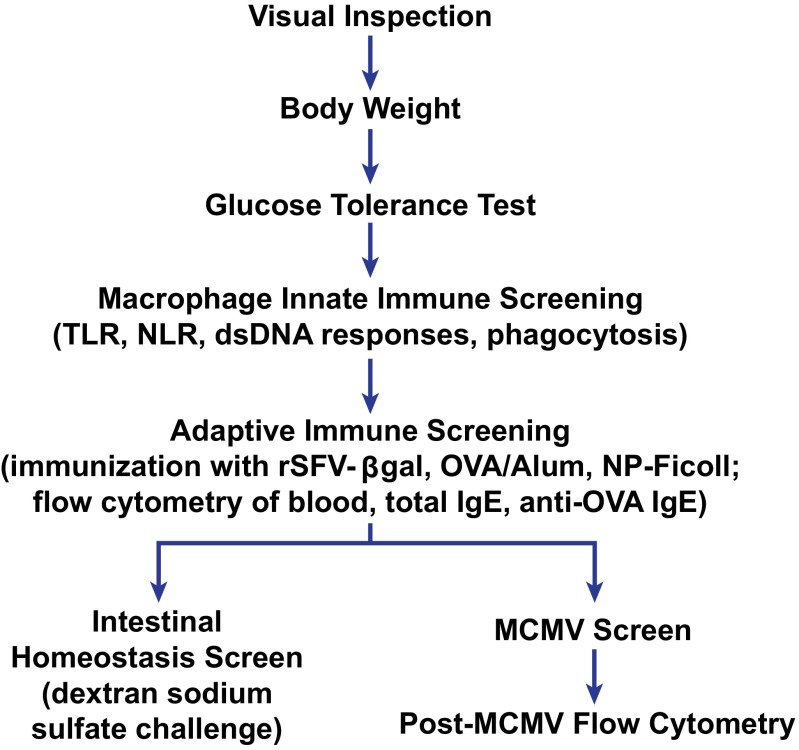
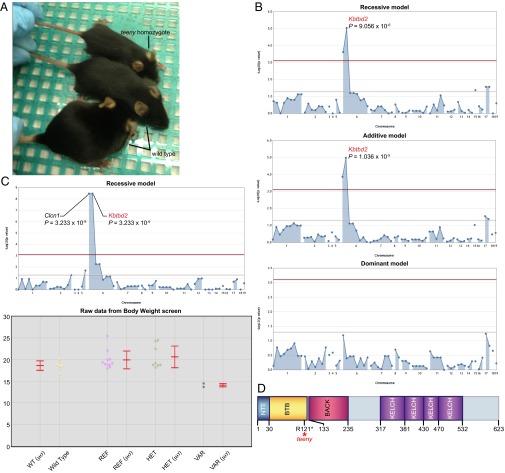
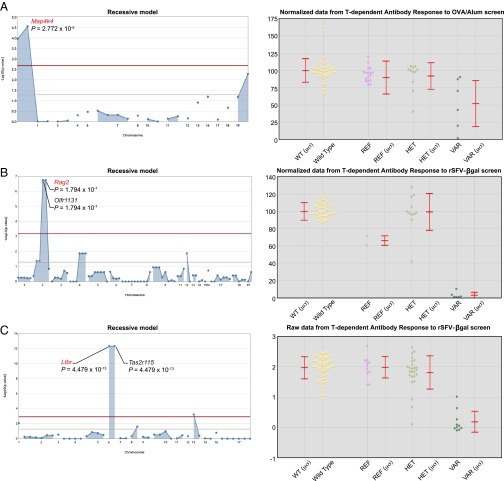
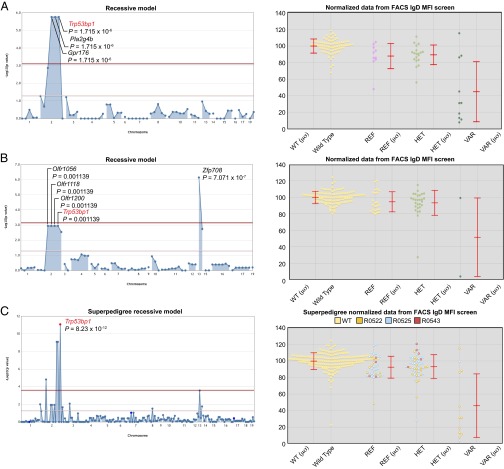
With the wide availability of massively parallel sequencing technologies, genetic mapping has become the rate limiting step in mammalian forward genetics. Here we introduce a method for real-time identification of N-ethyl-N-nitrosourea-induced mutations that cause phenotypes in mice. All mutations are identified by whole exome G1 progenitor sequencing and their zygosity is established in G2/G3 mice before phenotypic assessment. Quantitative and qualitative traits, including lethal effects, in single or multiple combined pedigrees are then analyzed with Linkage Analyzer, a software program that detects significant linkage between individual mutations and aberrant phenotypic scores and presents processed data as Manhattan plots. As multiple alleles of genes are acquired through mutagenesis, pooled "superpedigrees" are created to analyze the effects. Our method is distinguished from conventional forward genetic methods because it permits (1) unbiased declaration of mappable phenotypes, including those that are incompletely penetrant (2), automated identification of causative mutations concurrent with phenotypic screening, without the need to outcross mutant mice to another strain and backcross them, and (3) exclusion of genes not involved in phenotypes of interest. We validated our approach and Linkage Analyzer for the identification of 47 mutations in 45 previously known genes causative for adaptive immune phenotypes; our analysis also implicated 474 genes not previously associated with immune function. The method described here permits forward genetic analysis in mice, limited only by the rates of mutant production and screening.

Keywords: N-ethyl-N-nitrosourea; forward genetics; genetic mapping; massively parallel sequencing; mutagenesis.


Conflict of interest statement

The authors declare no conflict of interest.

Figures

Fig. 1.
Fig. 1.
Inbreeding protocols for generating 30–50 G3 mice with ENU-induced mutations. Mutagenized G0 males are bred to G0′ females carrying germ-line mutations derived from other mutagenized males (A) or to WT C57BL/6J (B6) females (B). G1 males are crossed to B6 females to produce G2 mice. G3 mice result from backcross of G2 females to their G1 father. G3 mice are subjected to screening. Asterisks represent mutations derived from the G0 male (red) and G0′ female (blue); larger asterisks indicate initial germ-line transmission of the mutation. (C) Timeline for G3 mouse production, genotyping, and screening.
Fig. 2.
Fig. 2.
Histogram of genotyping calls for 191 mutations sites in 132 mice from three pedigrees. The percentage of mutant allele reads out of total reads reflects the genotype; for example, 100% mutant allele reads/total reads represents a VAR genotype, i.e., homozygous mutant. Genotyping was performed by deep sequencing of genomic DNA after targeted amplification and yielded essentially REF, HET, and VAR genotypes exclusively; 7,636 data points are represented. Each data point represents one mutation site sequenced in one mouse.
Fig. 3.
Fig. 3.
Phenotypic screening pipeline. The flow of mice through the pipeline has been optimized for efficient use of animals based on the requirements of individual screens, with noninvasive screening preceding invasive screens. Groups of ∼500 G3 mice (15–20 pedigrees) enter the pipeline each week. A total of 9.5 wk are required for a group of mice to pass through all screening procedures. TLR, Toll-like receptor; NLR, NOD-like receptor; dsDNA, double stranded DNA; MCMV, mouse cytomegalovirus.
Fig. 4.
Fig. 4.
Mapping teeny, a phenotype characterized by growth retardation. (A) Homozygous teeny and WT mice. (B and C) Manhattan plots showing P values calculated using the indicated transmission models. The −log10 P values (y axis) are plotted vs. the chromosomal positions of 64 mutations (x axis) identified in the G1 founder of the pedigree. Horizontal red and yellow lines represent thresholds of P = 0.05 with or without Bonferroni correction, respectively. (B) Binary, researcher-specified phenotype data (affected vs. unaffected) were used for linkage analyses (n = 9 affected, 15 unaffected). (C) Quantitative phenotype data (body weight) were used for linkage analysis. Corresponding phenotypic data plotted vs. genotype at the Kbtbd2 mutation site are shown (Lower). Each data point represents one mouse. Mean (μ) and SD (σ) are indicated. (D) Protein domains of mouse Kbtbd2, a member of the BTB (Broad-complex, Tramtrack and Bric à brac)-BACK (BTB and C-terminal kelch)-Kelch family of proteins. The teeny mutation is an arginine to premature stop codon substitution at position 121 of the protein. NTE, N-terminal extension.
Fig. 5.
Fig. 5.
Mapping mutations in three known genes required for T cell-dependent antibody responses. (A–C, Left) Manhattan plots showing P values calculated using a recessive transmission model. The −log10 P values (y axis) are plotted vs. the chromosomal positions of all mutations (x axis) identified in the G1 founder of each pedigree. Causative mutations are shown in red. Horizontal red and yellow lines represent thresholds of P = 0.05 with or without Bonferroni correction, respectively. (Right) Quantitative phenotypic data are plotted vs. genotype at the causative mutation sites. Each data point represents one mouse. Mean (μ) and SD (σ) are indicated.
Fig. 6.
Fig. 6.
A missense mutation of Trp53bp1 is linked to reduced expression of IgD by PBMC. Manhattan plots of (A) lentil (R0522) and (B) chives (R0525) pedigrees individually, along with corresponding phenotypic data plotted vs. genotype at the Trp53bp1 mutation site. (C) Manhattan plot of the superpedigree (R0522, R0525, and R0543) and corresponding phenotypic data plotted vs. genotype at the Trp53bp1 mutation site. Each data point represents one mouse. Mean (μ) and SD (σ) are indicated. MFI, mean fluorescence intensity.

References

    1. Schneeberger K. Using next-generation sequencing to isolate mutant genes from forward genetic screens. Nat Rev Genet. 2014;15(10):662–676. - PubMed
    1. Zhang Z, et al. Massively parallel sequencing identifies the gene Megf8 with ENU-induced mutation causing heterotaxy. Proc Natl Acad Sci USA. 2009;106(9):3219–3224. - PMC - PubMed
    1. Arnold CN, et al. Rapid identification of a disease allele in mouse through whole genome sequencing and bulk segregation analysis. Genetics. 2011;187(3):633–641. - PMC - PubMed
    1. Yabas M, et al. ATP11C is critical for the internalization of phosphatidylserine and differentiation of B lymphocytes. Nat Immunol. 2011;12(5):441–449. - PMC - PubMed
    1. Andrews TD, et al. Massively parallel sequencing of the mouse exome to accurately identify rare, induced mutations: An immediate source for thousands of new mouse models. Open Biol. 2012;2(5):120061. - PMC - PubMed

Publication types

LinkOut - more resources