. 2014 Sep 18;124(12):1857-67.
doi: 10.1182/blood-2014-05-574913.

Platelet bioreactor-on-a-chip

Platelet bioreactor-on-a-chip

Jonathan N Thon et al. Blood. .

Abstract

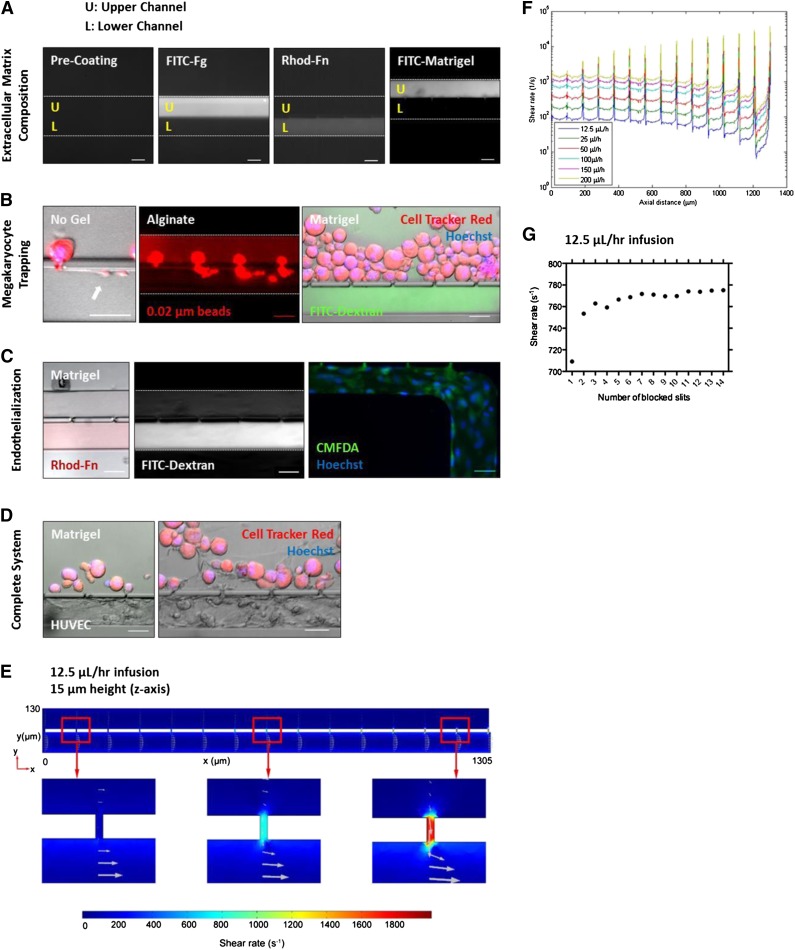
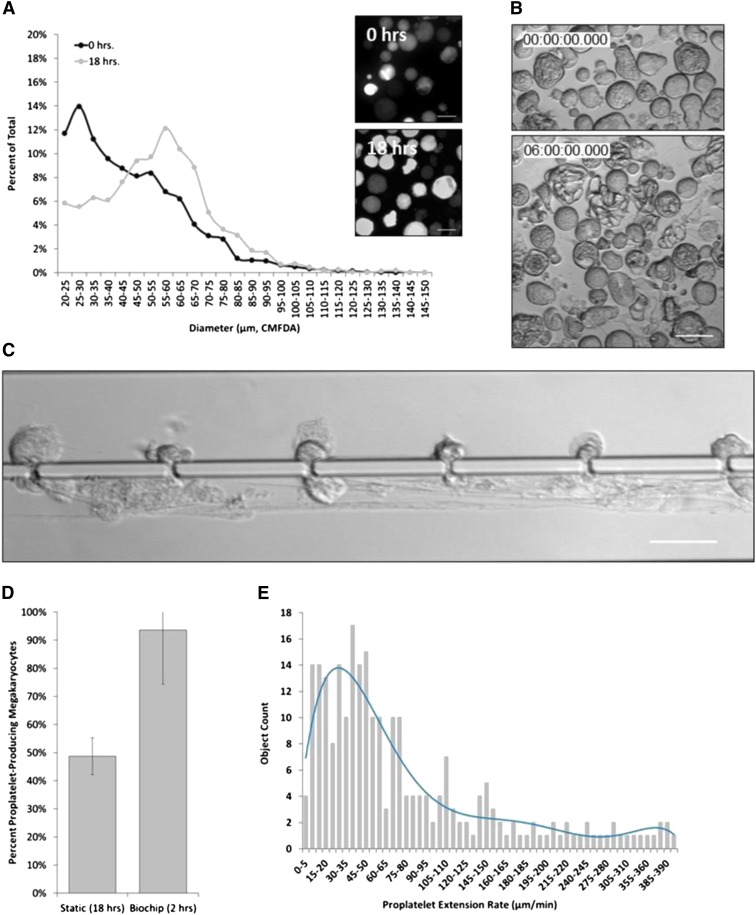
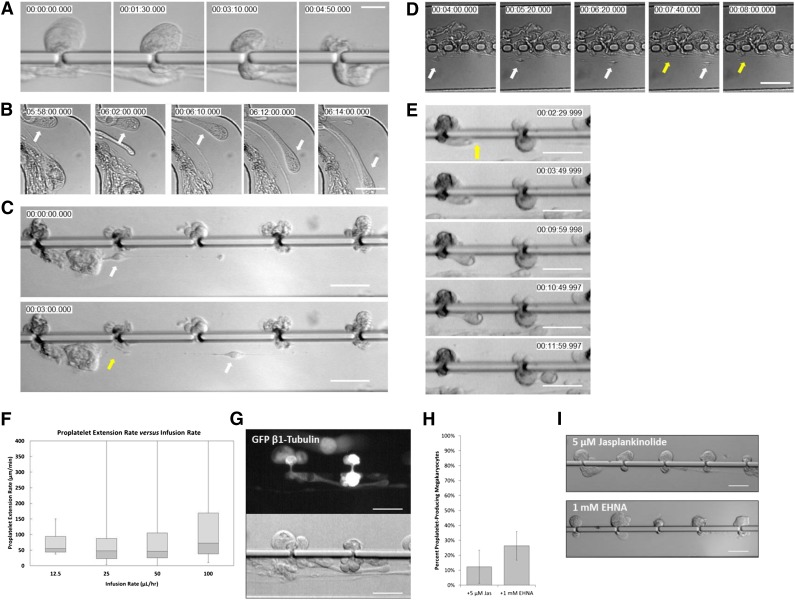
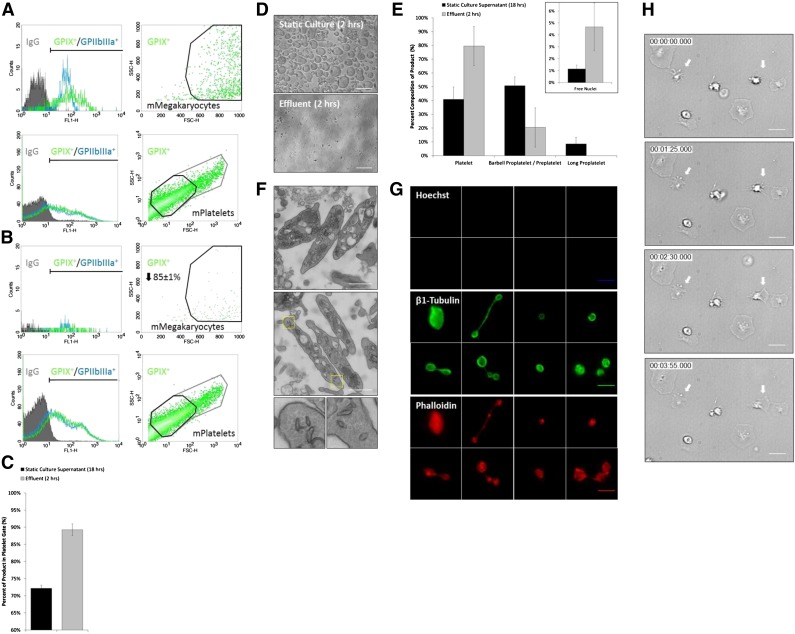
Platelet transfusions total >2.17 million apheresis-equivalent units per year in the United States and are derived entirely from human donors, despite clinically significant immunogenicity, associated risk of sepsis, and inventory shortages due to high demand and 5-day shelf life. To take advantage of known physiological drivers of thrombopoiesis, we have developed a microfluidic human platelet bioreactor that recapitulates bone marrow stiffness, extracellular matrix composition,micro-channel size, hemodynamic vascular shear stress, and endothelial cell contacts, and it supports high-resolution live-cell microscopy and quantification of platelet production. Physiological shear stresses triggered proplatelet initiation, reproduced ex vivo bone marrow proplatelet production, and generated functional platelets. Modeling human bone marrow composition and hemodynamics in vitro obviates risks associated with platelet procurement and storage to help meet growing transfusion needs.


Figures

Figure 1
Figure 1
PLT bioreactor design. (A) PLT bioreactors are based on custom-built polydimethylsiloxane (silicon-based organic polymer) bonded to glass slides, and are comprised of an upper and lower microfluidic channel separated by a series of columns. (B) The 2 µm gaps separate columns to trap MKs entering the upper channel from crossing into the lower channel upon fluid withdrawal from the outlet of the lower channel. (C) Scanning electron micrograph of bioreactor central channels. (D) Scaled bioreactor design showing typical device operation. Scale bars represent 50 µm (B) and 5 µm (C).
Figure 2
Figure 2
PLT bioreactor models major components of BM. Primary mouse MKs are shown. (A) The upper and lower channels can be selectively coated with ECM proteins to reproduce osteoblastic and vascular niche composition. (B) MKs trap at gaps and extend proPLTs into the lower channel (white arrow). MKs can be selectively embedded in alginate or Matrigel gels, modeling three-dimensional ECM organization and physiological BM stiffness (250 Pa). Vascular flow is retained in the lower channel as demonstrated by 0.02 µm fluorescent bead streaking and fluorescein isothiocyanate-dextran fluorescence. (C) HUVECs can be selectively cultured in ECM-coated channels to reproduce blood vessel physiology. (D) MK trapping, BM stiffness, ECM composition, micro-channel size, hemodynamic vascular shear stress, and endothelial cell contacts can be combined to reproduce human BM in vitro. (E) Shear rate distribution along the length of the channel. Arrows indicate the magnitude and direction of the velocity field. (F) Fluid shear rates are well-characterized and can be tightly regulated across the bioreactor as a function of flow rate. (G) Regardless of the number of occupied slits, trapped MKs experience physiological shear stresses at gap junctions. Media viscosity is 1.20 mPa · s. Scale bars represent 50 µm (A-D).
Figure 3
Figure 3
Physiological shear stress induces proPLT production in primary mouse MKs. (A) Primary mouse MKs range between 20 and 85 µm in diameter on culture day 4, and become larger (40-100 µm) if they do not form proPLTs. (B) MKs in static culture begin producing proPLTs at 6 hours postpurification and reach maximal proPLT production at 18 hours. (C) Primary mouse MKs under physiological shear stress (∼600 mPa) begin producing proPLTs immediately upon trapping and extend/release proPLTs within the first 2 hours of culture. (D) Percent proPLT-producing primary mouse MKs under physiological shear stress are increased significantly to ∼90% over static cultures (∼50%). (E) ProPLT extension rates under physiological shear stress are increased significantly (to ∼30 µm/min) over static cultures (0.85 µm/min). Scale bars represent 50 µm (A-C).
Figure 4
Figure 4
Shear stress-mediated proPLT extension is a cytoskeleton-driven process. (A) Approximately 100 µm diameter primary mouse MK squeezing through 2 µm gap. (B) Release of large MK fragment from primary mouse MK into the lower channel resulting in prePLT formation. White arrows indicate proPLT extension. (C) ProPLT extension rates vary at different positions along the shaft, predictive of a regulated cytoskeletal driven process. The hiPSC-derived MKs are shown. White arrows indicate proPLT extension, and yellow arrows indicate site of abscission event. (D) Individual release events (yellow arrow) are routinely captured by high-resolution live-cell microscopy at different positions along the proPLT shaft. White arrow denotes proPLT end. Primary mouse MKs are shown in an earlier bioreactor design in which gaps are spaced 45 µm apart. (E) PrePLTs form at new proPLT ends after each abscission event (yellow arrow). Primary mouse MKs are shown. (F) Increasing shear stress from 100 to 1000 seconds−1 does not increase proPLT extension rate in primary mouse MKs. Data are represented as a box-and-whisker plot where light gray indicates the upper quartile and dark gray indicates the lower quartile. (G) Primary mouse MKs retrovirally transduced to express GFP-β1 tubulin show proPLT extensions are comprised of peripheral MTs that form coils at the PLT-sized ends. (H) Jasplakinolide, 5 µM ([Jas], actin stabilizer) and 1 mM erythro-9-(3-[2-hydroxynonyl]) ([EHNA], cytoplasmic dynein inhibitor) inhibit shear-induced proPLT production in primary mouse MKs. (I) Representative images of drug-induced inhibition of proPLT production under physiological shear stress (from H). Scale bars represent 50 µm.
Figure 5
Figure 5
Bioreactor-derived mPLTs manifest structural and functional properties of mouse blood PLTs. (A) Biomarker expression, and forward/side scatter and relative concentration of GPIX+ primary mouse MKs infused into bioreactor after isolation on culture day 4, and (B) effluent collected from bioreactor 2 hours postinfusion. (C) Application of shear stress shifts GPIX+ product toward more PLT-sized cells relative to static culture supernatant. (D) Comparison of primary mouse MK culture product under static and bioreactor conditions over a period of 2 hours. (E) Application of shear stress shifts product toward more PLT-sized β1-tubulin+ Hoechst- cells (labeled Platelet) relative to static culture supernatant. Insert shows quantitation of free nuclei in effluent. (F) Bioreactor-mPLTs are ultrastructurally similar to mouse blood PLTs and contain a cortical MT coil, open canalicular system, dense tubular system, mitochondria, and characteristic secretory granules. Bottom inserts show magnification of yellow boxes at PLT ends. (G) Bioreactor-mPLTs and PLT intermediates are morphologically similar to mouse blood PLTs (supplemental Figure 6) and display comparable MT and actin expression. Top 8 panels show Hoechst labeling, middle 8 panels show β1-Tubulin labeling bottom 8 panels show Phalloidis labeling. (H) Bioreactor-mPLTs form filpodia/lamellipodia on activation and spread on glass surface. Scale bars represent 5 µm (D,G-H) and 1 µm (F).
Figure 6
Figure 6
Bioreactor-derived hiPSC-PLTs manifest structural and functional properties of human blood PLTs. (A) The hiPSC-MKs reach maximal diameter (20-60 µm) on culture day 15. (B) The hiPSC-MKs are ultrastructurally similar to primary human MKs and contain a lobulated nuclei, invaginated membrane system, glycogen stores, organelles, and characteristic secretory granules. (C) The hiPSC-MKs in static culture begin producing proPLTs at 6 hours postpurification and reach maximal proPLT production at 18 hours. White arrows denote proPLT-producing MKs. (D) The hiPSC-MKs under physiological shear stress (∼600 mPa) begin producing proPLTs immediately upon trapping and extend/release proPLTs within the first 2 hours of culture. Insert shows multiple PLT-sized swellings denoted by white arrows along single proPLT extension. (E) Percent proPLT-producing hiPSC-MKs under physiological shear stress are increased significantly to ∼90% over static cultures (∼10%). (F) ProPLT extension rates under physiological shear stress are ∼19 µm/min. Data are represented as a box-and-whisker plot where light gray indicates the upper quartile and dark gray indicates the lower quartile. (G) Bioreactor-hPLTs display forward and side scatter, and surface biomarker expression is characteristic of human blood PLTs. (H) Bioreactor-hPLTs are ultrastructurally similar to human blood PLTs and contain a cortical MT coil, open canalicular system, dense tubular system, mitochondria, and characteristic secretory granules (both panels). Top right insert, lower panel shows peripheral MT coil. (I) Bioreactor-hPLTs are anucleate, morphologically to human blood PLTs, and display comparable MT expression. (J) Bioreactor-mPLTs form filpodia/lamellipodia on activation and are spread on a glass surface. Scale bars represent 1 µm (B), 50 µm (C-D), 0.5 µm (H), and 5 µm (I-J).

Comment in

  • In vitro platelets in sight.
    Stritt S, Nieswandt B. Stritt S, et al. Blood. 2014 Sep 18;124(12):1849-50. doi: 10.1182/blood-2014-08-592493. Blood. 2014. PMID: 25606626 No abstract available.

References

    1. Linden MD, Jackson DE. Platelets: pleiotropic roles in atherogenesis and atherothrombosis. Int J Biochem Cell Biol. 2010;42(11):1762–1766. - PubMed
    1. Battinelli EM, Markens BA, Italiano JE., Jr Release of angiogenesis regulatory proteins from platelet alpha granules: modulation of physiologic and pathologic angiogenesis. Blood. 2011;118(5):1359–1369. - PMC - PubMed
    1. Semple JW, Italiano JE, Jr, Freedman J. Platelets and the immune continuum. Nat Rev Immunol. 2011;11(4):264–274. - PubMed
    1. Aster RH, Curtis BR, McFarland JG, Bougie DW. Drug-induced immune thrombocytopenia: pathogenesis, diagnosis, and management. J Thromb Haemost. 2009;7(6):911–918. - PMC - PubMed
    1. Sullivan MT, Cotten R, Read EJ, Wallace EL. Blood collection and transfusion in the United States in 2001. Transfusion. 2007;47(3):385–394. - PubMed

Publication types