. 2015 Jan 20;108(2):251-60.
doi: 10.1016/j.bpj.2014.11.3462.

Spatiotemporal detection and analysis of exocytosis reveal fusion "hotspots" organized by the cytoskeleton in endocrine cells

Affiliations

Spatiotemporal detection and analysis of exocytosis reveal fusion "hotspots" organized by the cytoskeleton in endocrine cells

Tianyi Yuan et al. Biophys J. .

Abstract

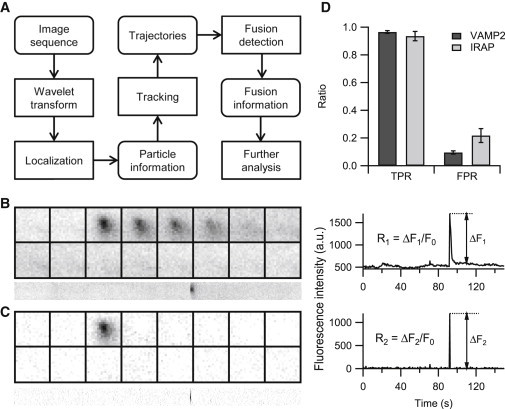
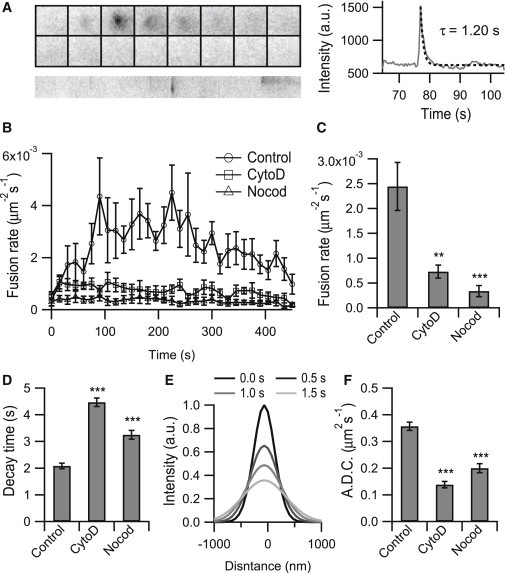
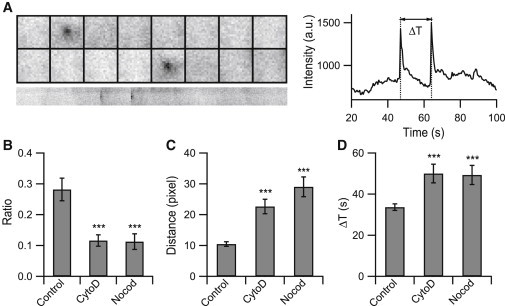
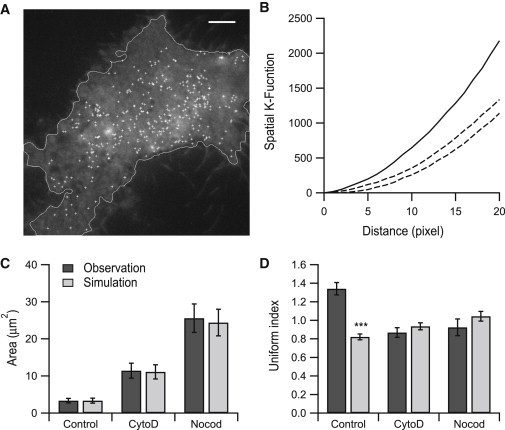
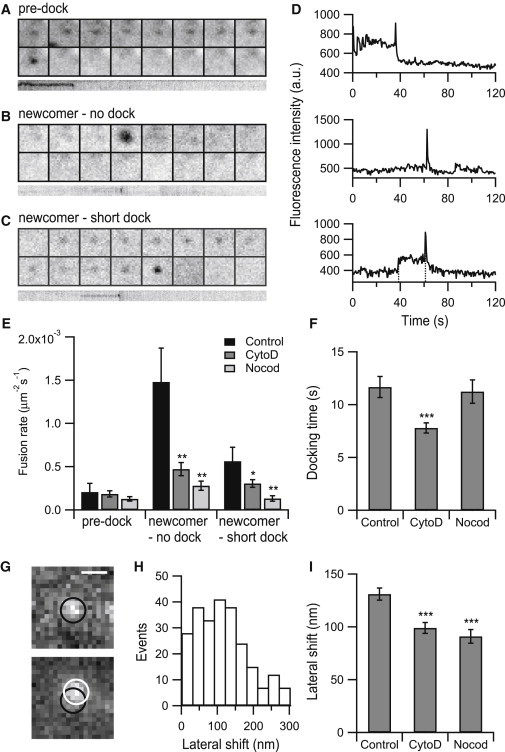
Total internal reflection fluorescence microscope has often been used to study the molecular mechanisms underlying vesicle exocytosis. However, the spatial occurrence of the fusion events within a single cell is not frequently explored due to the lack of sensitive and accurate computer-assisted programs to analyze large image data sets. Here, we have developed an image analysis platform for the nonbiased identification of different types of vesicle fusion events with high accuracy in different cell types. By performing spatiotemporal analysis of stimulus-evoked exocytosis in insulin-secreting INS-1 cells, we statistically prove that individual vesicle fusion events are clustered at hotspots. This spatial pattern disappears upon the disruption of either the actin or the microtubule network; this disruption also severely inhibits evoked exocytosis. By demonstrating that newcomer vesicles are delivered from the cell interior to the surface membrane for exocytosis, we highlight a previously unappreciated mechanism in which the cytoskeleton-dependent transportation of secretory vesicles organizes exocytosis hotspots in endocrine cells.


Figures

Figure 1
Figure 1
Automatic identification and analysis of fusion events. (A) The framework of the algorithm, comprising five steps (non-rounded rectangles). (B) An example of a typical fusion in an INS-1 cell labeled by VAMP2-pHluorin (left) and its central intensity profile (right). The rapid increase in the central intensity indicates the opening of a fusion pore; thus, the peak/background ratio (parameter R1) can be used to detect candidate events. (C) Consecutive image subtraction of (B) and its central intensity profile; only those peak increases that are greater than the background fluctuation by R2 will be considered candidate events. The montages are 19 × 19 pixels shown at 0.5-s intervals, and the corresponding kymographs (below) are 150 s. (D) The performance of the method for pHluorin-labeled fusion events (n = 1701 events from 6 cells for VAMP2 and n = 531 events from 7 cells for IRAP). R1 and R2 were set to 1.3 and 3 in both situations. Error bars are ±SE.
Figure 2
Figure 2
Disruption of the cytoskeleton inhibits secretion and changes the fusion kinetics. (A) An example of a fusion event and the time-dependent fluorescence intensity profile. The montages are 19 × 19 pixels at time intervals of 0.5 s, and the corresponding kymograph (below) is 150 s. The decay time τ of the central intensity was obtained by fitting with an exponential function. (B) Time-dependent changes in the exocytosis rate in control cells and in cells pretreated with either CytoD or Nocod. A KCl and glucose solution was applied to the tested cells at time 0. (C) Average fusion rate for each condition. (n = 1701 events from 6 cells for control, n = 824 events from 6 cells for CytoD treatment, and n = 577 events from 7 cells for Nocod treatment). (D) Average decay time for each condition. (n = 911 events from 6 cells for control, n = 622 events from 6 cells for CytoD treatment, and n = 331 events from 7 cells for Nocod treatment). (E) Intensity profiles of an example fusion event at different times fitted by Gaussian functions. (F) Average apparent diffusion coefficients for each condition. (n = 1629 events from 6 cells for control, n = 826 events from 6 cells for CytoD treatment, and n = 467 events from 7 cells for Nocod treatment). Error bars are ±SE, and all statistical significance values are relative to the control. p values were determined using Student’s t-test. ∗∗p < 0.01; ∗∗∗p < 0.001.
Figure 3
Figure 3
Disruption of the actin or microtubule network reduces the ratio of sequential fusions. (A) An example of sequential fusion and the central intensity profile. The interval between fusions was calculated as ΔT. The montages are 19 × 19 pixels at time intervals of 0.5 s, and the corresponding kymograph (below) is 150 s. (B) The ratio of sequential fusion for each condition. (C) Average minimal distance between each fusion event. In control cells, the minimum distance between each event was 10 pixels (n = 1701 events from 6 cells for control, n = 824 events from 6 cells for CytoD treatment, and n = 577 events from 7 cells for Nocod treatment). (D) Average ΔT for each condition (in B and D, n = 478 events from 6 cells for control, n = 101 events from 6 cells for CytoD treatment, n = 65 events from 7 cells for Nocod treatment). Error bars are ±SE. p values were determined using Student’s t-test. ∗∗∗p < 0.001.
Figure 4
Figure 4
Actin and microtubule networks regulate the spatial pattern of cell secretion. (A) A control cell with all fusion events from a time-lapse series marked on the first frame (crosses). Scale bar, 5 μm. (B) Ripley’s K function of (A). Solid line, observed spatial K-function of fusion events; dashed lines, upper and lower envelopes of 100 simulation results with the same number of random events within the cell boundary as in (A). (C) Average area occupied by each fusion for each condition. (D) Average uniform index for each condition (in C and D, n = 1701 events from 6 cells for control, n = 824 events from 6 cells for CytoD treatment, and n = 577 events from 7 cells for Nocod treatment). Error bars are ±SE. p values were determined using Student’s t-test. ∗∗∗p < 0.001.
Figure 5
Figure 5
Disruption of the actin or microtubule network reduces the fusion of newcomer vesicles. (AC) Example images of predock fusion, newcomer-no dock fusion, and newcomer-short dock fusion. (D) Central intensity profiles of (AC). For newcomer-short dock fusion, the interval between the two dashed lines in (D) was calculated as the docking time. (E) Average fusion rate of each type of fusion for each condition. (n = 1016 events from 6 cells for control, n = 476 events from 9 cells for CytoD treatment, and n = 285 events from 8 cells for Nocod treatment). (F) Average docking time for each condition (n = 131 events from 3 cells for control, n = 150 events from 9 cells for CytoD treatment, and n = 79 events from 8 cells for Nocod treatment). (G) Example of lateral shift of a fusing vesicle. The displacement from the last position before fusion (black circle) to the final fusion site (white circle) was 114 nm. Scale bar, 500 nm. (H) Distribution of the lateral shift in control cells. (I) Average lateral shift for each condition. (n = 262 events from 3 cells for control, n = 223 events from 9 cells for CytoD treatment, and n = 129 events from 8 cells for Nocod treatment). Error bars are ±SE. p values were determined using Student’s t-test. p < 0.05, ∗∗p < 0.01, and ∗∗∗p < 0.001.

References

    1. Südhof T.C., Rizo J. Synaptic vesicle exocytosis. Cold Spring Harb. Perspect. Biol. 2011;3:3. - PMC - PubMed
    1. von Gersdorff H., Matthews G. Electrophysiology of synaptic vesicle cycling. Annu. Rev. Physiol. 1999;61:725–752. - PubMed
    1. de Wit H., Walter A.M., Verhage M. Synaptotagmin-1 docks secretory vesicles to syntaxin-1/SNAP-25 acceptor complexes. Cell. 2009;138:935–946. - PubMed
    1. Steyer J.A., Horstmann H., Almers W. Transport, docking and exocytosis of single secretory granules in live chromaffin cells. Nature. 1997;388:474–478. - PubMed
    1. Zenisek D., Steyer J.A., Almers W. Transport, capture and exocytosis of single synaptic vesicles at active zones. Nature. 2000;406:849–854. - PubMed

Publication types

LinkOut - more resources