. 2015 Jan 20;108(2):408-19.
doi: 10.1016/j.bpj.2014.11.3467.

Determination of the catalytic mechanism for mitochondrial malate dehydrogenase

Affiliations

Determination of the catalytic mechanism for mitochondrial malate dehydrogenase

Santosh K Dasika et al. Biophys J. .

Abstract

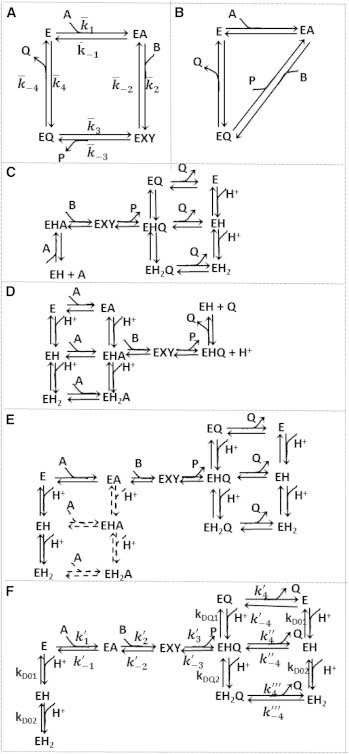
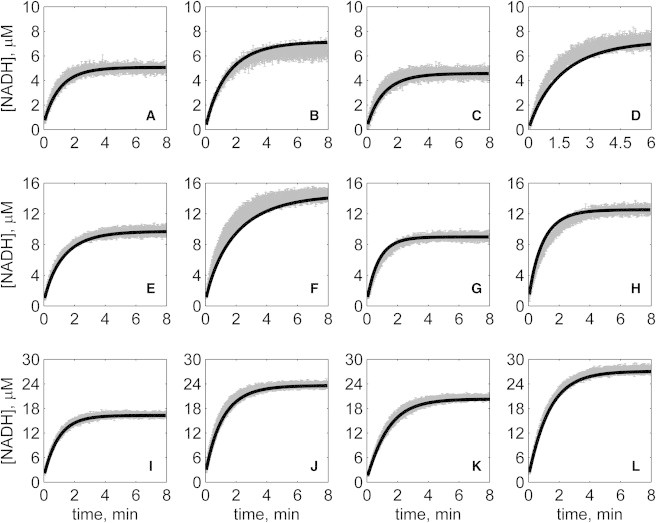
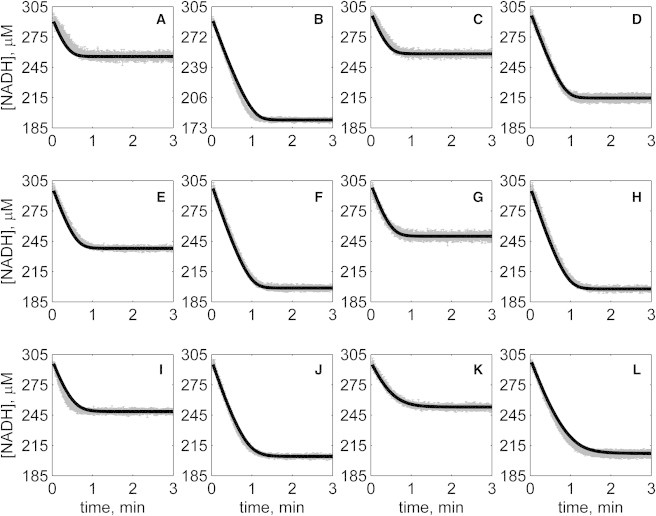
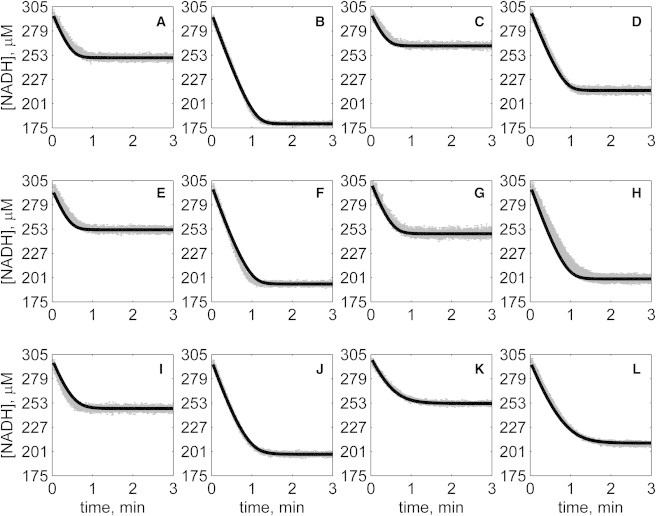
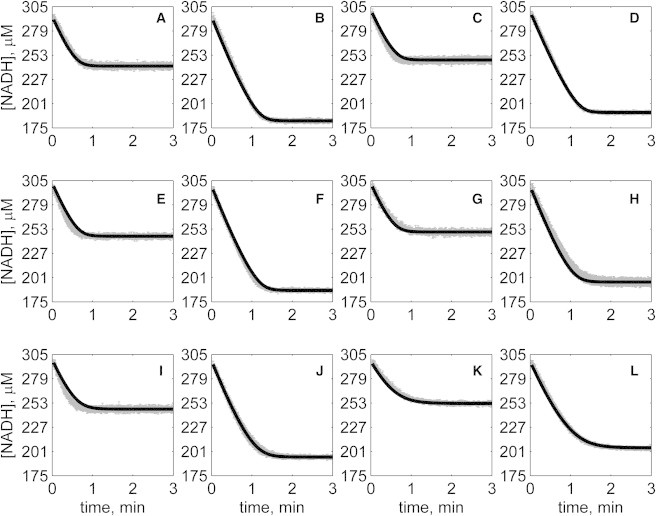
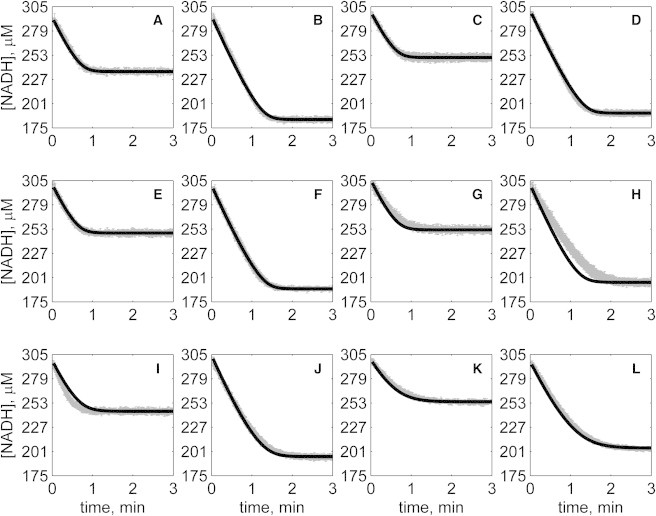
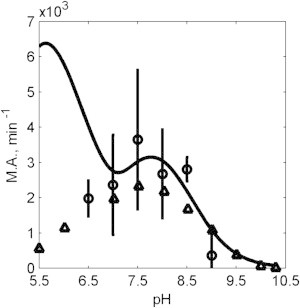
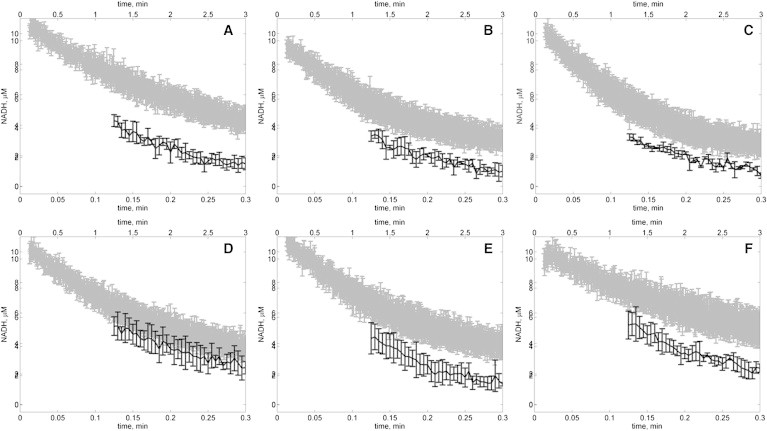
The kinetics of malate dehydrogenase (MDH) catalyzed oxidation/reduction of L-malate/oxaloacetate is pH-dependent due to the proton generated/taken up during the reaction. Previous kinetic studies on the mitochondrial MDH did not yield a consensus kinetic model that explains both substrate and pH dependency of the initial velocity. In this study, we propose, to our knowledge, a new kinetic mechanism to explain kinetic data acquired over a range of pH and substrate concentrations. Progress curves in the forward and reverse reaction directions were obtained under a variety of reactant concentrations to identify associated kinetic parameters. Experiments were conducted at physiologically relevant ionic strength of 0.17 M, pH ranging between 6.5 and 9.0, and at 25 °C. The developed model was built on the prior observation of proton uptake upon binding of NADH to MDH, and that the MDH-catalyzed oxidation of NADH may follow an ordered bi-bi mechanism with NADH/NAD binding to the enzyme first, followed by the binding of oxaloacetate/L-malate. This basic mechanism was expanded to account for additional ionic states to explain the pH dependency of the kinetic behavior, resulting in what we believe to be the first kinetic model explaining both substrate and pH dependency of the reaction velocity.


Figures

Figure 1
Figure 1
Schematics. (A) Simple ordered bi-bi model; the k¯i values represent the apparent rate constants. (B) Theorell-Chance mechanism. (C) pH dependency of NADH oxidation proposed by Raval and Wolfe (29). (D) pH dependency of NAD reduction proposed by Raval and Wolfe (29). (E) Proposed pH model that assumes NAD/NADH binding to all enzyme-protonated states. (Dashed lines) Steps for which parameters are not identifiable. (F) Schematic of the proposed model, including multiple pH-dependent ionic states. In each of these schemes, A, B, P, and Q represent NAD, MAL, OAA, and NADH, respectively, and the substrate binding or product release is represented by the direction of the arrow. The diagram uses the convention of explicitly showing association steps for binding of forward-reaction substrates A and B, and dissociation steps for unbinding of products P and Q. In the reverse operation, for example in the step from EA to E in panel A, the reactant A dissociates, even though dissociation of A is not explicitly illustrated in the figure.
Figure 2
Figure 2
Progress curves of [NADH] versus time for reverse reaction (direction of NADH oxidation) at various pH values without product inhibitors present in initial buffer. Initial conditions are [NADH]0 = 300 μM and (A) [OAA]0 = 50 μM, pH 6.5; (B) [OAA]0 = 100 μM, pH 6.5; (C) [OAA]0 = 50 μM, pH 7.0; (D) [OAA]0 = 100 μM, pH 7.0; (E) [OAA]0 = 50 μM, pH 7.5; (F) [OAA]0 = 100 μM, pH 7.5; (G) [OAA]0 = 50 μM, pH 8.0; (H) [OAA]0 = 100 μM, pH 8.0; (I) [OAA]0 = 50 μM, pH 8.5; (J) [OAA]0 = 100 μM pH 8.5; (K) [OAA]0 = 50 μM, pH 9.0; and (L) [OAA]0 = 100 μM, pH 9.0. (In each plot the shaded lines and solid lines, respectively, represent mean with standard deviation of experimentally measured [NADH], and [NADH] obtained from fitting data to ordered bi-bi mechanism.)
Figure 3
Figure 3
Progress curves of [NADH] versus time for forward reaction (direction of NAD reduction) at various pH values without product inhibitors present in initial buffer. Initial conditions are [NAD]0 = 1 mM and (A) [MAL]0 = 10 mM, pH 6.5; (B) [MAL]0 = 20 mM, pH 6.5; (C) [MAL]0 = 5 mM, pH 7.0; (D) [MAL]0 = 10 mM, pH 7.0; (E) [MAL]0 = 5 mM, pH 7.5; (F) [MAL]0 = 10 mM, pH 7.5; (G) [MAL]0 = 1 mM, pH 8.0; (H) [MAL]0 = 2 mM, pH 8.0; (I) [MAL]0 = 1 mM, pH 8.5; (J) [MAL]0 = 2 mM, pH 8.5; (K) [MAL]0 = 0.5 mM, pH 9.0; and (L) [MAL]0 = 1 mM, pH 9.0. (In each plot the shaded lines and solid lines, respectively, represent mean with standard deviation of experimentally measured [NADH], and [NADH] obtained from fitting data to ordered bi-bi mechanism.)
Figure 4
Figure 4
Progress curves of [NADH] versus time for reverse reaction (direction of NADH oxidation) at various pH values with 1 mM NAD as product inhibitor present in initial buffer. Initial conditions are [NADH]0 = 300 μM and (A) [OAA]0 = 50 μM, pH 6.5; (B) [OAA]0 = 100 μM, pH 6.5; (C) [OAA]0 = 50 μM, pH 7.0; (D) [OAA]0 = 100 μM, pH 7.0; (E) [OAA]0 = 50 μM, pH 7.5; (F) [OAA]0 = 100 μM, pH 7.5; (G) [OAA]0 = 50 μM, pH 8.0; (H) [OAA]0 = 100 μM, pH 8.0; (I) [OAA]0 = 50 μM, pH 8.5; (J) [OAA]0 = 100 μM, pH 8.5; (K) [OAA]0 = 50 μM, pH 9.0; and (L) [OAA]0 = 100 μM, pH 9.0. (In each plot the shaded lines and solid lines, respectively, represent mean with standard deviation of experimentally measured [NADH], and [NADH] obtained from fitting data to ordered bi-bi mechanism.)
Figure 5
Figure 5
Progress curves of [NADH] versus time for reverse reaction (direction of NADH oxidation) at various pH values with 2 mM NAD as product inhibitor present in initial buffer. Initial conditions are [NADH]0 = 300 μM and (A) [OAA]0 = 50 μM, pH 6.5; (B) [OAA]0 = 100 μM, pH 6.5; (C) [OAA]0 = 50 μM, pH 7.0; (D) [OAA]0 = 100 μM, pH 7.0; (E) [OAA]0 = 50 μM, pH 7.5; (F) [OAA]0 = 100 μM, pH 7.5; (G) [OAA]0 = 50 μM, pH 8.0; (H) [OAA]0 = 100 μM, pH 8.0; (I) [OAA]0 = 50 μM, pH 8.5; (J) [OAA]0 = 100 μM, pH 8.5; (K) [OAA]0 = 50 μM, pH 9.0; and (L) [OAA]0 = 100 μM, pH 9.0. (In each plot the shaded lines and solid lines, respectively, represent mean with standard deviation of experimentally measured [NADH], and [NADH] obtained from fitting data to ordered bi-bi mechanism.)
Figure 6
Figure 6
Progress curves of [NADH] versus time for reverse reaction (direction of NADH oxidation) at various pH values with 1 mM MAL as product inhibitor present in initial buffer. Initial conditions are [NADH]0 = 300 μM and (A) [OAA]0 = 50 μM, pH 6.5; (B) [OAA]0 = 100 μM, pH 6.5; (C) [OAA]0 = 50 μM, pH 7.0; (D) [OAA]0 = 100 μM, pH 7.0; (E) [OAA]0 = 50 μM, pH 7.5; (F) [OAA]0 = 100 μM, pH 7.5; (G) [OAA]0 = 50 μM, pH 8.0; (H) [OAA]0 = 100 μM, pH 8.0; (I) [OAA]0 = 50 μM, pH 8.5; (J) [OAA]0 = 100 μM, pH 8.5; (K) [OAA]0 = 50 μM, pH 9.0; and (L) [OAA]0 = 100 μM, pH 9.0. (In each plot the shaded lines and solid lines, respectively, represent mean with standard deviation of experimentally measured [NADH], and [NADH] obtained from fitting data to ordered bi-bi mechanism.)
Figure 7
Figure 7
Progress curves of [NADH] versus time for reverse reaction (direction of NADH oxidation) at various pH values with 2 mM MAL as product inhibitor present in initial buffer. Initial conditions are [NADH]0 = 300 μM and (A) [OAA]0 = 50 μM, pH 6.5; (B) [OAA]0 = 100 μM, pH 6.5; (C) [OAA]0 = 50 μM, pH 7.0; (D) [OAA]0 = 100 μM, pH 7.0; (E) [OAA]0 = 50 μM, pH 7.5; (F) [OAA]0 = 100 μM, pH 7.5; (G) [OAA]0 = 50 μM, pH 8.0; (H) [OAA]0 = 100 μM, pH 8.0; (I) [OAA]0 = 50 μM, pH 8.5; (J) [OAA]0 = 100 μM, pH 8.5; (K) [OAA]0 = 50 μM, pH 9.0; and (L) [OAA]0 = 100 μM, pH 9.0. (In each plot the shaded lines and solid lines, respectively, represent mean with standard deviation of experimentally measured [NADH], and [NADH] obtained from fitting data to ordered bi-bi mechanism.)
Figure 8
Figure 8
Molecular activity as a function of pH. Experimental data from this study (open circles) are plotted along with experimental data from Raval and Wolfe (29) (open triangles) obtained under identical experimental conditions: [NADH] = 10 μM and [OAA] = 10 μM. Model predictions (Fig. 1F) are plotted (solid line). The model predicts a peak at low pH (pH ∼6), contradicting the experimental data observations.
Figure 9
Figure 9
Progress of NADH oxidation for initial conditions [NADH] = 10 μM and [OAA] = 10 μM with high (100 IU/mL stock solution) and low (10 IU/mL stock solution) enzyme concentration for pH: (A) 6.5, (B) 7.0, (C) 7.5, (D) 8.0, (E) 8.5, and (F) 9.0 (shaded lines represents data with low enzyme concentration (∼0.6 nM); solid lines represent data with high enzyme concentration (∼6 nM)). The time axis for the low enzyme concentration is indicated on the bottom of each plot; the time axis for the high enzyme concentration is indicated on the top of each plot.

Similar articles

Cited by

References

    1. Holbrook J.J., Wolfe R.G. Malate dehydrogenase. X. Fluorescence microtitration studies of D-malate, hydroxymalonate, nicotinamide dinucleotide, and dihydronicotinamide-adenine dinucleotide binding by mitochondrial and supernatant porcine heart enzymes. Biochemistry. 1972;11:2499–2502. - PubMed
    1. Roderick S.L., Banaszak L.J. The conformation of mitochondrial malate dehydrogenase derived from an electron density map at 5.3-Å resolution. J. Biol. Chem. 1983;258:11636–11642. - PubMed
    1. Roderick S.L., Banaszak L.J. The three-dimensional structure of porcine heart mitochondrial malate dehydrogenase at 3.0-Å resolution. J. Biol. Chem. 1986;261:9461–9464. - PubMed
    1. Gleason W.B., Fu Z., Banaszak L. Refined crystal structure of mitochondrial malate dehydrogenase from porcine heart and the consensus structure for dicarboxylic acid oxidoreductases. Biochemistry. 1994;33:2078–2088. - PubMed
    1. Murphey W.H., Kitto G.B., Kaplan N. Malate dehydrogenases. I. A survey of molecular size measured by gel filtration. Biochemistry. 1967;6:603–610. - PubMed

Publication types

LinkOut - more resources