. 2015 Apr 9;520(7546):224-9.
doi: 10.1038/nature14101. Epub 2015 Jan 21.

Common genetic variants influence human subcortical brain structures

Derrek P Hibar  1 Jason L Stein  2 Miguel E Renteria  3 Alejandro Arias-Vasquez  4 Sylvane Desrivières  5 Neda Jahanshad  1 Roberto Toro  6 Katharina Wittfeld  7 Lucija Abramovic  8 Micael Andersson  9 Benjamin S Aribisala  10 Nicola J Armstrong  11 Manon Bernard  12 Marc M Bohlken  8 Marco P Boks  8 Janita Bralten  13 Andrew A Brown  14 M Mallar Chakravarty  15 Qiang Chen  16 Christopher R K Ching  17 Gabriel Cuellar-Partida  3 Anouk den Braber  18 Sudheer Giddaluru  19 Aaron L Goldman  16 Oliver Grimm  20 Tulio Guadalupe  21 Johanna Hass  22 Girma Woldehawariat  23 Avram J Holmes  24 Martine Hoogman  25 Deborah Janowitz  26 Tianye Jia  5 Sungeun Kim  27 Marieke Klein  25 Bernd Kraemer  28 Phil H Lee  29 Loes M Olde Loohuis  30 Michelle Luciano  31 Christine Macare  5 Karen A Mather  32 Manuel Mattheisen  33 Yuri Milaneschi  34 Kwangsik Nho  27 Martina Papmeyer  35 Adaikalavan Ramasamy  36 Shannon L Risacher  37 Roberto Roiz-Santiañez  38 Emma J Rose  39 Alireza Salami  40 Philipp G Sämann  41 Lianne Schmaal  34 Andrew J Schork  42 Jean Shin  12 Lachlan T Strike  43 Alexander Teumer  44 Marjolein M J van Donkelaar  25 Kristel R van Eijk  8 Raymond K Walters  45 Lars T Westlye  46 Christopher D Whelan  1 Anderson M Winkler  47 Marcel P Zwiers  48 Saud Alhusaini  49 Lavinia Athanasiu  14 Stefan Ehrlich  50 Marina M H Hakobjan  25 Cecilie B Hartberg  51 Unn K Haukvik  52 Angelien J G A M Heister  25 David Hoehn  41 Dalia Kasperaviciute  53 David C M Liewald  31 Lorna M Lopez  31 Remco R R Makkinje  25 Mar Matarin  54 Marlies A M Naber  25 D Reese McKay  55 Margaret Needham  56 Allison C Nugent  23 Benno Pütz  41 Natalie A Royle  57 Li Shen  27 Emma Sprooten  58 Daniah Trabzuni  59 Saskia S L van der Marel  25 Kimm J E van Hulzen  25 Esther Walton  22 Christiane Wolf  41 Laura Almasy  60 David Ames  61 Sampath Arepalli  62 Amelia A Assareh  32 Mark E Bastin  63 Henry Brodaty  32 Kazima B Bulayeva  64 Melanie A Carless  65 Sven Cichon  66 Aiden Corvin  56 Joanne E Curran  65 Michael Czisch  41 Greig I de Zubicaray  67 Allissa Dillman  62 Ravi Duggirala  65 Thomas D Dyer  60 Susanne Erk  68 Iryna O Fedko  18 Luigi Ferrucci  69 Tatiana M Foroud  70 Peter T Fox  71 Masaki Fukunaga  72 J Raphael Gibbs  73 Harald H H Göring  65 Robert C Green  74 Sebastian Guelfi  75 Narelle K Hansell  3 Catharina A Hartman  76 Katrin Hegenscheid  77 Andreas Heinz  78 Dena G Hernandez  73 Dirk J Heslenfeld  79 Pieter J Hoekstra  76 Florian Holsboer  41 Georg Homuth  80 Jouke-Jan Hottenga  18 Masashi Ikeda  81 Clifford R Jack Jr  82 Mark Jenkinson  83 Robert Johnson  84 Ryota Kanai  85 Maria Keil  28 Jack W Kent Jr  65 Peter Kochunov  86 John B Kwok  87 Stephen M Lawrie  35 Xinmin Liu  88 Dan L Longo  89 Katie L McMahon  90 Eva Meisenzahl  91 Ingrid Melle  14 Sebastian Mohnke  68 Grant W Montgomery  3 Jeanette C Mostert  25 Thomas W Mühleisen  92 Michael A Nalls  62 Thomas E Nichols  93 Lars G Nilsson  9 Markus M Nöthen  94 Kazutaka Ohi  95 Rene L Olvera  96 Rocio Perez-Iglesias  97 G Bruce Pike  98 Steven G Potkin  99 Ivar Reinvang  100 Simone Reppermund  32 Marcella Rietschel  20 Nina Romanczuk-Seiferth  68 Glenn D Rosen  101 Dan Rujescu  91 Knut Schnell  102 Peter R Schofield  87 Colin Smith  103 Vidar M Steen  19 Jessika E Sussmann  35 Anbupalam Thalamuthu  32 Arthur W Toga  104 Bryan J Traynor  62 Juan Troncoso  105 Jessica A Turner  106 Maria C Valdés Hernández  107 Dennis van 't Ent  18 Marcel van der Brug  108 Nic J A van der Wee  109 Marie-Jose van Tol  110 Dick J Veltman  34 Thomas H Wassink  111 Eric Westman  112 Ronald H Zielke  84 Alan B Zonderman  113 David G Ashbrook  114 Reinmar Hager  114 Lu Lu  115 Francis J McMahon  23 Derek W Morris  116 Robert W Williams  117 Han G Brunner  118 Randy L Buckner  119 Jan K Buitelaar  120 Wiepke Cahn  8 Vince D Calhoun  121 Gianpiero L Cavalleri  1 Benedicto Crespo-Facorro  38 Anders M Dale  122 Gareth E Davies  123 Norman Delanty  124 Chantal Depondt  125 Srdjan Djurovic  126 Wayne C Drevets  127 Thomas Espeseth  46 Randy L Gollub  128 Beng-Choon Ho  129 Wolfgang Hoffmann  130 Norbert Hosten  77 René S Kahn  8 Stephanie Le Hellard  19 Andreas Meyer-Lindenberg  20 Bertram Müller-Myhsok  131 Matthias Nauck  132 Lars Nyberg  9 Massimo Pandolfo  125 Brenda W J H Penninx  34 Joshua L Roffman  133 Sanjay M Sisodiya  134 Jordan W Smoller  135 Hans van Bokhoven  25 Neeltje E M van Haren  8 Henry Völzke  44 Henrik Walter  68 Michael W Weiner  136 Wei Wen  32 Tonya White  137 Ingrid Agartz  138 Ole A Andreassen  14 John Blangero  60 Dorret I Boomsma  18 Rachel M Brouwer  8 Dara M Cannon  139 Mark R Cookson  62 Eco J C de Geus  18 Ian J Deary  31 Gary Donohoe  116 Guillén Fernández  140 Simon E Fisher  141 Clyde Francks  141 David C Glahn  55 Hans J Grabe  142 Oliver Gruber  143 John Hardy  75 Ryota Hashimoto  144 Hilleke E Hulshoff Pol  8 Erik G Jönsson  145 Iwona Kloszewska  146 Simon Lovestone  147 Venkata S Mattay  148 Patrizia Mecocci  149 Colm McDonald  150 Andrew M McIntosh  151 Roel A Ophoff  152 Tomas Paus  153 Zdenka Pausova  154 Mina Ryten  155 Perminder S Sachdev  156 Andrew J Saykin  157 Andy Simmons  158 Andrew Singleton  62 Hilkka Soininen  159 Joanna M Wardlaw  63 Michael E Weale  160 Daniel R Weinberger  161 Hieab H H Adams  162 Lenore J Launer  163 Stephan Seiler  164 Reinhold Schmidt  164 Ganesh Chauhan  165 Claudia L Satizabal  166 James T Becker  167 Lisa Yanek  168 Sven J van der Lee  169 Maritza Ebling  170 Bruce Fischl  171 W T Longstreth Jr  172 Douglas Greve  170 Helena Schmidt  173 Paul Nyquist  174 Louis N Vinke  170 Cornelia M van Duijn  169 Luting Xue  175 Bernard Mazoyer  176 Joshua C Bis  177 Vilmundur Gudnason  178 Sudha Seshadri  179 M Arfan Ikram  162 Alzheimer’s Disease Neuroimaging InitiativeCHARGE ConsortiumEPIGENIMAGENSYSNicholas G Martin  3 Margaret J Wright  180 Gunter Schumann  5 Barbara Franke  181 Paul M Thompson  1 Sarah E Medland  3
Collaborators, Affiliations

Common genetic variants influence human subcortical brain structures

Derrek P Hibar et al. Nature. .

Abstract

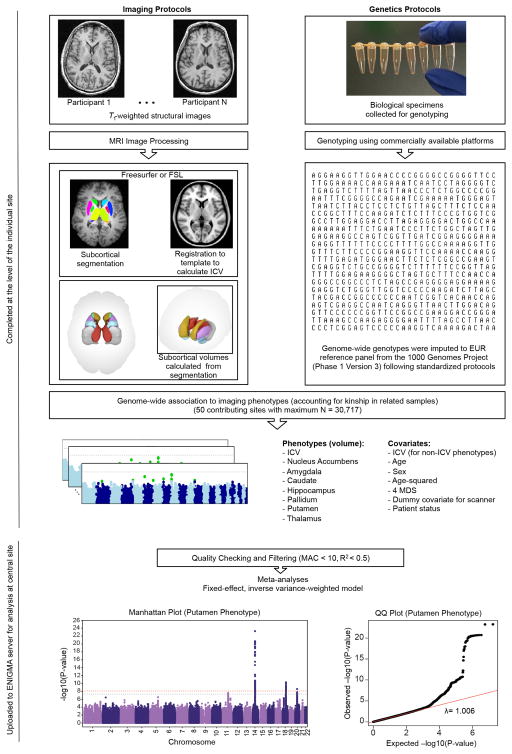
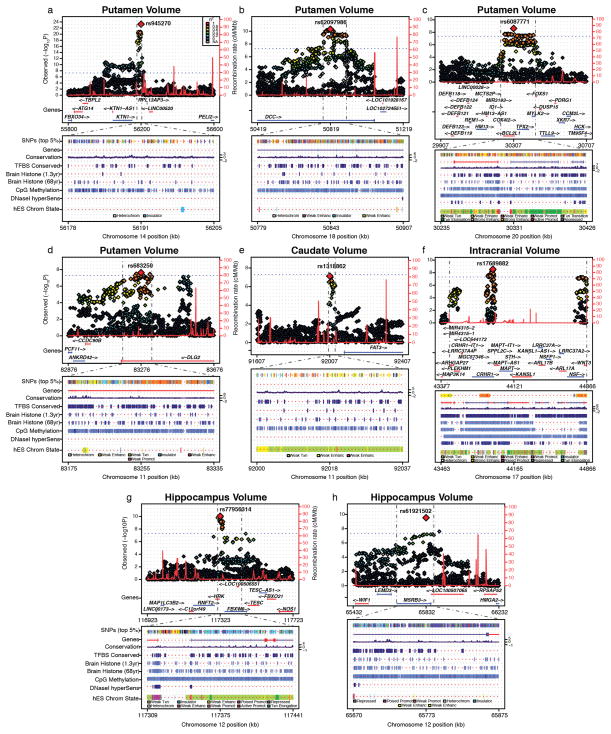
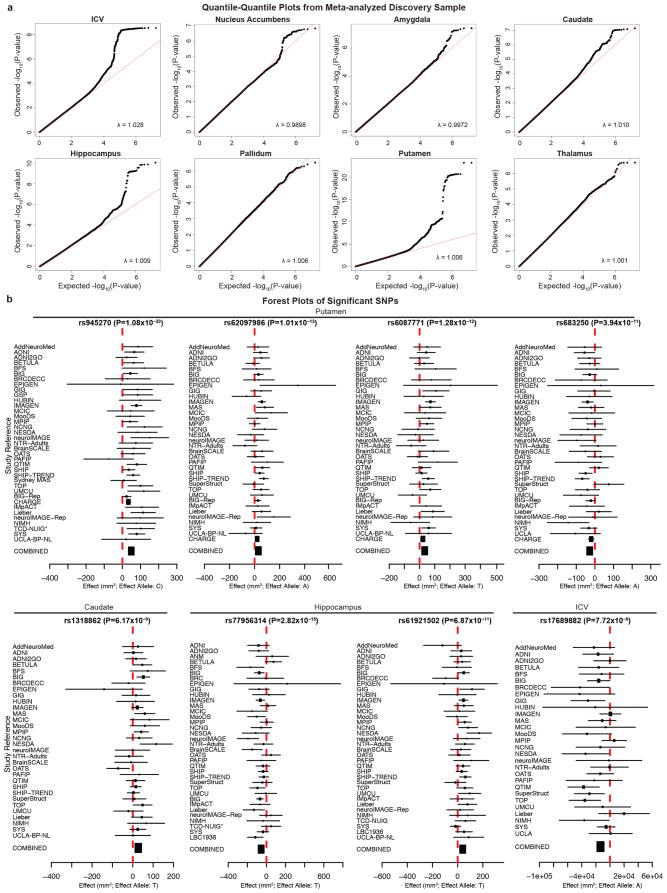
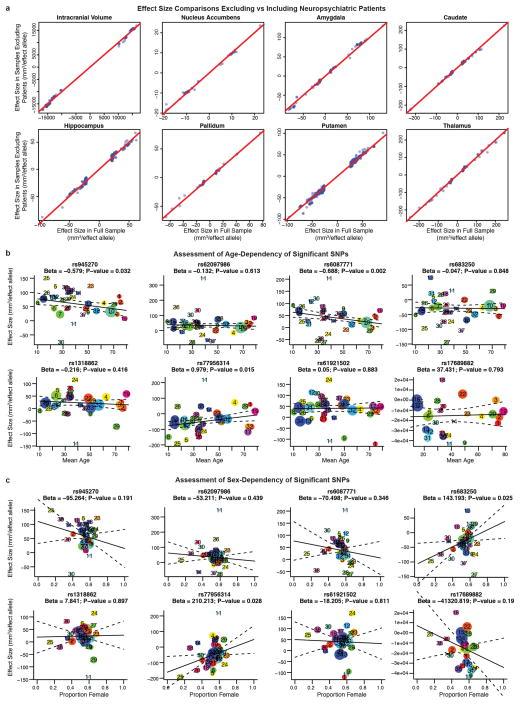
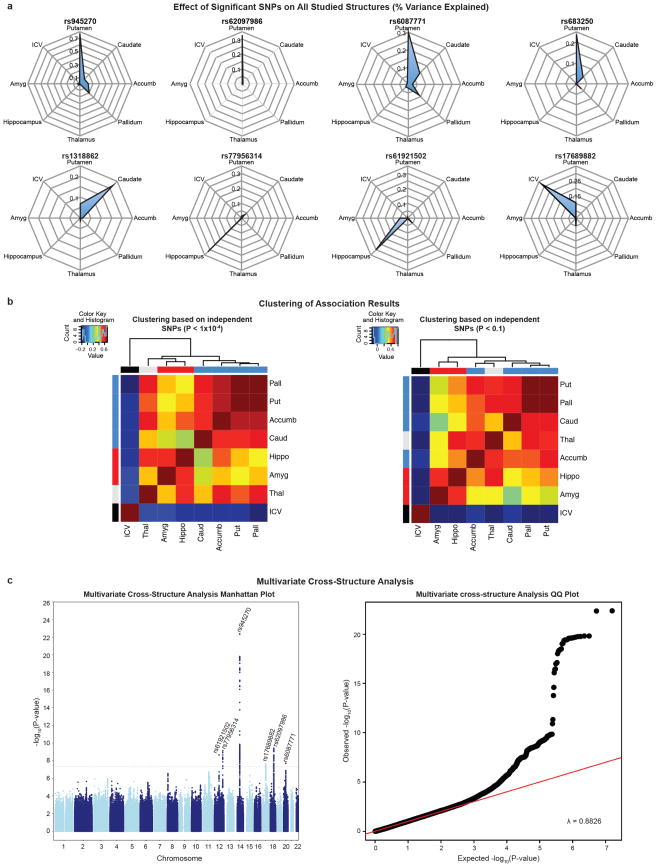
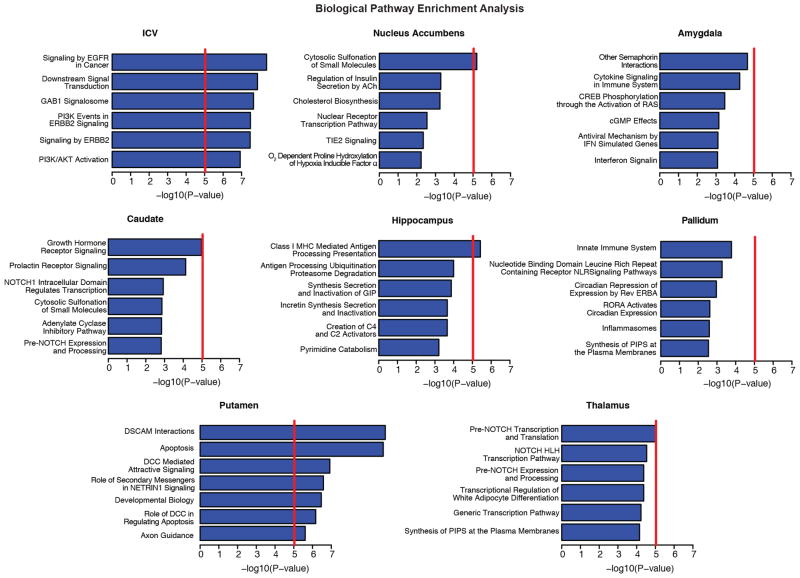
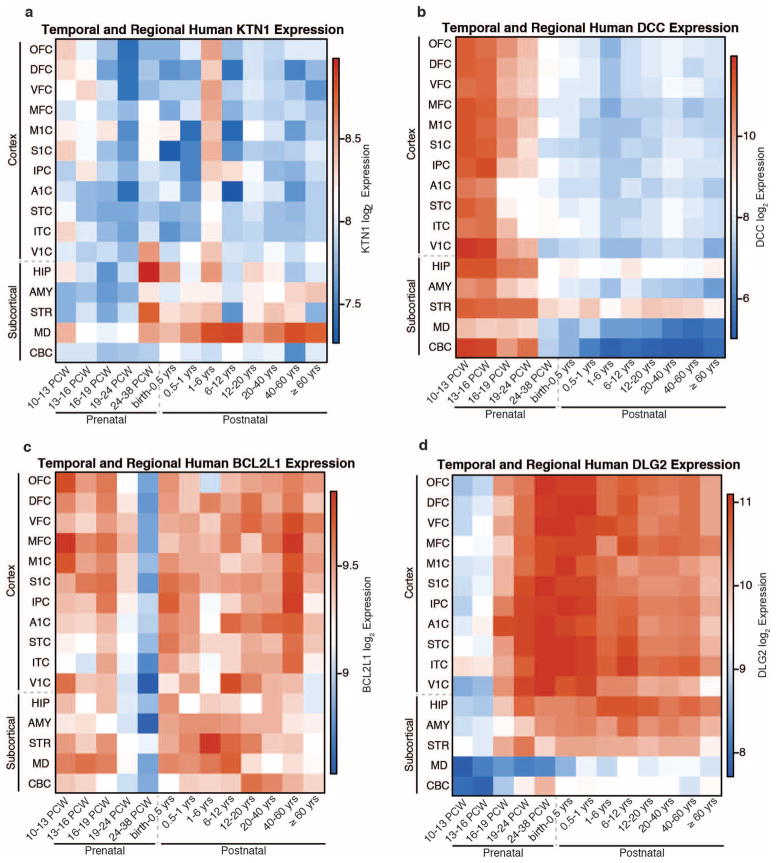
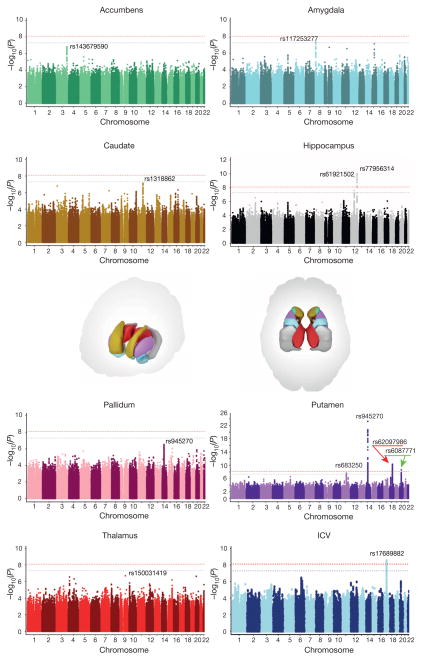
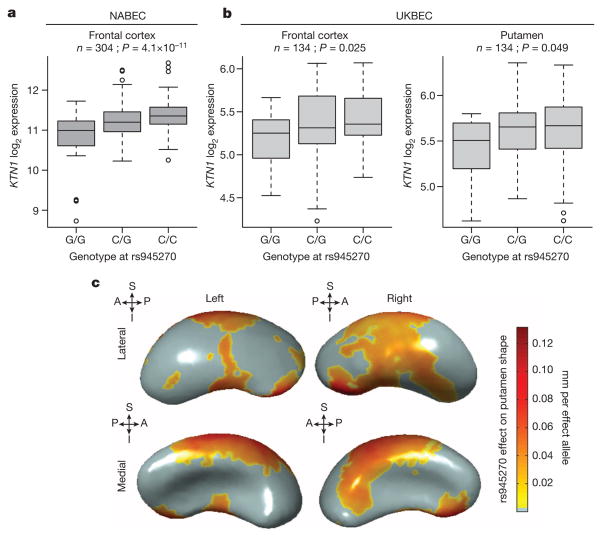
The highly complex structure of the human brain is strongly shaped by genetic influences. Subcortical brain regions form circuits with cortical areas to coordinate movement, learning, memory and motivation, and altered circuits can lead to abnormal behaviour and disease. To investigate how common genetic variants affect the structure of these brain regions, here we conduct genome-wide association studies of the volumes of seven subcortical regions and the intracranial volume derived from magnetic resonance images of 30,717 individuals from 50 cohorts. We identify five novel genetic variants influencing the volumes of the putamen and caudate nucleus. We also find stronger evidence for three loci with previously established influences on hippocampal volume and intracranial volume. These variants show specific volumetric effects on brain structures rather than global effects across structures. The strongest effects were found for the putamen, where a novel intergenic locus with replicable influence on volume (rs945270; P = 1.08 × 10(-33); 0.52% variance explained) showed evidence of altering the expression of the KTN1 gene in both brain and blood tissue. Variants influencing putamen volume clustered near developmental genes that regulate apoptosis, axon guidance and vesicle transport. Identification of these genetic variants provides insight into the causes of variability in human brain development, and may help to determine mechanisms of neuropsychiatric dysfunction.


Conflict of interest statement

The authors declare no competing financial interests.

Figures

Extended Data Figure 1
Extended Data Figure 1. Outline of the genome-wide association meta-analysis
Structural T1-weighted brain MRI and biological specimens for DNA extraction were acquired from each individual at each site. Imaging protocols were distributed to and completed by each site for standardized automated segmentation of brain structures and calculation of the ICV. Volumetric phenotypes were calculated from the segmentations. Genome-wide genotyping was completed at each site using commercially available chips. Standard imputation protocols to the 1000 Genomes reference panel (phase 1, version 3) were also distributed and completed at each site. Each site completed genome-wide association for each of the eight volumetric brain phenotypes with the listed covariates. Statistical results from GWAS files were uploaded to a central site for quality checking and fixed effects meta-analysis.
Extended Data Figure 2
Extended Data Figure 2. Ancestry inference via multi-dimensional scaling plots
Multi-dimensional scaling (MDS) plots of the discovery cohorts to HapMap III reference panels of known ancestry are displayed. Ancestry is generally homogeneous within each group. In all discovery samples any individuals with non-European ancestry were excluded before association. The axes have been flipped to the same orientation for each sample for ease of comparison. ASW, African ancestry in southwest USA; CEU, Utah residents with northern and western European ancestry from the CEPH collection; CHD, Chinese in metropolitan Denver, Colorado; GIH, Gujarati Indians in Houston, Texas; LWK, Luhya in Webuye, Kenya; MEX, Mexican ancestry in Los Angeles, California; MKK, Maasai in Kinyawa, Kenya; TSI, Tuscans in Italy; YRI, Yoruba in Ibadan, Nigeria.
Extended Data Figure 3
Extended Data Figure 3. Genomic function is annotated near novel genome-wide significant loci
ah, For each panel, zoomed-in Manhattan plots (±400 kb from top SNP) are shown with gene models below (GENCODE version 19). Plots below are zoomed to highlight the genomic region that probably contains the causal variant(s) (r2 > 0.8 from the top SNP). Genomic annotations from the UCSC browser and ENCODE are displayed to indicate potential functionality (see Methods for detailed track information). SNP coverage is low in f owing to a common genetic inversion in the region. Each plot was made using the Locus Track software (http://gump.qimr.edu.au/general/gabrieC/LocusTrack/).
Extended Data Figure 4
Extended Data Figure 4. Quantile–quantile and forest plots from meta-analysis of discovery cohorts
a, Quantile–quantile plots show that the observed P values only deviate from the expected null distribution at the most significant values, indicating that population stratification or cryptic relatedness are not unduly inflating the results. This is quantified through the genomic control parameter (λ; which evaluates whether the median test statistic deviates from expected). λ values near 1 indicate that the median test statistic is similar to those derived from a null distribution. Corresponding meta-analysis Manhattan plots can be found in Fig. 1. b, Forest plots show the effect at each of the contributing sites to the meta-analysis. The size of the dot is proportional to the sample size, the effect is shown by the position on the x axis, and the standard error is shown by the line. Sites with an asterisk indicate the genotyping of a proxy SNP (in perfect linkage disequilibrium calculated from 1000 Genomes) for replication.
Extended Data Figure 5
Extended Data Figure 5. Influence of patients with neuropsychiatric disease, age and gender on association results
a, Scatterplot of effect sizes including and excluding patients with neuropsychiatric disorders for nominally significant SNPs. For each of the eight volumetric phenotypes, SNPs with P < 1 × 10⁻⁵ in the full discovery set meta-analysis were also evaluated excluding the patients. The beta values from regression, a measure of effect size, are plotted (blue dots) along with a line of equivalence between the two conditions (red line). The correlation between effect sizes with and without patients was very high (r > 0.99), showing that the SNPs with significant effects on brain structure are unlikely to be driven by the diseased individuals. b, Meta-regression comparison of effect size with mean age at each site. Each site has a corresponding number and coloured dot in each graph. The size of each dot is based on the standard error such that bigger sites with more definitive estimates have larger dots (and more influence on the meta-regression). The age range of participants covered most of the lifespan (9–97 years), but only one of these eight loci showed a significant relationship with the mean age of each cohort (rs608771 affecting putamen volume). c, Meta-regression comparison of effect size with the proportion of females at each site. No loci showed evidence of moderation by the proportion of females in a given sample. However, the proportion of females at each site has a very restricted range, so results should be interpreted with caution. Plotted information follows the same convention as described in b. The sites are numbered in the following order: (1) AddNeuroMed, (2) ADNI, (3) ADNI2GO, (4) BETULA, (5) BFS, (6) BIG, (7) BIG-Rep, (8) BrainSCALE, (9) BRCDECC, (10) CHARGE, (11) EPIGEN, (12) GIG, (13) GSP, (14) HUBIN, (15) IMAGEN, (16) IMpACT, (17) LBC1936, (18) Lieber, (19) MAS, (20) MCIC, (21) MooDS, (22) MPIP, (23) NCNG, (24) NESDA, (25) neuroIMAGE, (26) neuroIMAGE-Rep, (27) NIMH, (28) NTR-Adults, (29) OATS, (30) PAFIP, (31) QTIM, (32) SHIP, (33) SHIP-TREND, (34) SYS, (35) TCD-NUIG, (36) TOP, (37) UCLA-BP-NL and (38) UMCU.
Extended Data Figure 6
Extended Data Figure 6. Cross-structure analyses
a, Radial plots of effect sizes from the discovery sample for all genome-wide significant SNPs identified in this study. Plots indicate the effect of each genetic variant, quantified as percentage variance explained, on the eight volumetric phenotypes studied. As expected, the SNPs identified with influence on a phenotype show the highest effect size for that phenotype: putamen volume (rs945270, rs62097986, rs608771 and rs683250), hippocampal volume (rs77956314 and rs61921502), caudate volume (rs1318862) and ICV (rs17689882). In general much smaller effects are observed on other structures. b, Correlation heat map of GWAS test statistics (t-values) and hierarchical clustering. Independent SNPs were chosen within an linkage disequilibrium block based on the highest association in the multivariate cross-structure analysis described in Extended Data Fig. 6c. Two heat maps are shown taking only independent SNPs with either P < 1 × 10⁻⁴ (left) or P < 0.01 (right) in the multivariate cross-structure analysis. Different structures are labelled in developmentally similar regions by the colour bar on the top and side of the heat map including basal ganglia (putamen, pallidum, caudate and accumbens; blue), amygdalo–hippocampal complex (hippocampus and amygdala; red), thalamus (turquoise) and ICV (black). Hierarchical clustering showed that developmentally similar regions have mostly similar genetic influences across the entire genome. The low correlation with the ICV is owing to it being used as a covariate in the subcortical structure GWAS associations. c, A multivariate cross-structure analysis of all volumetric brain traits. A Manhattan plot (left) and corresponding quantile–quantile plot (right) of multivariate GWAS analysis of all traits (volumes of the accumbens, amygdala, caudate, hippocampus, pallidum, putamen, thalamus, and ICV) in the discovery data set using the TATES method is shown. Multivariate cross-structure analysis confirmed the univariate analyses (see Table 1), but did not reveal any additional loci achieving cross-structure levels of significance.
Extended Data Figure 7
Extended Data Figure 7. Pathway analysis of GWAS results for each brain structure
A pathway analysis was performed on each brain volume GWAS using KGG to conduct gene-based tests and the Reactome database for pathway definition. Pathway-wide significance was calculated using a Bonferroni correction threshold accounting for the number of pathways and traits tested such that Pthresh = 0.05/(671 pathways × 7 independent traits) = 1.06 × 10⁻⁵ and is shown here as a red line. The number of independent traits was calculated by accounting for the non-independence of each of the eight traits examined (described in the Methods). Variants that influence the putamen were clustered near genes known to be involved in DSCAM interactions, neuronal arborization and axon guidance. Variants that influence intracranial volume are clustered near genes involved in EGFR and phosphatidylinositol-3-OH kinase (PI(3)K)/AKT signalling pathways, known to be involved in neuronal survival. All of these represent potential mechanisms by which genetic variants influence brain structure. It is important to note that the hybrid set-based test (HYST) method for pathway analysis used here can be strongly influenced by a few highly significant genes, as was the case for putamen hits in which DCC and BCL2L1 were driving the pathway results.
Extended Data Figure 8
Extended Data Figure 8. Spatio-temporal maps showing expression of genes near the four significant putamen loci over time and throughout regions of the brain
Spatio-temporal gene expression was plotted as normalized log2 expression. Different areas of the neocortex (A1C, primary auditory cortex; DFC, dorsolateral prefrontal cortex; IPC, posterior inferior parietal cortex; ITC, inferior temporal cortex; MFC, medial prefrontal cortex; M1C, primary motor cortex; OFC, orbital prefrontal cortex; STC, superior temporal cortex; S1C, primary somatosensory cortex; VFC, ventrolateral prefrontal cortex; V1C, primary visual cortex) as well as subcortical areas (AMY, amygdala; CBC, cerebellar cortex; HIP, hippocampus; MD, mediodorsal nucleus of the thalamus; STR, striatum) are plotted from 10 post-conception weeks (PCW) to more than 60 years old. Genes that probably influence putamen volume are expressed in the striatum at some point during the lifespan. After late fetal development, KTN1 is expressed in the human thalamus, striatum and hippocampus and is more highly expressed in the striatum than the cortex. Most genes seem to have strong gradients of expression across time, with DCC most highly expressed during early prenatal life, and DLG2 most highly expressed at mid-fetal periods and throughout adulthood. BCL2L1, which inhibits programmed cell death, has decreased striatal expression at the end of neurogenesis (24–38 PCW), a period marked by increased apoptosis in the putamen.
Extended Data Figure 9
Extended Data Figure 9. CTCF-binding sites in the vicinity of the putamen locus marked by rs945270
CTCF-binding sites from the ENCODE project are displayed from the database CTCFBSDB 2.0 (ref. 23) from two different cell types: embryonic stem cells (track ENCODE_Broad_H1-hESC_99540) and a neuroblastoma cell line differentiated with retinoic acid (ENCODE_UW_SK-N-SH_RA_97826). A proxy SNP to the top hit within the locus, rs8017172 (r2 = 1.0 to rs945270), lies within a CTCF-binding site called based on ChIP-seq data in the embryonic stem cells and near the binding site in neural SK-N-SH cells. As this is the lone chromatin mark in the intergenic region (see Extended Data Fig. 3), it suggests that the variant may disrupt a CTCF-binding site and thereby influence transcription of surrounding genes.
Extended Data Figure 10
Extended Data Figure 10. Shape analysis in 1,541 young healthy subjects shows consistent deformations of the putamen regardless of segmentation protocol
a, b, The distance from a medial core to surfaces derived from FSL FIRST (a; identical to Fig. 2c) or FreeSurfer (b) segmentations was derived in the same 1,541 subjects. Each copy of the rs945270-C allele was significantly associated with an increased width in coloured areas (false discovery rate corrected at q = 0.05) and the degree of deformation is labelled by colour. The orientation is indicated by arrows. A, anterior; I, inferior; P, posterior; S, superior. Shape analysis in both software suites gives statistically significant associations in the same direction. Although the effects are more widespread in the FSL segmentations, FreeSurfer segmentations also show overlapping regions of effect, which appears strongest in anterior and superior sections.
Extended Data Figure 11
Extended Data Figure 11. The phenotypic variance explained by all common variants in this study
a, Twin-based heritability (with 95% confidence intervals), measuring additive genetic influences from both common and rare variation, is shown for comparison with common variant based heritability (see Methods). b, The median estimated percentage of phenotypic variance explained by all SNPs (and 95% confidence interval) is given for each brain structure studied. The full genome-wide association results from common variants explain approximately 7–15% of variance depending on the phenotype. c, The median estimated variance explained by each chromosome is shown for each phenotype. d, Some chromosomes explain more variance than would be expected by their length, for example chromosome 18 in the case of the putamen, which contains the DCC gene.
Figure 1
Figure 1. Common genetic variants associated with subcortical volumes and the ICV
Manhattan plots coloured with a scheme that matches the corresponding structure (middle) are shown for each subcortical volume studied. Genome-wide significance is shown for the common threshold of P = 5 × 10⁻⁸ (grey dotted line) and also for the multiple comparisons-corrected threshold of P = 7.1 × 10⁻⁹ (red dotted line). The most significant SNP within an associated locus is labelled.
Figure 2
Figure 2. Effect of rs945270 on KTN1 expression and putamen shape
a, b, Expression quantitative trait loci study in brain tissue demonstrates the effect of rs945270 on KTN1 gene expression in frontal cortex tissue from 304 subjects from the North American Brain Expression Cohort (NABEC) (a) and in an independent sample of 134 subjects from the UK Brain Expression Cohort (UKBEC) (b), sampled from both frontal cortex and putamen. Boxplot dashed bars mark the twenty-fifth and seventy-fifth percentiles. c, Surface-based analysis demonstrates that rs945270 has strong effects on the shape of superior and lateral portions of the putamen in 1,541 subjects. Each copy of the rs945270-C allele was significantly associated with increased width in coloured areas (false discovery rate corrected at q = 0.05), and the degree of deformation is labelled by colour, with red indicating greater deformation. Orientation is indicated by arrows. A, anterior; I, inferior; P, posterior, S, superior.

References

    1. Blokland GA, de Zubicaray GI, McMahon KL, Wright MJ. Genetic and environmental influences on neuroimaging phenotypes: a meta-analytical perspective on twin imaging studies. Twin Res Hum Genet. 2012;15:351–371. - PMC - PubMed
    1. Kravitz AV, et al. Regulation of parkinsonian motor behaviours by optogenetic control of basal ganglia circuitry. Nature. 2010;466:622–626. - PMC - PubMed
    1. Poldrack RA, et al. Interactive memory systems in the human brain. Nature. 2001;414:546–550. - PubMed
    1. Pessiglione M, Seymour B, Flandin G, Dolan RJ, Frith CD. Dopamine-dependent prediction errors underpin reward-seeking behaviour in humans. Nature. 2006;442:1042–1045. - PMC - PubMed
    1. Stein JL, et al. Identification of common variants associated with human hippocampal and intracranial volumes. Nature Genet. 2012;44:552–561. - PMC - PubMed

MeSH terms

Grants and funding