. 2015 Jan 20;42(1):186-98.
doi: 10.1016/j.immuni.2014.12.021. Epub 2014 Dec 25.

Enhancer sequence variants and transcription-factor deregulation synergize to construct pathogenic regulatory circuits in B-cell lymphoma

Affiliations

Enhancer sequence variants and transcription-factor deregulation synergize to construct pathogenic regulatory circuits in B-cell lymphoma

Olivia I Koues et al. Immunity. .

Abstract

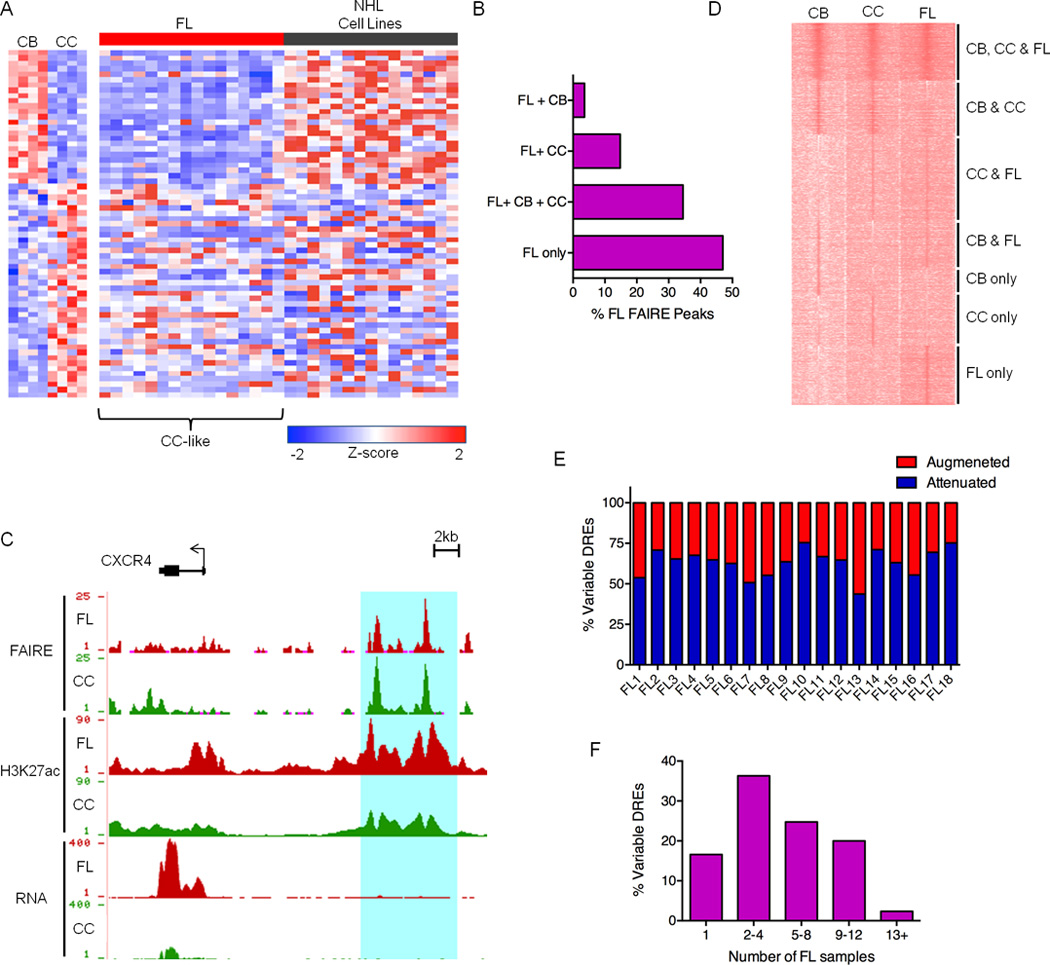
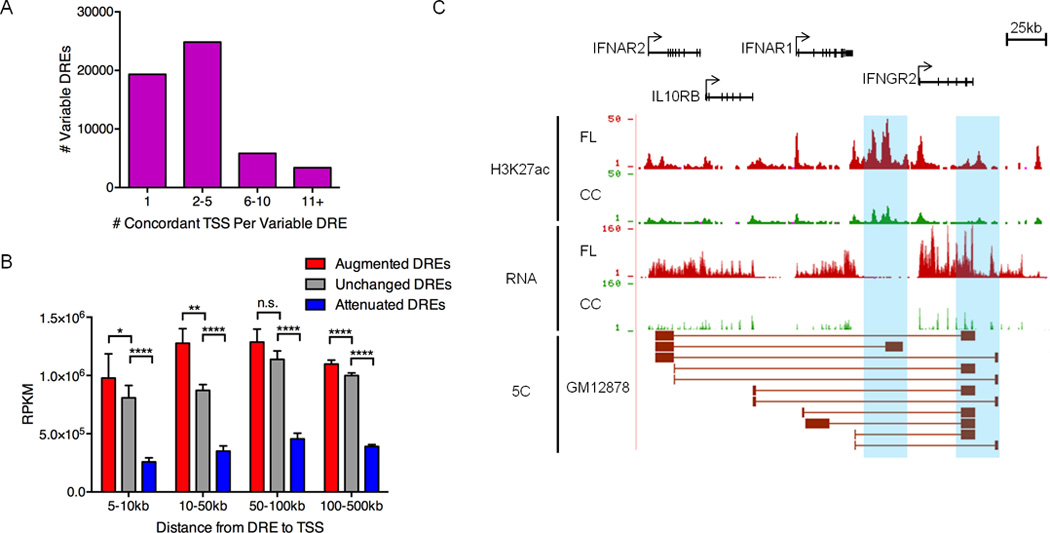
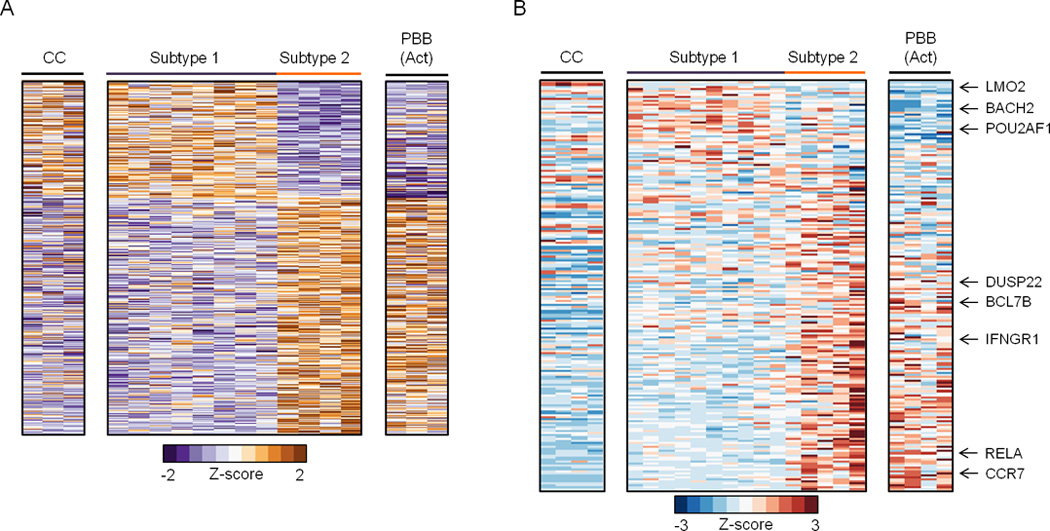
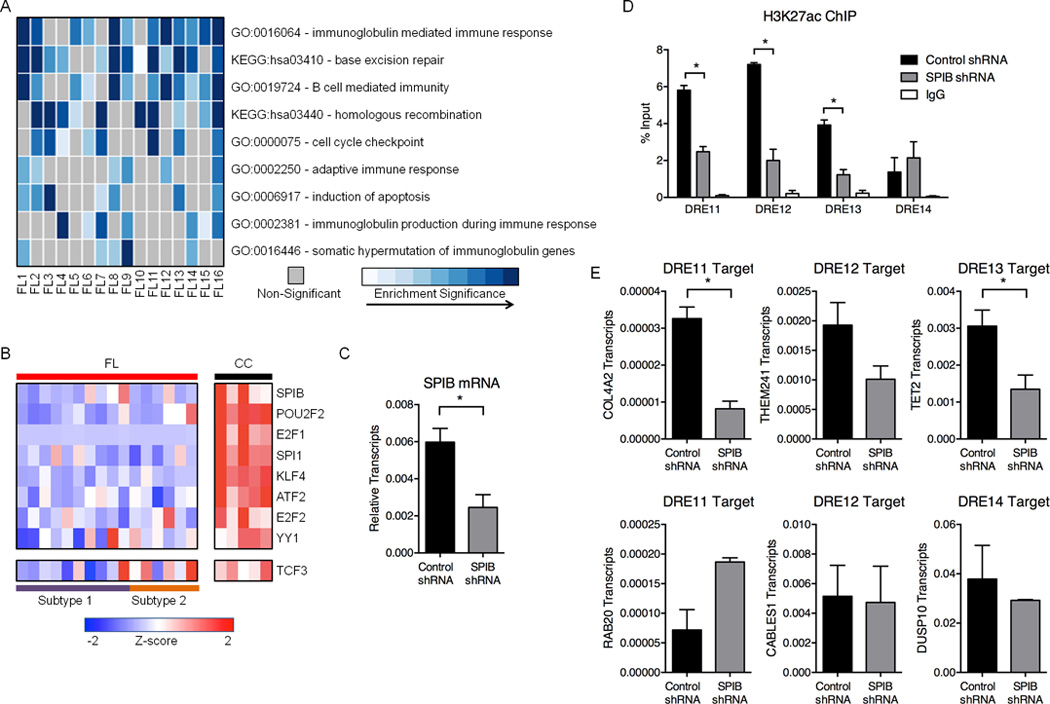
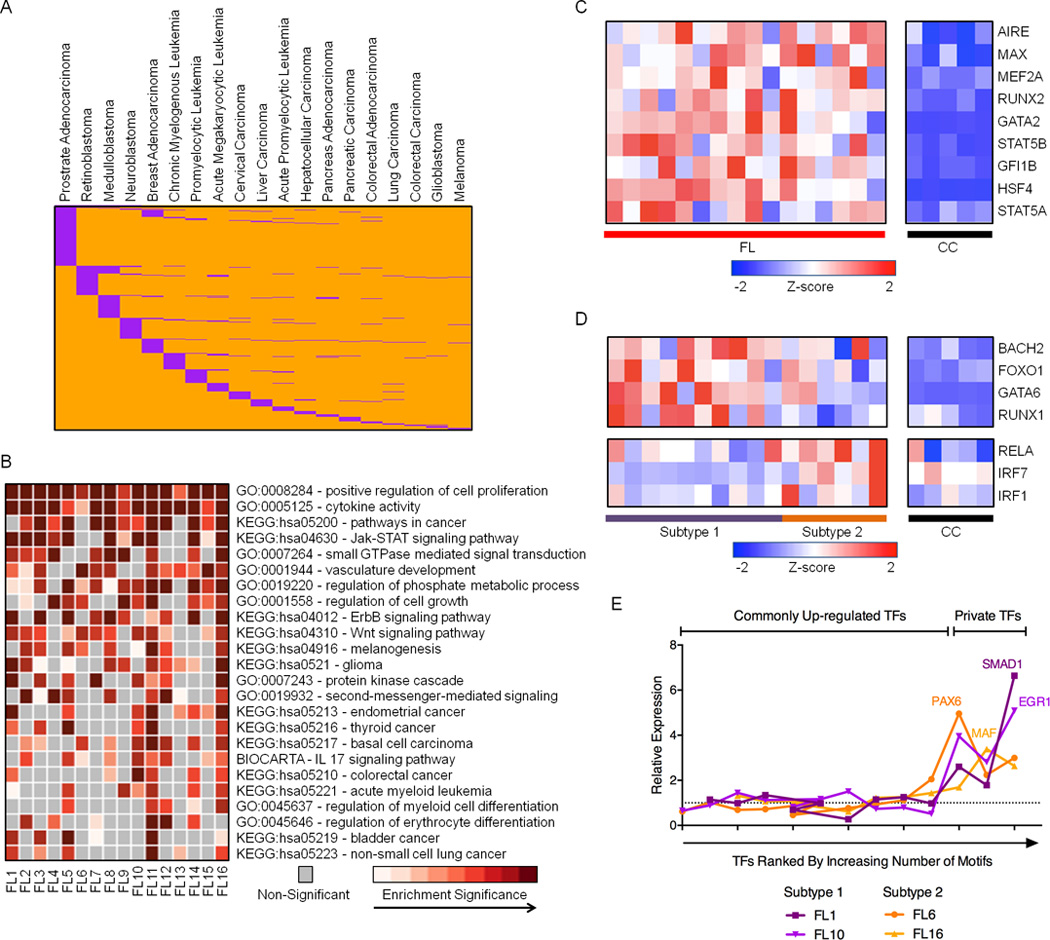
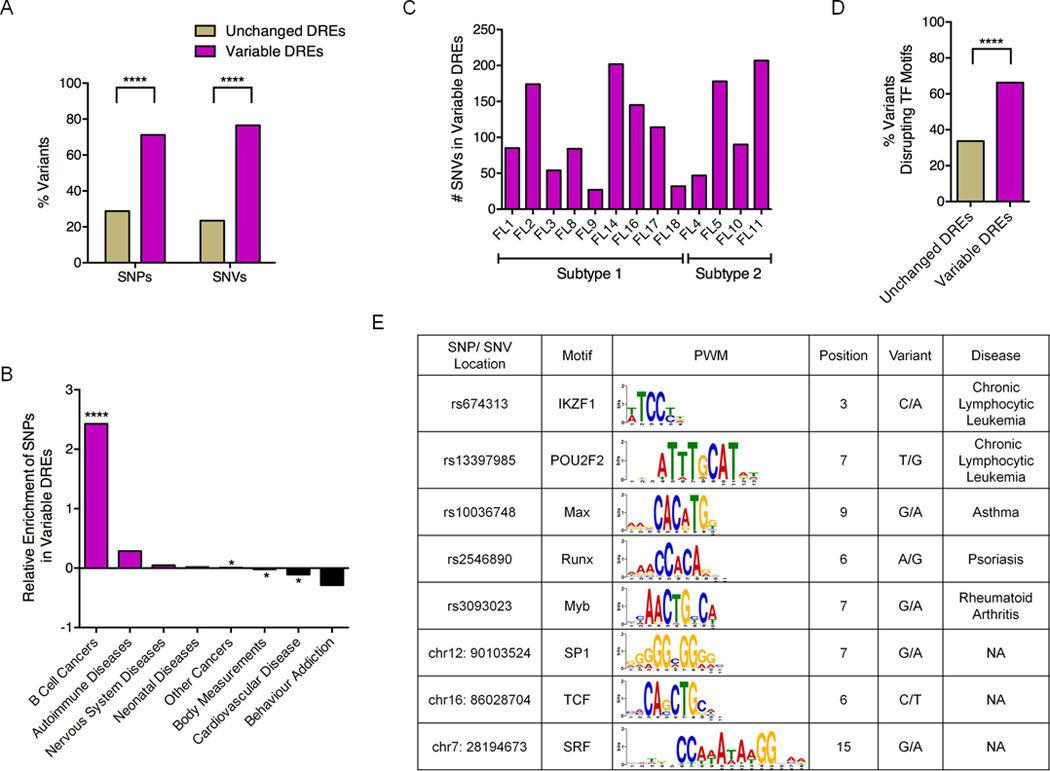
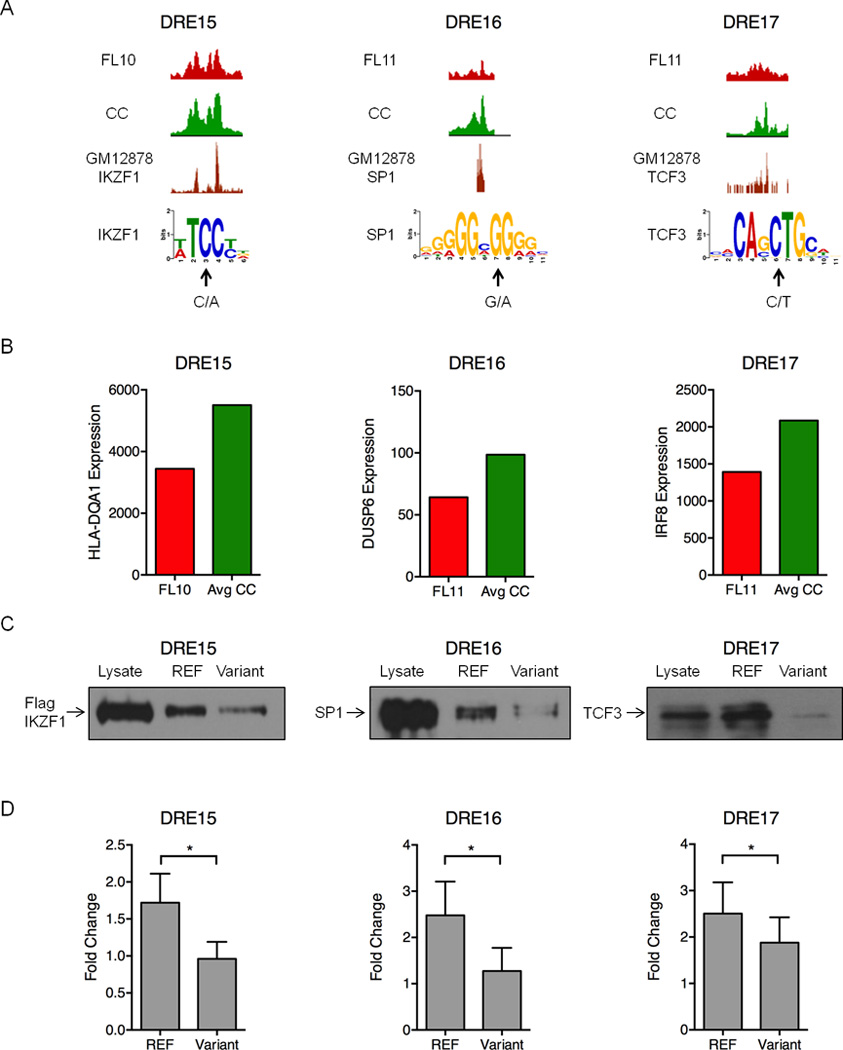
Most B-cell lymphomas arise in the germinal center (GC), where humoral immune responses evolve from potentially oncogenic cycles of mutation, proliferation, and clonal selection. Although lymphoma gene expression diverges significantly from GC B cells, underlying mechanisms that alter the activities of corresponding regulatory elements (REs) remain elusive. Here we define the complete pathogenic circuitry of human follicular lymphoma (FL), which activates or decommissions REs from normal GC B cells and commandeers enhancers from other lineages. Moreover, independent sets of transcription factors, whose expression was deregulated in FL, targeted commandeered versus decommissioned REs. Our approach revealed two distinct subtypes of low-grade FL, whose pathogenic circuitries resembled GC B or activated B cells. FL-altered enhancers also were enriched for sequence variants, including somatic mutations, which disrupt transcription-factor binding and expression of circuit-linked genes. Thus, the pathogenic regulatory circuitry of FL reveals distinct genetic and epigenetic etiologies for GC B-cell transformation.


Figures

Figure 1
Figure 1. The Centrocyte Origins and Alterations to the FL Regulome
A) Expression profiles of FL and NHL cell lines for a panel of genes differentially expressed in CB versus CC. B) Bar graph showing unique and shared FAIRE peaks in FL and GC-B cell populations. C) UCSC Genome Browser views of FAIRE-Seq, H3K27ac ChIP-Seq and RNA-Seq data from FL and CC samples, illustrating a collection of DREs located near the CXCR4 gene. FAIRE and ChIP data are presented as number of reads per million mapped reads and plotted on an axis of 1–25 (FAIRE) and 1–90 (H3K27ac). RNA data are presented as number of aligned, in silico extended reads per 10 bp, on a scale of 1–400 reads. D) H3K27ac ChIP-Seq intensities for DREs in representative CB, CC, and FL samples. Data are presented as k-means clustering of tag densities per 200 bp within a window of 10 kb around the DREs. E) Percent of variable DREs with ≥ 2-fold increase (augmented) or decrease (attenuated) in FAIRE-seq, H3ac ChIP-seq or H3K27ac ChIP-seq signal for FL samples relative to CC. F) Recurrence rates of variable DREs depicted by proportion detected in number of FL samples.
Figure 2
Figure 2. Pathogenic circuitry of FL
A) Number of TSSs with chromatin fold-change that is concordant with nearby variable DREs (within 500kb). B) Mean transcript abundance as determined by RNA-Seq for genes linked to augmented, unchanged or attenuated DREs and located within the distances shown from the DREs. Statistical significance (Mann-Whitney test): *p≤ 0.05 ** p≤ 0.01, **** p≤ 0.0001. C) UCSC Genome Browser views of H3K27ac ChIP-seq data, showing augmented DREs (highlighted in blue). RNA-seq data depict the corresponding up-regulation of mRNA from DRE target genes. The bottom track shows significant spatial interactions in GM12878 B cells (ENCODE, 5C data) between restriction fragments encompassing the DREs and restriction fragments near the target gene TSSs (Sanyal et al., 2012).
Figure 3
Figure 3. Epigenome-centric analyses reveal distinct FL subtypes
A) Heatmap for variable DREs with significantly different levels of open chromatin (FAIRE, normalized reads), which separate FL into two subtypes. B) Heatmap for genes that are differentially expressed in distinct stages of B cell activation or differentiation (Longo et al., 2009) as determined by Gene Set Enrichment Analysis of microarray data (FDR q<0.0001, GSEA).
Figure 4
Figure 4. FL suppresses REs associated with GC identity
A) Heatmap representation of enriched Gene Ontology (GO) terms and Kyoto Encyclopedia of Genes and Genomes (KEGG) pathways identified from down-regulated genes within 500kb of attenuated DREs. B) Expression profiles (microarray) for TFs predicted to bind motifs in attenuated DREs. Refer to Table S6 for expression values. C) SPIB transcripts, as measured by qPCR, in GM12878 cells transfected with either control or SPIB shRNA. Results represent the mean ± SEM of three independent experiments. D) H3K27ac ChIP assays in GM12878 cells transfected with control or SPIB-specific shRNA. Associated DNA was analyzed via qPCR using primers spanning DREs harboring SPIB binding sites. Results represent the mean ± SEM of three independent experiments. E) Transcript levels for DRE target genes, as measured by qPCR, in GM12878 cells transfected with either control or SPIB-specific shRNA. Results represent the mean ± SEM of three independent experiments. Statistical significance (unpaired t-test): * p≤ 0.05.
Figure 5
Figure 5. Novel DREs in pathogenic FL regulatory circuits
A) Distribution of 706 de novo DREs (orange) that overlap REs in other cancer types (purple). B) Heatmap representation of enriched GO terms and KEGG pathways identified from up-regulated genes within 500kb of de novo DREs. C) RNA expression profiles (microarray) for TFs predicted to bind de novo DREs that are consistently up-regulated in FL samples. Refer to Table S6 for expression values. D) RNA expression profiles (microarray data) for TFs predicted to bind de novo DREs that are differentially up-regulated in either subtype 1 or subtype 2 FL. Refer to Table S6 for expression values. E) Relative expression of TFs, ranked by number of corresponding TF motifs within private DREs, in individual FL samples compared to the average expression in all FL. Additional data are shown in Figure S4C.
Figure 6
Figure 6. Variable DREs are enriched for inherited and acquired sequence variants
A) Percentage of variable and unchanged DREs with either SNPs and SNVs. B) Enrichment or depletion of disease- or trait-associated SNPs in variable DREs. C) Number of SNVs within variable DREs in each FL sample. D) Fraction of sequence variants that disrupt TF motifs in unchanged versus variable DREs. Statistical significance for panels A, B, and D (χ2 test): **** p≤ 0.0001. E) Representative disease-associated SNPs and SNVs predicted to disrupt TF motifs.
Figure 7
Figure 7. Polymorphisms and mutations in FL-altered DREs disrupt enhancer function
A) UCSC Genome Browser views of H3K27ac ChIP-seq data illustrating attenuated DREs harboring the indicated sequence variants in FL and the reference sequence in CC (upper 2 tracks). The bottom track shows ChIP-seq data for the indicated TFs performed in the GM12878 B cell line (Neph et al., 2012). Arrows indicate the variant sequence and location in PWMs for each TF. B) Expression of the DRE target genes quantified by microarray analysis. C) Oligonucleotide precipitation assays demonstrate reduced TF binding in variant-containing compared to reference sequences. Western blots were probed with antibodies specific to the TF of interest (representative of three experimental replicates). D) Luciferase reporter assays performed in lymphoma cell lines demonstrate significantly reduced activity for the variant-containing compared to reference sequences in the attenuated DREs. Luciferase activity is presented as a fold change for the enhancer vector relative to a reporter containing only the SV40 promoter (set to a value of 1.0). Results represent the mean ± SEM of three independent experiments. Statistical significance (paired t-test): * p≤ 0.05.

References

    1. Akhtar-Zaidi B, Cowper-Sal-lari R, Corradin O, Saiakhova A, Bartels CF, Balasubramanian D, Myeroff L, Lutterbaugh J, Jarrar A, Kalady MF, et al. Epigenomic enhancer profiling defines a signature of colon cancer. Science. 2012;336:736–739. - PMC - PubMed
    1. Alizadeh AA, Eisen MB, Davis RE, Ma C, Lossos IS, Rosenwald A, Boldrick JC, Sabet H, Tran T, Yu X, et al. Distinct types of diffuse large B-cell lymphoma identified by gene expression profiling. Nature. 2000;403:503–511. - PubMed
    1. Allen CDC, Okada T, Cyster JG. Germinal-center organization and cellular dynamics. Immunity. 2007;27:190–202. - PMC - PubMed
    1. Archer MC. Role of sp transcription factors in the regulation of cancer cell metabolism. Genes Cancer. 2011;2:712–719. - PMC - PubMed
    1. Argiropoulos B, Humphries RK. Hox genes in hematopoiesis and leukemogenesis. Oncogene. 2007;26:6766–6776. - PubMed

Publication types

Substances

Associated data