

TXNDC17 promotes paclitaxel resistance via inducing autophagy in ovarian cancer
- PMID: 25607466
- PMCID: PMC4502659
- DOI: 10.1080/15548627.2014.998931
TXNDC17 promotes paclitaxel resistance via inducing autophagy in ovarian cancer
Abstract
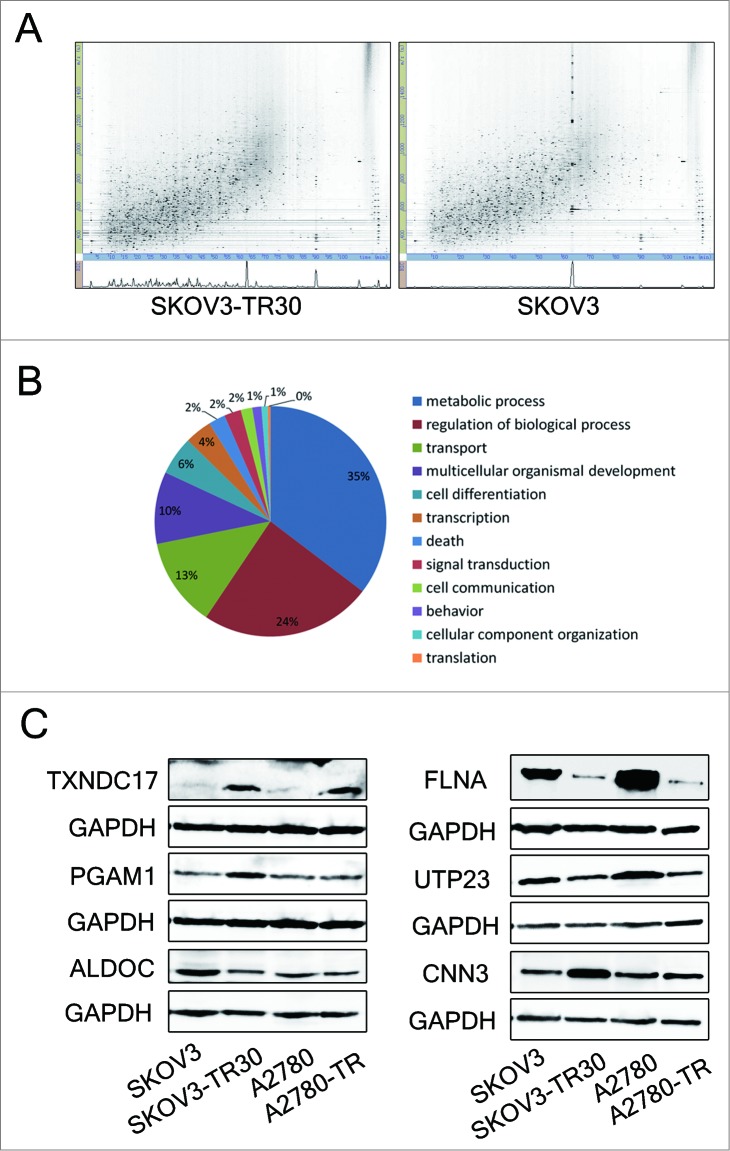
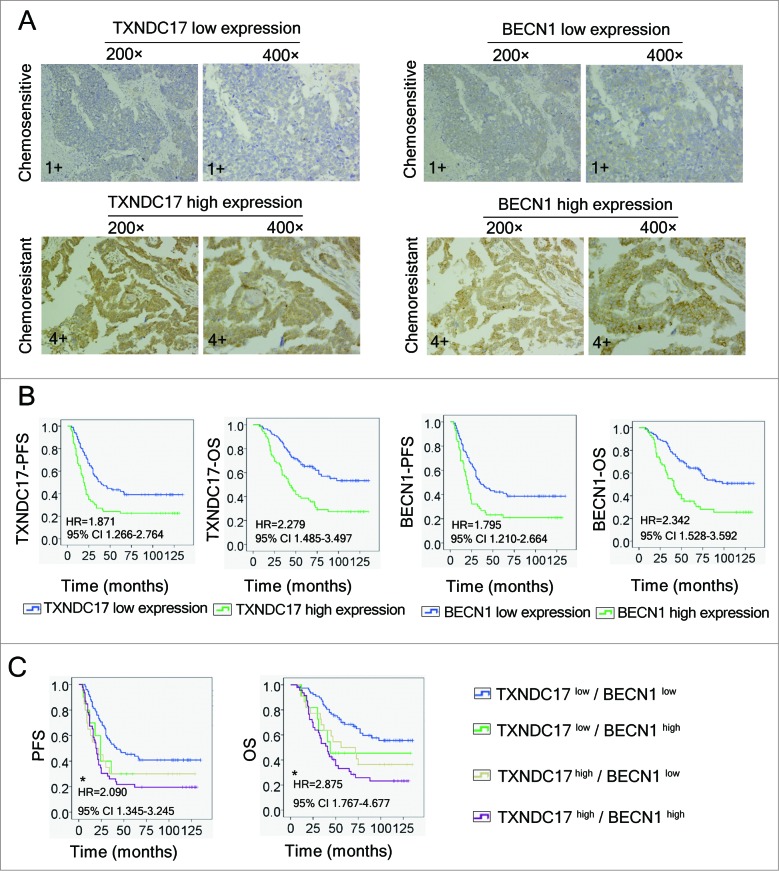
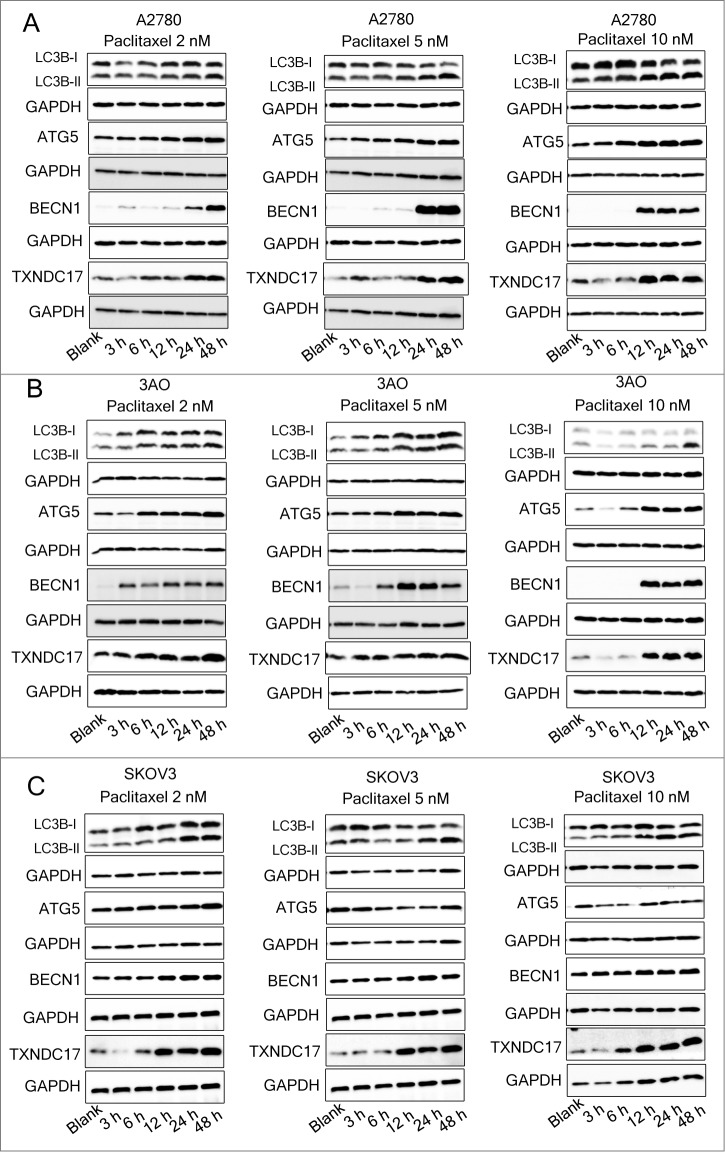
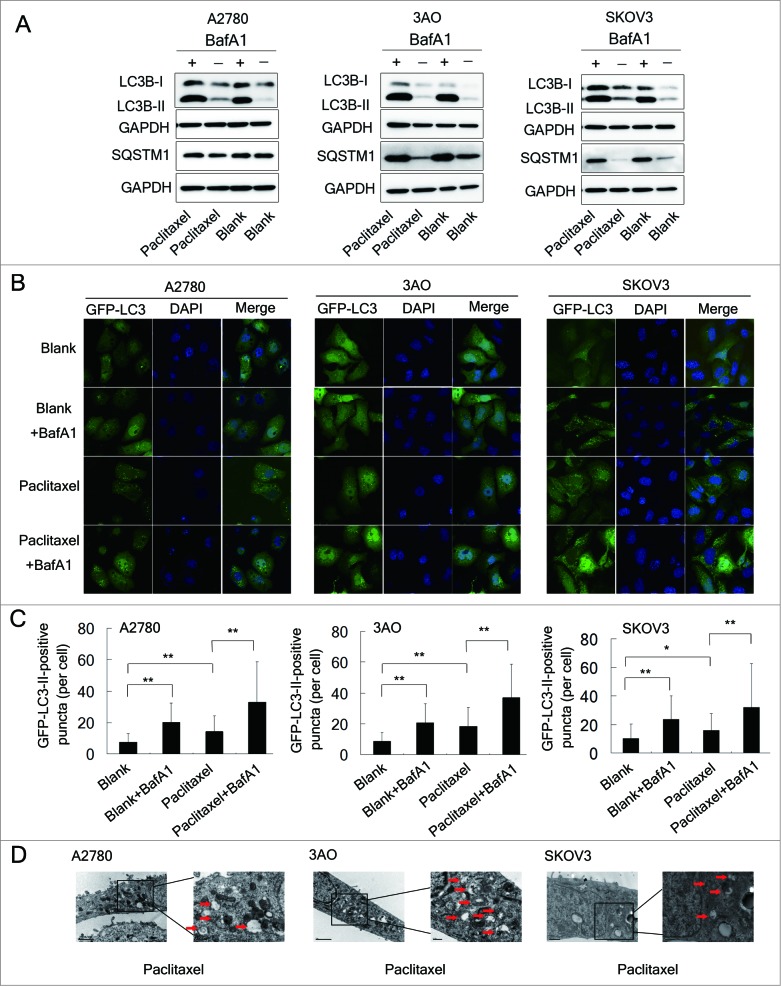
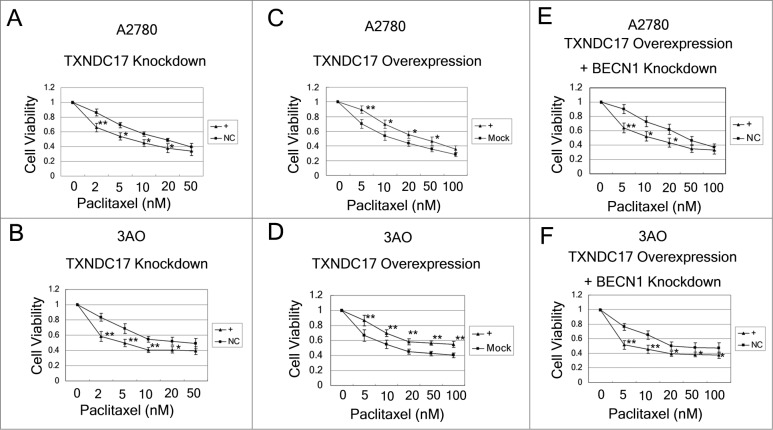
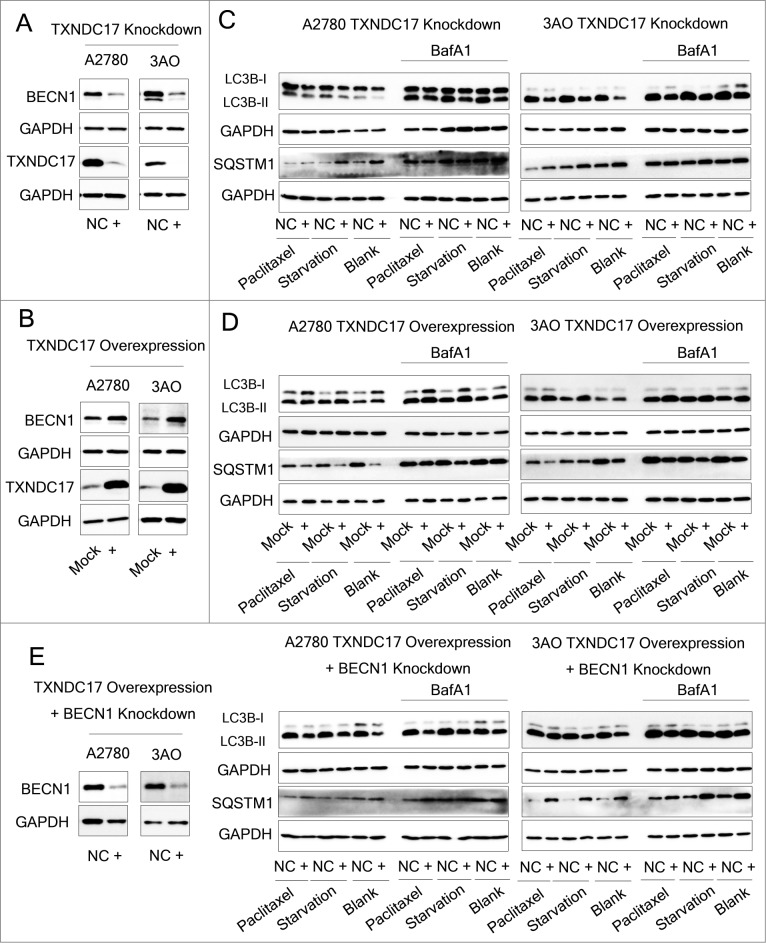
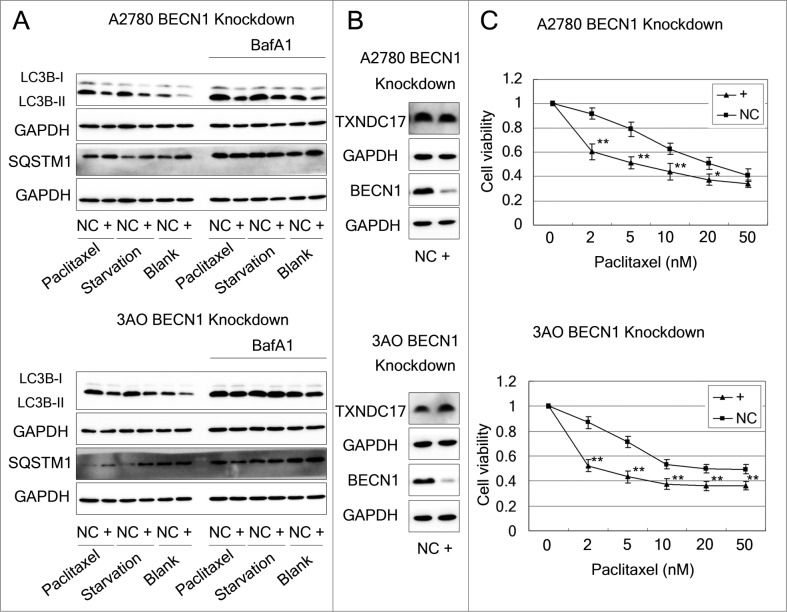
Paclitaxel is recommended as a first-line chemotherapeutic agent against ovarian cancer, but drug resistance becomes a major limitation of its success clinically. The key molecule or mechanism associated with paclitaxel resistance in ovarian cancer still remains unclear. Here, we showed that TXNDC17 screened from 356 differentially expressed proteins by LC-MS/MS label-free quantitative proteomics was more highly expressed in paclitaxel-resistant ovarian cancer cells and tissues, and the high expression of TXNDC17 was associated with poorer prognostic factors and exhibited shortened survival in 157 ovarian cancer patients. Moreover, paclitaxel exposure induced upregulation of TXNDC17 and BECN1 expression, increase of autophagosome formation, and autophagic flux that conferred cytoprotection for ovarian cancer cells from paclitaxel. TXNDC17 inhibition by siRNA or enforced overexpression by a pcDNA3.1(+)-TXNDC17 plasmid correspondingly decreased or increased the autophagy response and paclitaxel resistance. Additionally, the downregulation of BECN1 by siRNA attenuated the activation of autophagy and cytoprotection from paclitaxel induced by TXNDC17 overexpression in ovarian cancer cells. Thus, our findings suggest that TXNDC17, through participation of BECN1, induces autophagy and consequently results in paclitaxel resistance in ovarian cancer. TXNDC17 may be a potential predictor or target in ovarian cancer therapeutics.
Keywords: 95% CI, 95% confidence interval; ALDOC, aldolase C, fructose-bisphosphate; ATG5, autophagy-related 5; BECN1; BECN1, Beclin 1, autophagy-related; BafA1, bafilomycin A1; CNN3, calponin 3, acidic; DAPI, 4', 6-diamidino-2-phenylindole; FLNA, filamin A, α; GO, gene ontology; GenMAPP, gene microarray pathway profiler; HBSS, Hank's balanced salt solution; HR, hazard ratio; KEGG, Kyoto encyclopedia of genes and genome; LC-MS/MS, liquid chromatography-mass spectrometry/ mass spectrometry; MAP1LC3B/LC3B, microtubule-associated protein 1 light chain 3 β; OS, overall survival; PFS, progression-free survival; PGAM1, phosphoglycerate mutase 1 (brain); SQSTM1, sequestosome 1; TNF, tumor necrosis factor; TXN, thioredoxin; TXNDC17; TXNDC17, thioredoxin domain containing 17; UTP23, small subunit (SSU) processome component, homolog (yeast); autophagy; ovarian cancer; paclitaxel resistance; siRNA, short interfering RNA.
Figures
Similar articles
-
PAWR-mediated suppression of BCL2 promotes switching of 3-azido withaferin A (3-AWA)-induced autophagy to apoptosis in prostate cancer cells.Autophagy. 2015;11(2):314-31. doi: 10.1080/15548627.2015.1017182. Autophagy. 2015. PMID: 25803782 Free PMC article.
-
Autophagy regulator BECN1 suppresses mammary tumorigenesis driven by WNT1 activation and following parity.Autophagy. 2014;10(11):2036-52. doi: 10.4161/auto.34398. Epub 2014 Oct 30. Autophagy. 2014. PMID: 25483966 Free PMC article.
-
Cocaine-mediated microglial activation involves the ER stress-autophagy axis.Autophagy. 2015;11(7):995-1009. doi: 10.1080/15548627.2015.1052205. Autophagy. 2015. PMID: 26043790 Free PMC article.
-
Impaired autophagy and APP processing in Alzheimer's disease: The potential role of Beclin 1 interactome.Prog Neurobiol. 2013 Jul-Aug;106-107:33-54. doi: 10.1016/j.pneurobio.2013.06.002. Epub 2013 Jul 1. Prog Neurobiol. 2013. PMID: 23827971 Review.
-
Src family kinases and paclitaxel sensitivity.Cancer Biol Ther. 2011 Aug 15;12(4):260-9. doi: 10.4161/cbt.12.4.16430. Epub 2011 Aug 15. Cancer Biol Ther. 2011. PMID: 21646863 Free PMC article. Review.
Cited by
-
Mechanism of Drug Resistance to First-Line Chemotherapeutics Mediated by TXNDC17 in Neuroblastomas.Cancer Rep (Hoboken). 2024 Oct;7(10):e70033. doi: 10.1002/cnr2.70033. Cancer Rep (Hoboken). 2024. PMID: 39411839 Free PMC article.
-
miR-219-5p attenuates cisplatin resistance of ovarian cancer by inactivating Wnt/β-catenin signaling and autophagy via targeting HMGA2.Cancer Gene Ther. 2023 Apr;30(4):596-607. doi: 10.1038/s41417-022-00574-y. Epub 2022 Dec 9. Cancer Gene Ther. 2023. PMID: 36494581
-
Identification and validation of a five-gene prognostic signature based on bioinformatics analyses in breast cancer.Heliyon. 2023 Jan 27;9(2):e13185. doi: 10.1016/j.heliyon.2023.e13185. eCollection 2023 Feb. Heliyon. 2023. PMID: 36747547 Free PMC article.
-
Targeting Drug Chemo-Resistance in Cancer Using Natural Products.Biomedicines. 2021 Sep 29;9(10):1353. doi: 10.3390/biomedicines9101353. Biomedicines. 2021. PMID: 34680470 Free PMC article. Review.
-
High Thioredoxin Domain-Containing Protein 11 Expression Is Associated with Tumour Progression in Glioma.Int J Mol Sci. 2023 Aug 29;24(17):13367. doi: 10.3390/ijms241713367. Int J Mol Sci. 2023. PMID: 37686174 Free PMC article.
References
-
- Siegel R, Naishadham D, Jemal A. Cancer statistics, 2012. CA Cancer J Clin 2012; 62:10-29; PMID:22237781; http://dx.doi.org/10.3322/caac.20138 - DOI - PubMed
-
- Berek JS, Bertelsen K, du Bois A, Brady MF, Carmichael J, Eisenhauer EA, Gore M, Grenman S, Hamilton TC, Hansen SW, et al. . Advanced epithelial ovarian cancer: 1998 consensus statements. Ann Oncol 1999; 10 1:87-92; PMID:10219460; http://dx.doi.org/10.1023/A:1008323922057 - DOI - PubMed
-
- Raja FA, Counsell N, Colombo N, Pfisterer J, du Bois A, Parmar MK, Vergote IB, Gonzalez-Martin A, Alberts DS, Plante M, et al. . Platinum versus platinum-combination chemotherapy in platinum-sensitive recurrent ovarian cancer: a meta-analysis using individual patient data. Ann Oncol 2013; 24:3028-34; PMID:24190964; http://dx.doi.org/10.1093/annonc/mdt406 - DOI - PubMed
-
- Aletti GD, Gallenberg MM, Cliby WA, Jatoi A, Hartmann LC. Current management strategies for ovarian cancer. Mayo Clin Proc 2007; 82:751-70; PMID:17550756; http://dx.doi.org/10.1016/S0025-6196(11)61196-8 - DOI - PubMed
-
- Hall M, Gourley C, McNeish I, Ledermann J, Gore M, Jayson G, Perren T, Rustin G, Kaye S. Targeted anti-vascular therapies for ovarian cancer: current evidence. Br J Cancer 2013; 108:250-8; PMID:23385789; http://dx.doi.org/10.1038/bjc.2012.541 - DOI - PMC - PubMed
Publication types
MeSH terms
Substances
LinkOut - more resources
Full Text Sources
Other Literature Sources
Medical
Molecular Biology Databases
Research Materials
Miscellaneous