. 2015 Jan 21:6:6002.
doi: 10.1038/ncomms7002.

Sequencing of first-strand cDNA library reveals full-length transcriptomes

Affiliations

Sequencing of first-strand cDNA library reveals full-length transcriptomes

Saurabh Agarwal et al. Nat Commun. .

Abstract

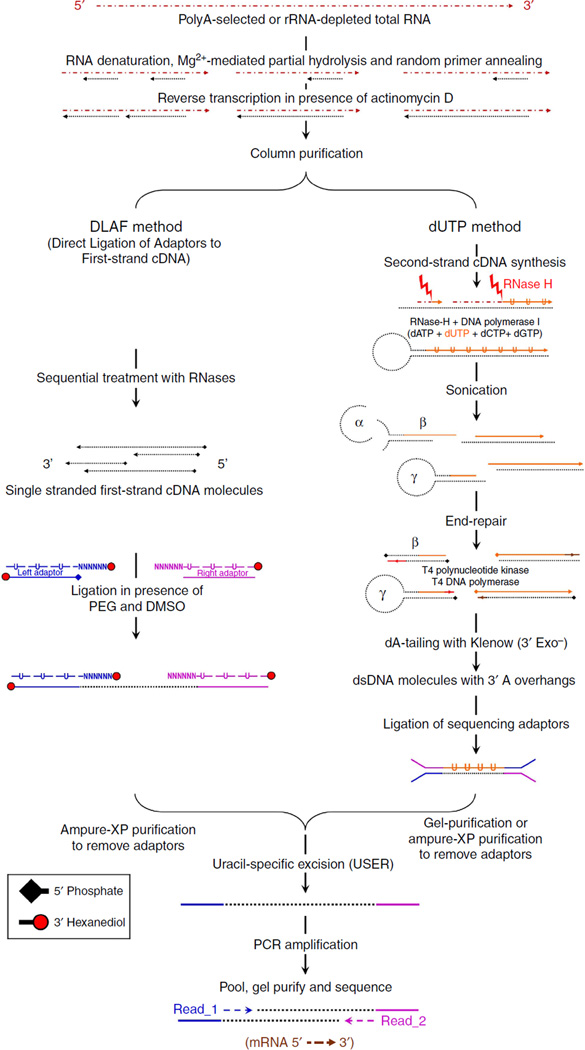
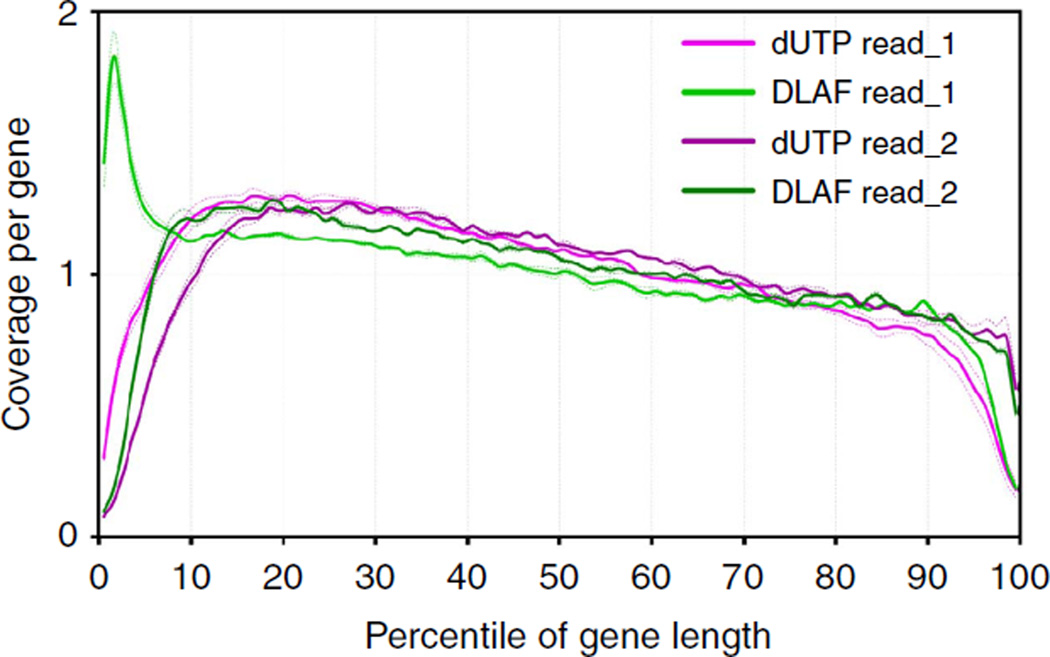
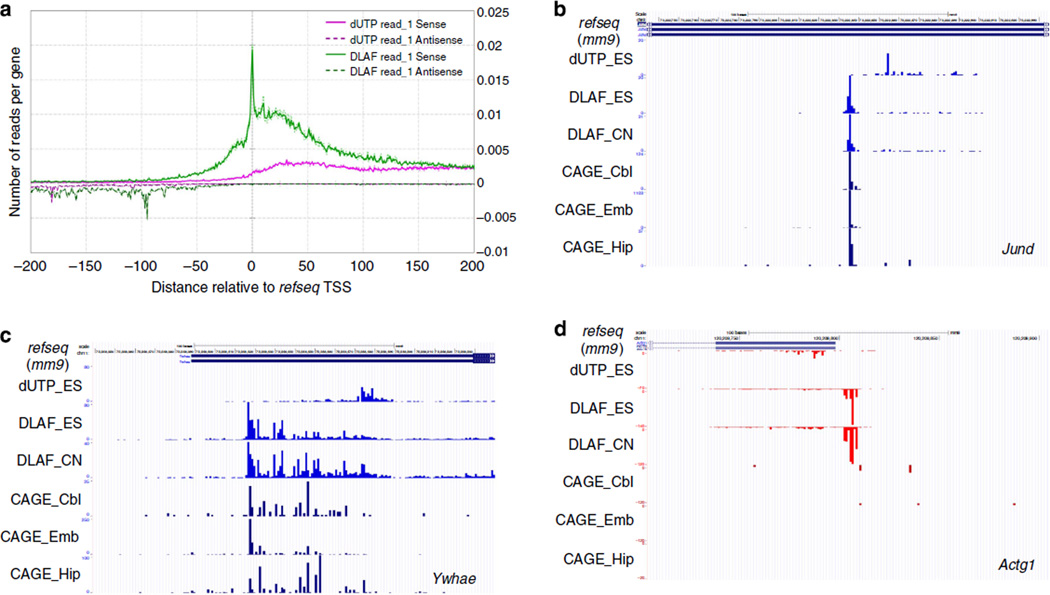
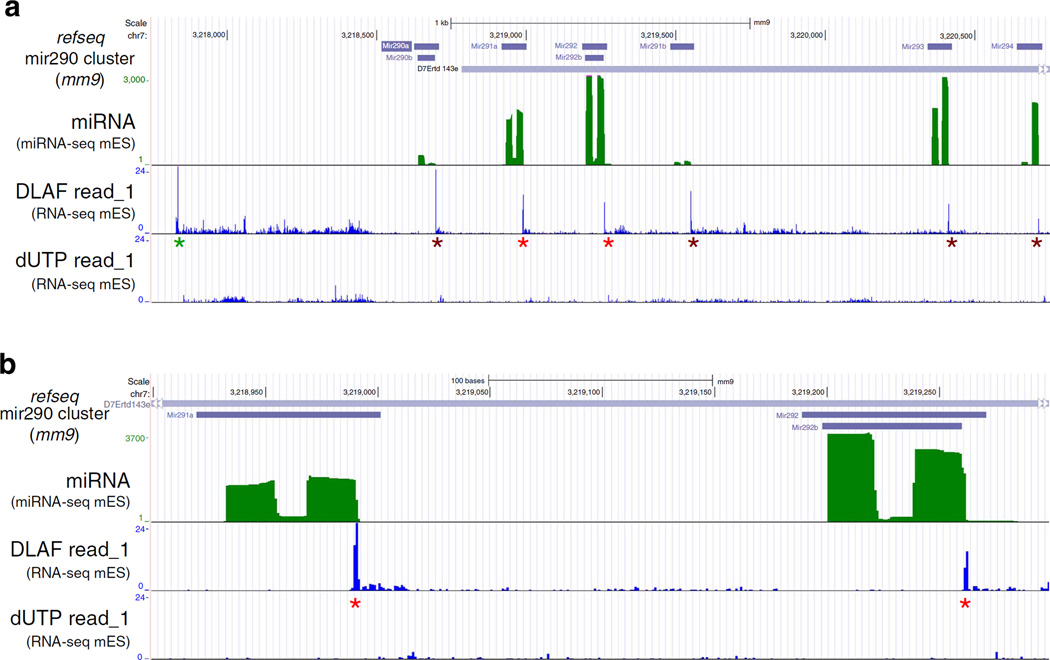
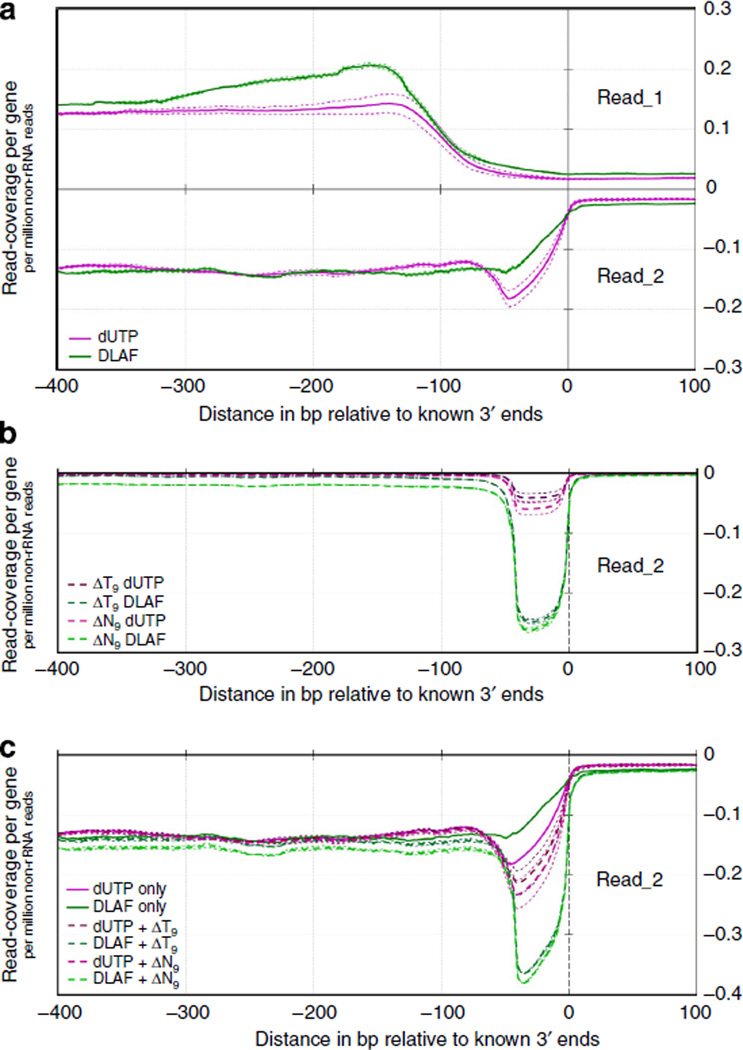
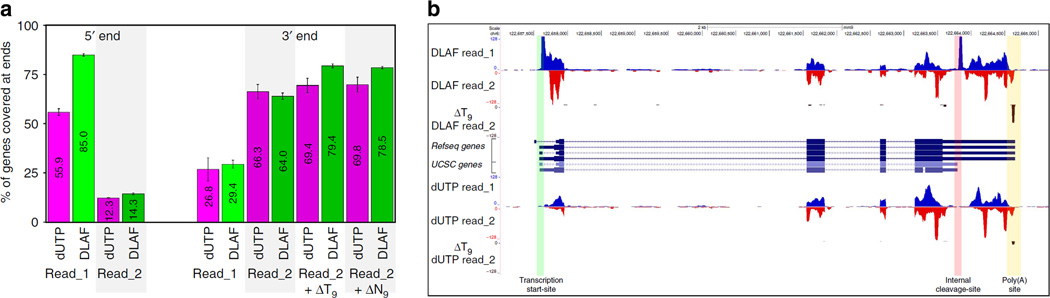
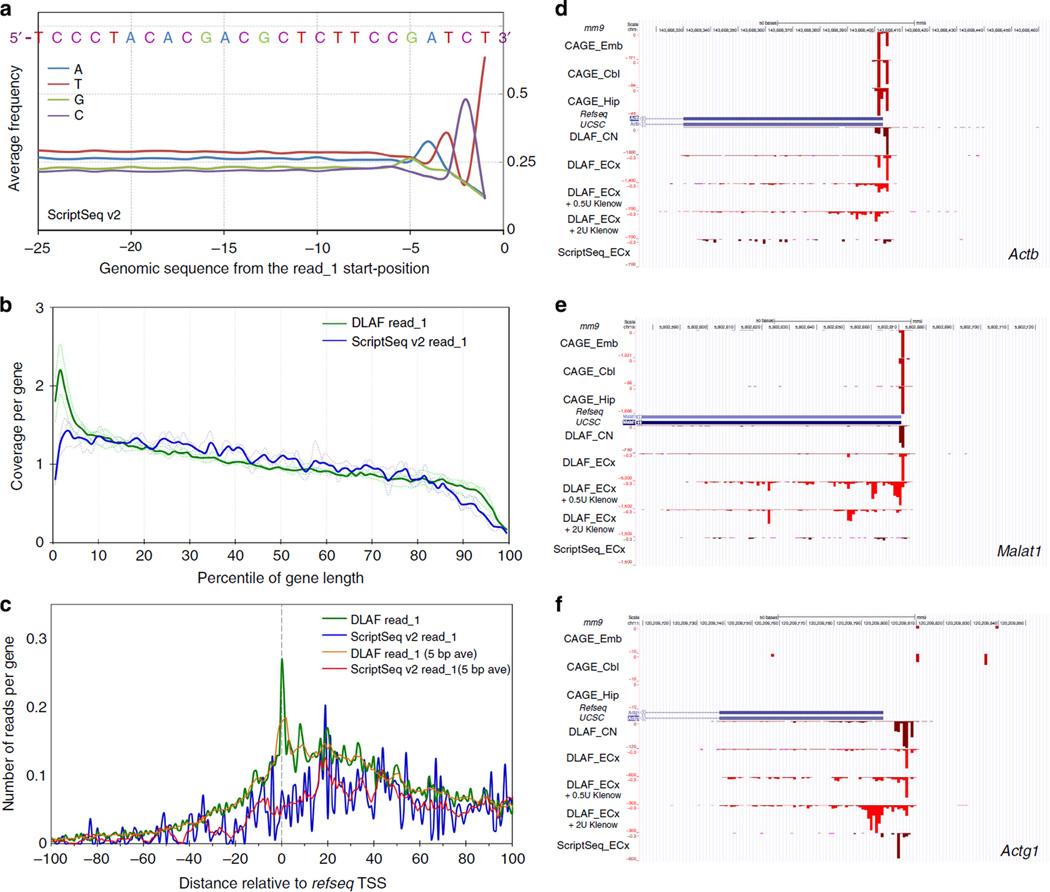
Massively parallel strand-specific sequencing of RNA (ssRNA-seq) has emerged as a powerful tool for profiling complex transcriptomes. However, many current methods for ssRNA-seq suffer from the underrepresentation of both the 5' and 3' ends of RNAs, which can be attributed to second-strand cDNA synthesis. The 5' and 3' ends of RNA harbour crucial information for gene regulation; namely, transcription start sites (TSSs) and polyadenylation sites. Here we report a novel ssRNA-seq method that does not involve second-strand cDNA synthesis, as we Directly Ligate sequencing Adaptors to the First-strand cDNA (DLAF). This novel method with fewer enzymatic reactions results in a higher quality of the libraries than the conventional method. Sequencing of DLAF libraries followed by a novel analysis pipeline enables the profiling of both 5' ends and polyadenylation sites at near-base resolution. Therefore, DLAF offers the first genomics tool to obtain the 'full-length' transcriptome with a single library.


Figures

Figure 1
Figure 1. A schematic comparison between the experimental workflows of the DLAF and dUTP methods
The rRNA-depleted or polyA-enriched RNA is reverse transcribed in the presence of actinomycin D. In DLAF, the double-stranded adaptors with overhangs are ligated to single-stranded cDNA molecules. The forward strands of adaptors containing dU residues are removed by USER, and the libraries are amplified by PCR. In the dUTP method, second-strand cDNA is synthesized in the presence of dUTP and fragmented by sonication, followed by the standard Illumina library preparation procedure and subsequent degradation of dU-containing second strands by USER. Read_1 indicates the reads in the direction of transcription. Read_2 indicates the reads sequenced from the other end of the cDNA molecules.
Figure 2
Figure 2. RNA-SeQC analysis of coverage along the length of transcripts
Relative coverage for each percentile of gene length for the 5,000 middle-expressed genes in each library. Data are shown for individual replicates (dashed lines) and averaged replicates (solid line) from WT mES cells. RNA-SeQC coverage is shown normalized to the total number of reads mapping to the 5,000 middle-expressed genes. DLAF read_1 shows a distinct enrichment at the 5′ end of the genes, whereas dUTP read_1 shows depletion. Read_2 in both methods shows similar coverage throughout the length of the genes.
Figure 3
Figure 3. DLAF results in an enrichment of TSSs at near-base resolution comparable to CAGE
(a) Coverage by the first-sequenced nucleotides of read_1 is plotted across the transcription start sites (TSSs) for the 5,000 middle-expressed genes from WT mES cells. Reads aligning to the antisense strand are plotted on the negative y axis. DLAF read_1 shows a profound enrichment at the annotated TSSs. (b–d) Comparison to DeepCAGE data. Starting positions of DLAF read_1 show the maxima at the 0 and −1 positions relative to the CAGE peaks. Peaks of DLAF read_1 near the TSSs of Jund (b) and Ywhae (c) from mES cells (ES) and mouse cortical neurons (CN) coincide with the published CAGE peaks derived from the cerebellum (Cbl), embryo (Emb) and hippocampus (Hip). CAGE does not detect the TSSs of some genes, such as Actg1 (d). Coverage is normalized to the total non-rRNA and non-mtRNA reads for the dUTP and DLAF libraries.
Figure 4
Figure 4. DLAF detects non-capped 5′ ends of RNA generated by regulatory cleavage
(a) University of California, Santa Cruz (UCSC) genome browser view of the Mir290 cluster in WT mES cells showing the cleavage events of the primary miRNA (pri-miRNA) during miRNA biogenesis. Green: miRNA-Seq signal. Blue: first sequenced nucleotides of read_1 from the DLAF and dUTP libraries. A distal DLAF peak may represent a previously unknown TSS of pre-miRNA of the Mir290 cluster (green asterisk). Peaks of DLAF read_1-starts precisely match to internal cleavage sites on pri-miRNA (red and brown asterisks). Such peaks were not detected by the dUTP method. (b) Magnified view of two miRNAs, Mir291a and Mir292b (red asterisks). The peaks of DLAF read-starts are located at the nucleotide next to the 3′ end of each miRNA, indicating that DLAF results in the precise detection of 5′ ends of RNA fragments generated during processing of pri-miRNAs. Coverage is normalized to the total non-rRNA and non-mtRNA reads for the dUTP and DLAF libraries.
Figure 5
Figure 5. Coverage of 3′ ends of genes and identification of polyadenylation sites via novel analysis
(a) Read coverage is shown near the annotated 3′ ends of the 5,000 middle-expressed genes in the DLAF and dUTP libraries. (b) Remapping reads after base trimming. Unmapped read_2 starting with a T9-stretch were selected; then, T9 was removed (ΔT9) and remapped. As a control, data are also shown after trimming 9 bases (ΔN9) from all unmapped read_2. (c) Combined signals of initially mapped read_2 and remapped read_2 after base trimming. Coverage is shown as per gene per million non-rRNA reads. Data for individual replicates are shown as thin lines.
Figure 6
Figure 6. DLAF results in end-to-end coverage of transcriptome
(a) Percentage of genes covered at 5′ and 3′ ends. RNA-SeQC data are shown for the 2,500 middle-expressed genes in WT mES cells. Data are shown for 12.5 million randomly selected non-rRNA and non-mtRNA reads. Average of two biological replicates is shown and error-bars indicate the range of data. (b) Image from the UCSC genome browser of the Nanog locus. DLAF read_1 shows a distinct coverage at the annotated TSS (green border) and an internal CS (pink border). Remapping of DLAF read_2 after ΔT9 analysis identified the polyadenylation site (yellow border). Signals are normalized to the total number of non-rRNA and non-mtRNA reads from each library.
Figure 7
Figure 7. Comparative analysis of ScriptSeq and DLAF libraries prepared from mouse embryonic cortices (ECx)
(a) Base frequency in the genomic sequences upstream of read_1 in ScriptSeq libraries. Data are averaged from three biological replicates. The sequence shows a clear bias towards GATCT, which is similar to a part of template-switching oligo. (b) Coverage along the length of transcripts. RNA-SeQC coverage for each percentile of gene length is shown for the 5,000 middle-expressed genes. The coverage is normalized to the total number of reads mapping to the 5,000 middle-expressed genes in each library. (c) Distribution of the first-sequenced nucleotides of read_1. The first bases are plotted across the TSSs. Yellow (DLAF) and red (ScriptSeq) lines are 5-base moving average. DLAF read_1 but not ScriptSeq shows a peak around +1, 0 and −1 positions. In b and c, dashed and solid lines denote individual and averaged replicates obtained from 5,000 middle-expressed genes. (d–f) Comparison to DeepCAGE data. Read_1-start positions of ScriptSeq and DLAF are shown for Actb (d). Malat1 (e) and Actg1 (f) loci. CAGE data are derived from the cerebellum (Cbl), embryo (Emb) and hippocampus (Hip). DLAF but not ScriptSeq peaks largely match with CAGE signals. DLAF libraries treated with Klenow show decreased and broader signals downstream of TSSs in a dose-dependent manner. Coverage is normalized to the total non-rRNA and non-mtRNA reads for the dUTP and DLAF libraries.

Similar articles

Cited by

References

    1. Brenner S, et al. Gene expression analysis by massively parallel signature sequencing (MPSS) on microbead arrays. Nature Biotechnol. 2000;18:630–634. - PubMed
    1. Mortazavi A, Williams BA, McCue K, Schaeffer L, Wold B. Mapping and quantifying mammalian transcriptomes by RNA-Seq. Nat. Methods. 2008;5:621–628. - PubMed
    1. Lister R, et al. Highly integrated single-base resolution maps of the epigenome in Arabidopsis. Cell. 2008;133:523–536. - PMC - PubMed
    1. Zhu YY, Machleder EM, Chenchik A, Li R, Siebert PD. Reverse transcriptase template switching: a SMART approach for full-length cDNA library construction. BioTechniques. 2001;30:892–897. - PubMed
    1. Armour CD, et al. Digital transcriptome profiling using selective hexamer priming for cDNA synthesis. Nat. Methods. 2009;6:647–649. - PubMed

Publication types

Associated data