. 2015 Sep;53(3):378-90.
doi: 10.1165/rcmb.2014-0195OC.

The Lung-Liver Axis: A Requirement for Maximal Innate Immunity and Hepatoprotection during Pneumonia

Affiliations

The Lung-Liver Axis: A Requirement for Maximal Innate Immunity and Hepatoprotection during Pneumonia

Kristie L Hilliard et al. Am J Respir Cell Mol Biol. 2015 Sep.

Abstract

The hepatic acute-phase response (APR), stimulated by injury or inflammation, is characterized by significant changes in circulating acute-phase protein (APP) concentrations. Although individual functions of liver-derived APPs are known, the net consequence of APP changes is unclear. Pneumonia, which induces the APR, causes an inflammatory response within the airspaces that is coordinated largely by alveolar macrophages and is typified by cytokine production, leukocyte recruitment, and plasma extravasation, the latter of which may enable delivery of hepatocyte-derived APPs to the infection site. To determine the functional significance of the hepatic APR during pneumonia, we challenged APR-null mice lacking hepatocyte signal transducer and activator of transcription 3 (STAT3) and v-rel avian reticuloendotheliosis viral oncogene homolog A (RelA) with Escherichia coli in the airspaces. APR-null mice displayed ablated APP induction, significantly increased mortality, liver injury and apoptosis, and a trend toward increased bacterial burdens. TNF-α neutralization reversed hepatotoxicity, but not mortality, suggesting that APR-dependent survival is not solely due to hepatoprotection. After a milder (nonlethal) E. coli infection, hepatocyte-specific mutations decreased APP concentrations and pulmonary inflammation in bronchoalveolar lavage fluid. Cytokine expression in airspace macrophages, but not other airspace or circulating cells, was significantly dependent on APP extravasation into the alveoli. These data identify a novel signaling axis whereby the liver response enhances macrophage activation and pulmonary inflammation during pneumonia. Although hepatic acute-phase changes directly curb injury induced by TNF-α in the liver itself, APPs downstream of these same signals promote survival in association with innate immunity in the lungs, thus demonstrating a critical role for the lung-liver axis during pneumonia.

Keywords: acute-phase response; inflammation; liver; pneumonia.


Figures

Figure 1.
Figure 1.
The acute-phase response (APR) is necessary for survival during a severe Escherichia coli pneumonia. Mutant (CRE+) mice and littermate controls (CRE) were intratracheally inoculated with 1 × 106 CFU of E. coli. (A) Survival data were collected at the indicated time points. Significance was assessed by Mantel-Cox test. (B and C) At the same time points, liver messenger RNA (mRNA) was extracted and serum amyloid A (SAA) and serum amyloid P (SAP) transcript fold induction was determined using quantitative RT-PCR (qRT-PCR). (D and E) Serum was collected and concentrations of SAA and SAP were determined by ELISA. *P < 0.05 for overall effect of genotype over the indicated time course as determined by two-way ANOVA (n = 5–8 per group). Data are presented as means (±SEM).
Figure 2.
Figure 2.
Intrapulmonary acute-phase protein (APP) content is influenced by systemic acute-phase changes. CRE+ mutant mice and littermate controls (CRE) were intratracheally inoculated with 1 × 106 CFU of E. coli. (A and D) At the indicated time points, lungs were lavaged and bronchoalveolar lavage fluid (BALF) SAA and SAP concentrations were determined by ELISA. (C and F) A correlation with a linear regression was performed comparing serum SAA or SAP (from Figure 1) and BALF SAA or SAP concentrations (A or D). Individual values represent those determined across both genotypes after 30 hours of infection. (B and E) Lavaged, infected (left) lobes were homogenized and RNA was extracted. SAA1 and SAP transcript fold induction was determined using qRT-PCR. At the same time points, (G) total BALF neutrophils were enumerated and (H) BALF total protein concentrations were measured by bicinchoninic acid (BCA) assay. *P < 0.05 for overall effect of genotype over the indicated time course, as determined by two-way ANOVA (n = 5–8 per group). Panels lacking asterisks represent data sets in which the overall effect of genotype did not meet the criteria for statistical significance (P > 0.05). (I) After 30 hours of infection, serial dilutions of whole-lung homogenates were plated on blood agar plates, incubated overnight at 37°C, and CFUs were determined. P value is reported versus control mice, as assessed by Mann-Whitney test. Data are presented as means (±SEM), except CFU data (I), which are illustrated as individual values with medians.
Figure 3.
Figure 3.
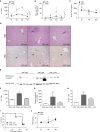
APR-null mice have severe liver injury. Mutant (CRE+) mice and littermate controls (CRE) were infected with 1 × 106 CFU of E. coli. At indicated time points, serum and livers were collected. (A) Serum alanine aminotransferase (ALT) levels were measured via colorimetric assay, (B) liver TNF-α mRNA transcript induction was measured by qRT-PCR, and (C) serum concentrations of TNF-α were determined by multiplex bead array. To determine the influence of TNF-α on liver injury, mice were injected intravenously by tail vein with 5 mg/ml of either a control IgG or anti–TNF-α antibody, followed immediately by intratracheal E. coli (1 × 106 CFU). (D) At 24 hours after infection, histopathology was assessed by hematoxylin and eosin (H&E)–stained liver sections, and cell turnover was assessed by immunohistochemical staining for Ki67. Black arrows indicate areas of acute liver injury (top panels) or a Ki67+ cell (bottom panels). Representative images are shown for livers collected from at least three individual mice per group. (E) After 24 hours of infection, protein was extracted from liver homogenates and subjected to immunoblot analysis for cleaved caspase-3 expression. Each band represents data from an individual mouse. One of two representative blots with livers from four independent experiments is shown. (F) Serum ALT levels were determined 24 hours after infection as an indicator of the amount of liver injury present. (G) A densitometric analysis of band intensity was performed on immunoblots for cleaved caspase-3. The ratio of cleaved caspase-3/pan actin was compared with the control CRE group for each sample to calculate the percent control changes in band intensity ratios. (H) A blinded morphometric analysis was performed on liver sections stained for Ki67 from D. Data are expressed as the percentage of all cells that stained positively for Ki67. (I) Survival data were collected through 48 hours of infection. (J) Blood urea nitrogen (BUN) levels were determined at the indicated time points as a metric of kidney function. (A, B, C, and J) *P < 0.05 for overall effect of genotype, as determined by two-way ANOVA (n = 4–9 per group). (F, G, and H) *P < 0.05 versus control, CRE group was determined by a one-way ANOVA followed by a Holm Sidak’s test ([F and H] n = 6–13; [G] n = sections from three mice per group, with at least six fields of view analyzed). (I) Significance was assessed by a Mantel-Cox test. Data are presented as means (±SEM).
Figure 4.
Figure 4.
Mildly infected mice have an ablated APR. CRE+ mice or littermate controls (CRE) were instilled intratracheally with 4 × 105 CFU of E. coli. (A and B) At the indicated time points, liver mRNA was extracted and SAA1 and SAP transcript fold induction was determined using qRT-PCR. (C and D) Serum was collected, and concentrations of SAA and SAP were determined by ELISA. *P < 0.05 for overall effect of genotype over the indicated time course, as determined by two-way ANOVA (n = 5–11 per group). (B and D) The effect of genotype throughout the 30-hour observation period did meet the criteria for statistical significance (P > 0.05). Data are presented as means (±SEM).
Figure 5.
Figure 5.
The APR facilitates pulmonary inflammation and cytokine production during a mild, nonlethal pneumonia. Mutant (CRE+) mice and littermate controls (CRE) were infected with 4 × 105 CFU of E. coli, and lungs were lavaged at the indicated time points. (A and B) BALF SAA and SAP concentrations were determined by ELISA. (C and D) Lavaged, infected (left) lobes were homogenized and RNA was extracted. SAA1 and SAP transcript fold induction were determined using qRT-PCR. At the same time points, (E) BALF total protein concentrations were measured by BCA assay and (F) total BALF neutrophils were enumerated. *P < 0.05 for overall effect of genotype over the indicated time course, as determined by two-way ANOVA (n = 5–11 per group). The effect of genotype throughout the 30-hour observation period did meet the criteria for statistical significance in (C) (P > 0.05). (G) Cells from the BALF were collected and stained for total (CD45+/Ly6G+) or dead (CD45+/7-aminoactinomycin D [7AAD]+/Ly6G+) neutrophils. Percentages of dead neutrophils were calculated from total numbers of neutrophils. Significance versus control group was assessed by Student’s t test (n = 3–5 per group). (H) At 15 hours after infection, BALF cytokine protein concentrations were measured by a multiplex bead array (Luminex). (I) Lavaged, infected (left) lobes were homogenized, RNA was extracted, and cytokine mRNA induction was measured by qRT-PCR. *P < 0.05 versus control, assessed by Student’s t test (n = 10–11 per group). CXCL, chemokine (C-X-C) motif ligand; ns, not significant. Data are presented as means (±SEM). G-CSF, granulocyte colony-stimulating factor; GM-CSF, granulocyte/macrophage colony-stimulating factor.
Figure 6.
Figure 6.
Cytokine induction in circulating cells is not affected by the APR. Mutant (CRE+) mice and littermate controls (CRE) were infected for 0, 1.5, or 15 hours with 4 × 105 CFU of E. coli. Blood was collected, red blood cells were lysed, and cells were stained for fluorescence-activated cell sorting. (A) Circulating monocytes were gated on CD45+/7AAD/CD115+/CD11b+, and circulating neutrophils were gated on CD45+/7AAD/Ly6G+/ CD11b+. RNA was extracted, and qRT-PCR was performed to determine induction of IL-6, CXCL1, and IL-1β in both circulating monocytes (B) and neutrophils (C). The overall effect of genotype was determined by two-way ANOVA (n = 3–6 per group). Data are presented as means (±SEM).
Figure 7.
Figure 7.
Airspace macrophages are responsible for APP-induced cytokine changes in mildly infected mice. Mutant (CRE+) mice and littermate controls (CRE) were infected for 0, 1.5, or 15 hours with 4 × 105 CFU of E. coli. Lungs were lavaged, and cells were collected and stained for fluorescence-activated cell sorting. (A) Airspace macrophages were gated on CD45+/7AAD/F4/80+/Ly6G, and airspace neutrophils were gated on CD45+/7AAD/Ly6G+/F4/80. RNA was extracted, and qRT-PCR was performed to determine induction of IL-6, CXCL1, and IL-1β in airspace macrophages (B). Expression of IL-6, CXCL1, and IL-1β was determined relative to CRE controls in airspace neutrophils (C), as there was no recruitment of neutrophils to the airspaces at baseline or 1.5 hours after infection. (B) *P < 0.05 for overall effect of genotype or versus control mice in the same group, as determined by two-way ANOVA followed by Holm Sidak’s test (n = 3–6 per group). (C) Significance was assessed by Student’s t test (n = 10–11 per group). Data are presented as means (±SEM).

Similar articles

Cited by

References

    1. Mizgerd JP. Respiratory infection and the impact of pulmonary immunity on lung health and disease. Am J Respir Crit Care Med. 2012;186:824–829. - PMC - PubMed
    1. Mizgerd JP. Lung infection—a public health priority. PLoS Med. 2006;3:e76. - PMC - PubMed
    1. Matthay MA, Zemans RL. The acute respiratory distress syndrome: pathogenesis and treatment. Annu Rev Pathol. 2011;6:147–163. - PMC - PubMed
    1. Mizgerd JP. Acute lower respiratory tract infection. N Engl J Med. 2008;358:716–727. - PMC - PubMed
    1. Quinton LJ, Jones MR, Robson BE, Mizgerd JP. Mechanisms of the hepatic acute-phase response during bacterial pneumonia. Infect Immun. 2009;77:2417–2426. - PMC - PubMed

Publication types