. 2015 Jan 21:6:6121.
doi: 10.1038/ncomms7121.

The adhesion G protein-coupled receptor GPR56 is a cell-autonomous regulator of oligodendrocyte development

Affiliations

The adhesion G protein-coupled receptor GPR56 is a cell-autonomous regulator of oligodendrocyte development

Stefanie Giera et al. Nat Commun. .

Abstract

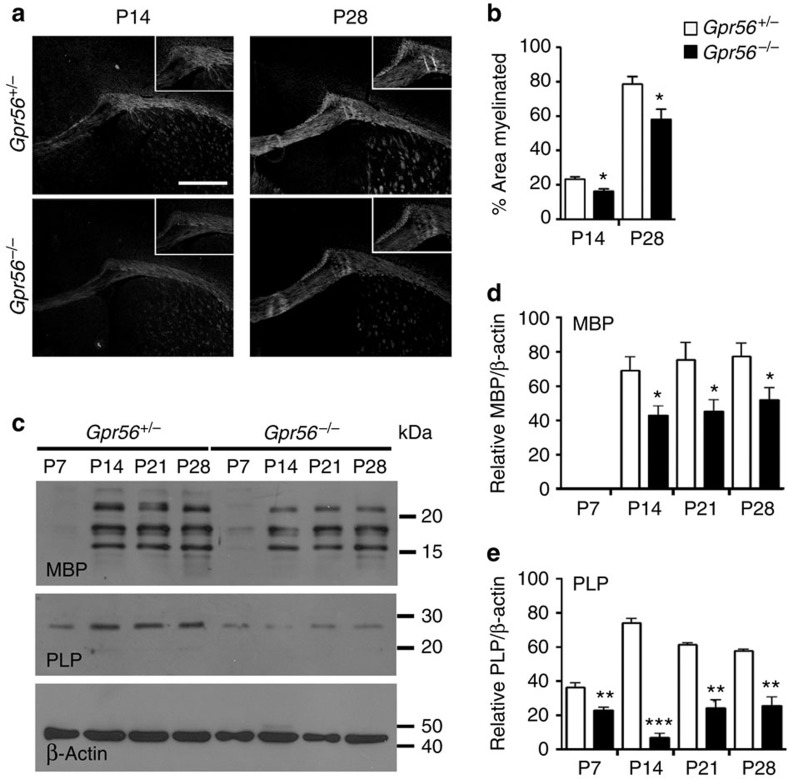
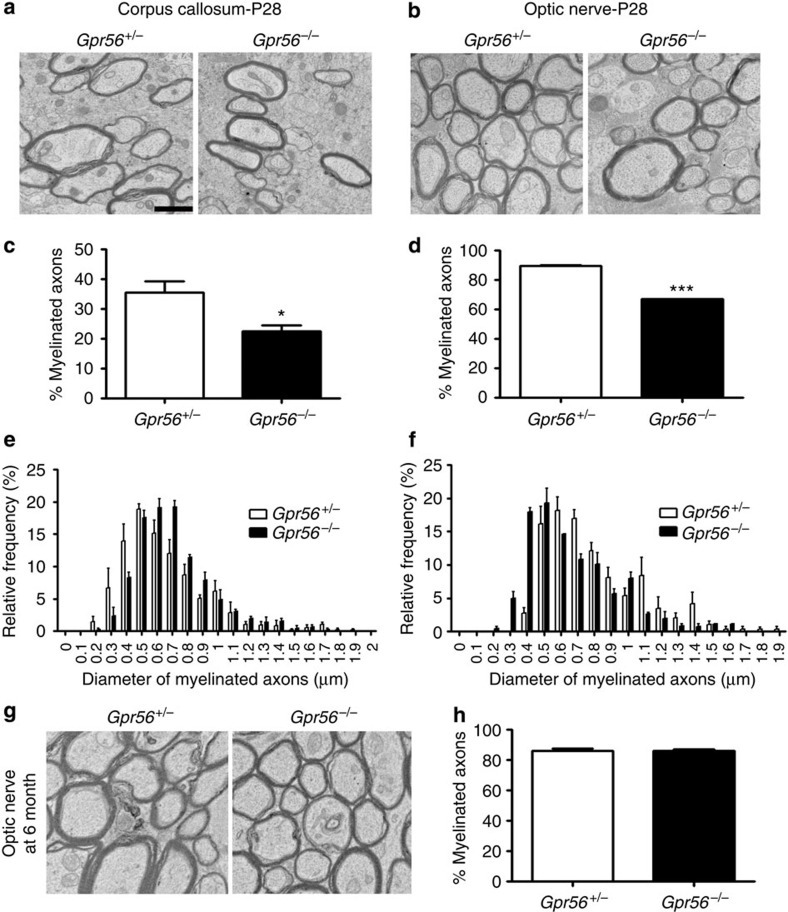
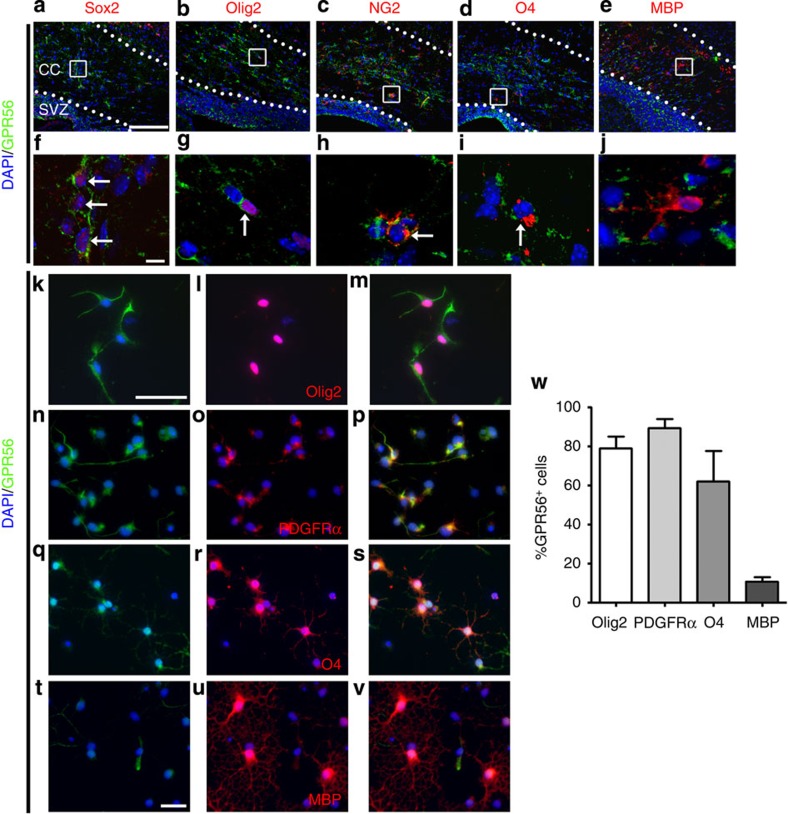
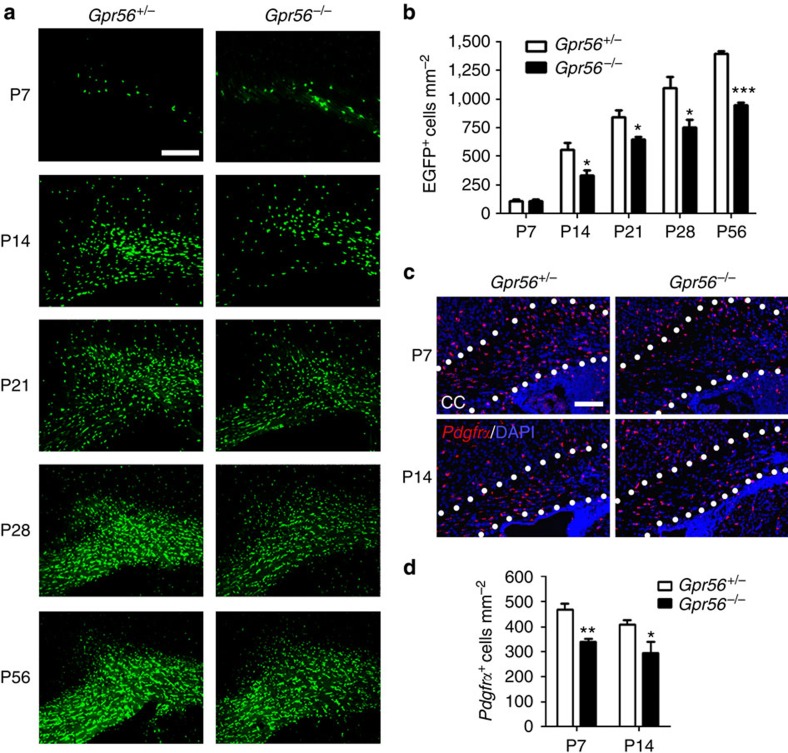
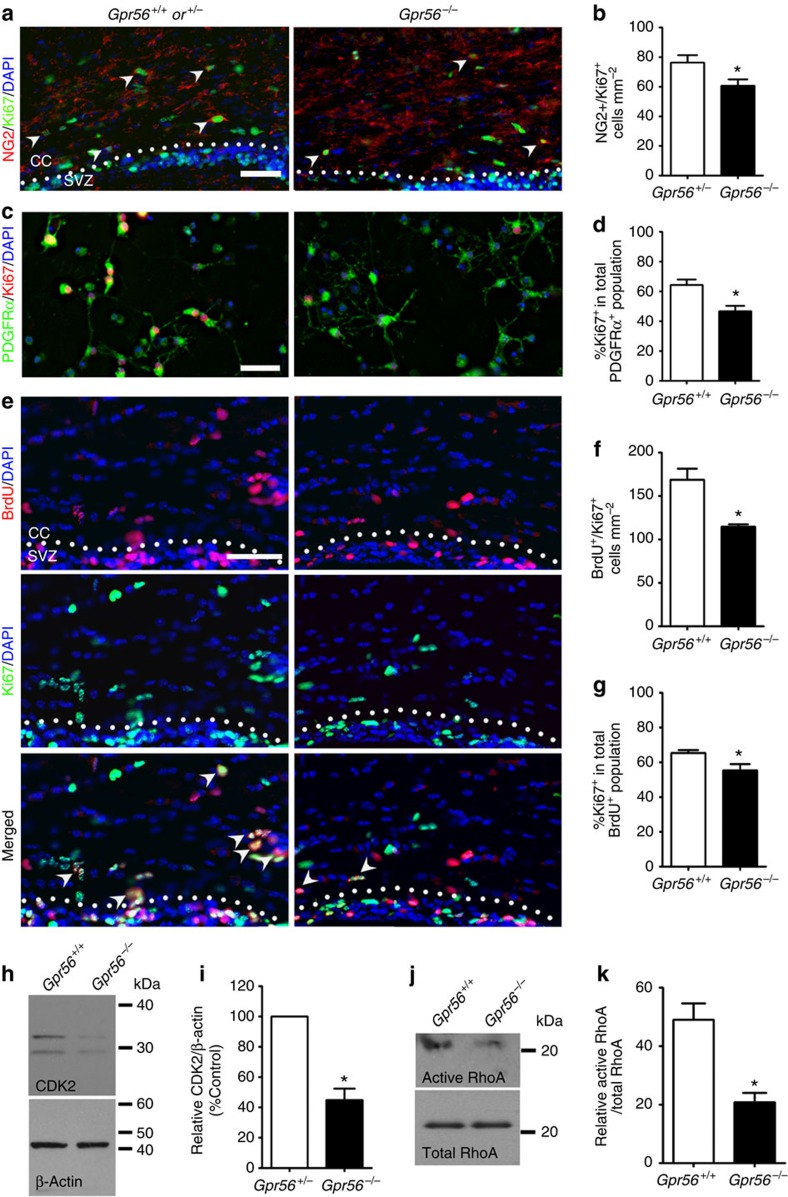
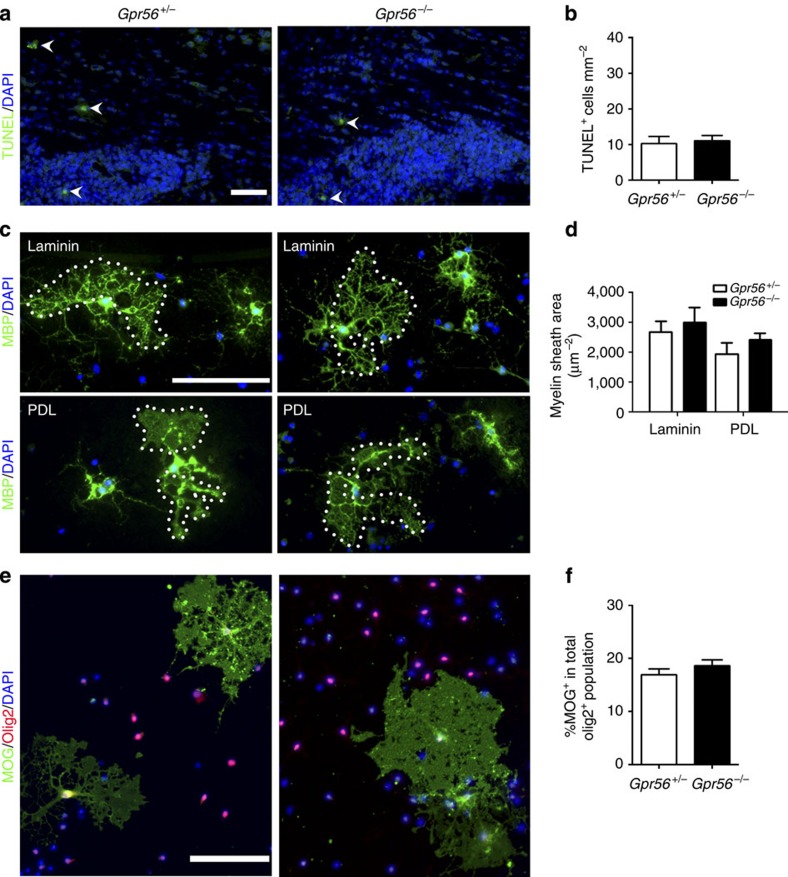
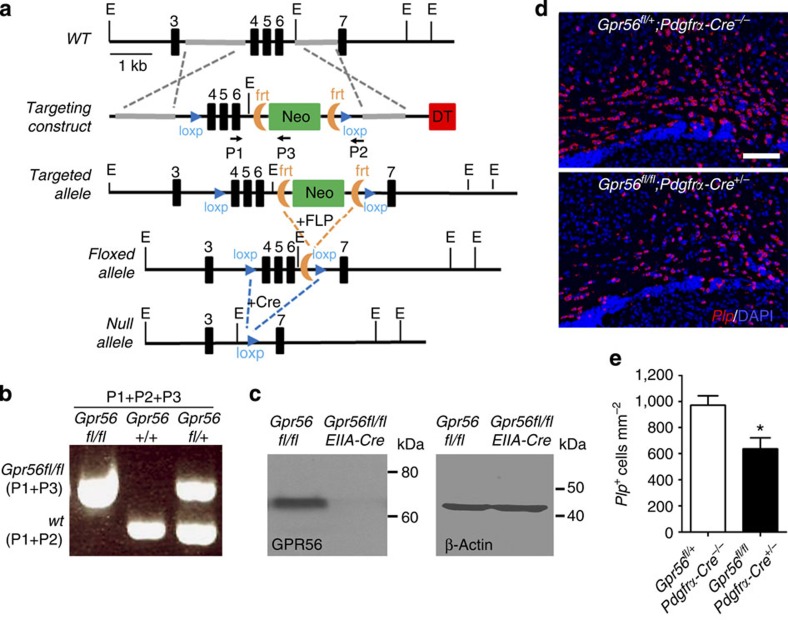
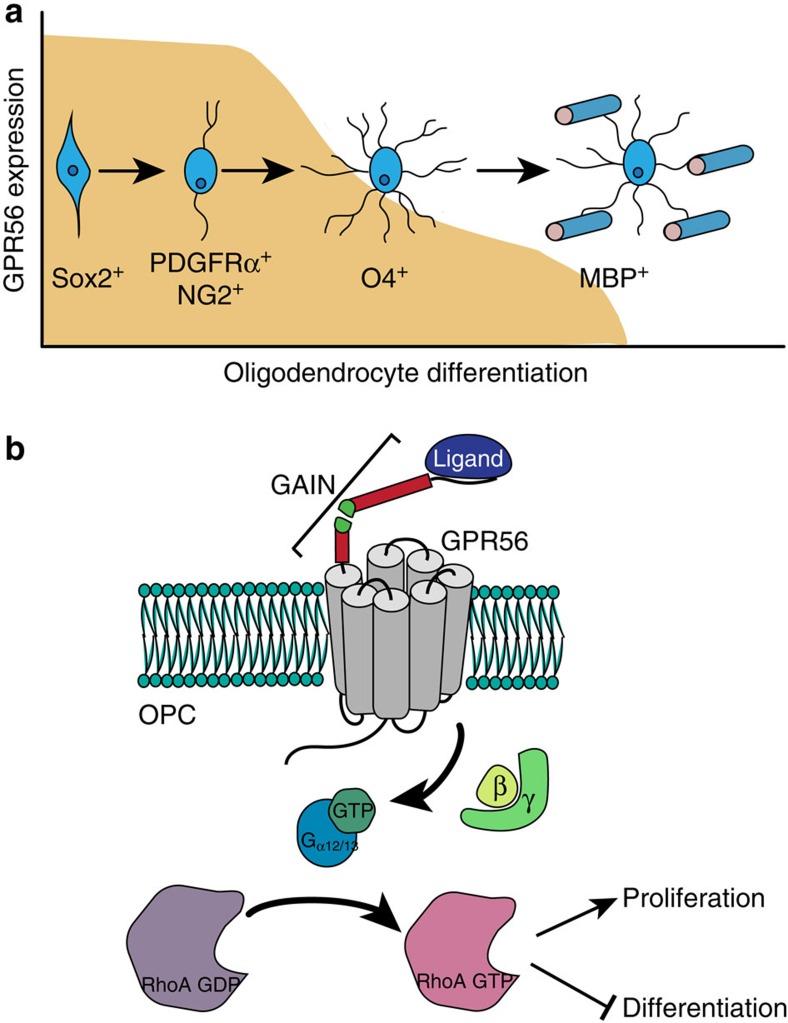
Mutations in GPR56, a member of the adhesion G protein-coupled receptor family, cause a human brain malformation called bilateral frontoparietal polymicrogyria (BFPP). Magnetic resonance imaging (MRI) of BFPP brains reveals myelination defects in addition to brain malformation. However, the cellular role of GPR56 in oligodendrocyte development remains unknown. Here, we demonstrate that loss of Gpr56 leads to hypomyelination of the central nervous system in mice. GPR56 levels are abundant throughout early stages of oligodendrocyte development, but are downregulated in myelinating oligodendrocytes. Gpr56-knockout mice manifest with decreased oligodendrocyte precursor cell (OPC) proliferation and diminished levels of active RhoA, leading to fewer mature oligodendrocytes and a reduced number of myelinated axons in the corpus callosum and optic nerves. Conditional ablation of Gpr56 in OPCs leads to a reduced number of mature oligodendrocytes as seen in constitutive knockout of Gpr56. Together, our data define GPR56 as a cell-autonomous regulator of oligodendrocyte development.


Figures

Figure 1
Figure 1. Loss of GPR56 causes CNS hypomyelination in mice.
(a) Reduced FluoroMyelin staining was observed in the CC of P14 and P28 brains of Gpr56−/− mice (lower panel) compared with their littermate control (upper panel). Scale bar, 500 μm. (b) Bar graphs depicted percentage of area myelinated. Myelin is reduced at P14 (*P=0.0144; unpaired t-test, n=4 per genotype) and P28 (*P=0.0499; unpaired t-test, n=3 per genotype) in the CC of Gpr56−/− compared with controls. (c) Western blot analyses of MBP and PLP expression in the CC of Gpr56+/− and Gpr56−/− mice at P7-28. Loading control: β-actin. (d,e) Bar graphs depicted relative optical density of MBP and PLP to the loading control β-actin. MBP protein was significantly reduced in the CC of Gpr56−/− compared with Gpr56+/− littermates on P14 (*P=0.0285), P21 (*P=0.0315) and P28 (*P=0.0443). Unpaired t-test, n=3 per genotype. PLP protein was significantly decreased in the CC of Gpr56−/− compared with Gpr56+/− littermates on P7 (**P=0.0091), P14 (***P<0.0001), P21 (**P=0.0011) and P28 (**P=0.003). Unpaired t-test, n=4 per genotype. Error bars are means ± s.e.m.
Figure 2
Figure 2. Loss of GPR56 results in fewer myelinated axons in the CC and optic nerves at P28.
(a,b) Representative TEM images from P28 CC (a) and P28 optic nerves (b) of Gpr56+/− (left) and Gpr56−/− (right) mice. (c,d) Percentages of myelinated axons were quantified in the CC (c) and optic nerves (d) of Gpr56−/− mice (*P=0.0264 (c); ***P=0.0004 (d); paired t-test, n=3 per genotype). (e,f) The distribution of myelinated axons with respect to the axon diameter was comparable in the CC (e) and optic nerve (f) between Gpr56+/− and Gpr56−/− mice (P=0.3185 (e); P=0.321 (f); paired t-test, n =3 per genotype). (g) Representative TEM images from the optic nerves at 6 months of Gpr56+/− (left) and Gpr56−/− (right) mice. (h) Percentage of myelinated axons was quantified (P=0.7680; paired t-test, n=3 per genotype). Error bars are means ±s.e.m. Scale bar, 1 μm.
Figure 3
Figure 3. GPR56 is expressed in the OL lineage.
(ae) Double IHC for GPR56 (green) and Sox2, Olig2, NG2 and O4 (red) on wt P5 brains as well as MBP (red) on wt P10 brains. (fj) Higher magnification of the boxed area in ae. Scale bar, ae, 100 μm; fj, 10 μm. (kv) Double immunocytochemistry of GPR56 (green) and various markers (red) on cultured primary OPCs and OLs that were either cultured for 2–4 days in proliferating media (kp) or 3 days in differentiation media (qv). Scale bar, 50 μm. (w) Bar graph depicts percentage of OL lineage cells expressing GPR56. CC, corpus callosum; SVZ, subventricular zone. Error bars are means ±s.e.m.
Figure 4
Figure 4. Loss of GPR56 results in fewer mature OLs and OPCs in the CC.
(a) Representative images of EGFP+ (green) mature OLs in the CC of Gpr56+/− (left panel) and Gpr56−/− (right panel) mouse brains from P7 to P56. Scale bar, 200 μm. (b) Quantification of EGFP+ cells in the CC. P7 (P=0.9686), P14 (*P=0.0373), P21 (*P=0.0314), P28 (*P=0.0478) and P56 (***P<0.0001), unpaired t-test, n=3 per genotype. (c) Representative images of ISH of Pdgfrα (red). Scale bar, 100 μm. (d) Quantification of Pdgfrα+ cells in the CC. P7 (**P=0.0033), P14 (*P=0.0327), unpaired t-test, n=4 per genotype. Error bars are means ±s.e.m.
Figure 5
Figure 5. Loss of GPR56 leads to fewer proliferating OPCs.
(a) Representative images of NG2 (red) and Ki67 (green) double IHC in the CC of Gpr56+/− and Gpr56−/− P14 mice. Arrowheads indicate double-positive cells. (b) Quantification of NG2 and Ki67 dual-positive cells. The asterisks represent significance based on unpaired t-test. P=0.0382; n=6 per genotype. (c) Representative images of PDGFRα (green) and Ki67 (red) double immunostaining on OPCs after cultured for 4 days in proliferation media. (d) Quantification of PDGFRα and Ki67 dual-positive OPCs. The asterisks represent significance based on paired t-test. P=0.0156; n=3 per genotype. (e) Representative images of BrdU (red) and Ki67 (green) double staining on P14 Gpr56+/+ and Gpr56−/− brains that were pulsed with BrdU 24 h before. Arrowheads indicate double-positive cells. (f) The number of BrdU and Ki67 double-positive cells was quantified in the CC of Gpr56−/− mice compared with controls. The asterisks represent significance based on unpaired t-test. P=0.0153; n=3 per genotype. (g) The percentage of Ki67+ in the total BrdU+ cell population was quantified in the CC of Gpr56−/− mice compared with the Gpr56+/+ controls. The asterisks represent significance based on unpaired t-test. P=0.0289; n=4 per genotype. (h) Western blot depicting CDK2 protein level in actually isolated OPCs from Gpr56+/+ and Gpr56−/− P6 mice. (i) The relative CDK2 protein levels were shown. The asterisks represent significance based on paired t-test. P=0.0179; n=3 per genotype. (j) Western blot of active RhoA (top panel) and total RhoA (bottom panel) in the optic nerves of Gpr56+/+ and Gpr56−/− mice. (k) The relative level of active RhoA to total RhoA was presented. The asterisks represent significance based on unpaired t-test. P=0.0122; n=3 per genotype. CC, corpus callosum; SVZ, subventricular zone. Scale bar, 50 μm. Error bars are means ± s.e.m.
Figure 6
Figure 6. Loss of GPR56 has no effect on OPC survival, OL process elaboration and maturation.
(a) Representative images of TUNEL+ cells (green; arrowheads) in the SVZ and CC of Gpr56+/− and Gpr56−/− mice at P14. Scale bar, 50 μm. (b) Quantification of TUNEL+ cells. P=0.7573; unpaired t-test, n=6 per genotype. (c) Representative images of MBP+ (green) OLs cultured for 7 days on either laminin (upper panel) or poly-D-lysine (PDL, lower panel) in differentiation media. Scale bar, 100 μm. (d) Quantification of myelin sheath area of OLs cultured on laminin (P=0.2043) or PDL (P=0.3027) (paired t-test, n=3 per genotype). (e) Representative images of MOG (green) and Olig2 (red) double labelling on OLs derived from Gpr56+/− and Gpr56−/− mice cultured for 7 days in differentiation medium. Scale bar, 100 μm. (f) Percentage of differentiated OLs (MOG+) in total OLs (Olig2+) was quantified. P=0.5044; paired t-test, n=3 per genotype. Error bars are means ± s.e.m.
Figure 7
Figure 7. OPC-specific deletion of Gpr56 leads to fewer mature oligodendrocytes.
(a) Schematic drawing of targeting strategy. Exons 4, 5 and 6 were flanked with two loxP sites. (b) PCR genotyping revealed Gpr56fl/fl, Gpr56+/+ and Gpr56fl/+ alleles. (c) Western blot analysis shows absence of GPR56 protein in Gpr56fl/fl;EIIA-Cre+/−. (d) ISH of Plp (red) in the CC of P21 Gpr56fl/fl;Pdgfrα-Cre+/− mice (lower panel) and Gpr56fl/+;Pdgfrα-Cre−/− controls (upper panel) that received tamoxifen for five consecutive days during P10-P14. Scale bar, 100μm. (e) Quantification of Plp+ mature OLs. The asterisks represent significance based on unpaired t-test. P=0.0177; unpaired t-test, n=4 per genotype. Error bars are means ±s.e.m.
Figure 8
Figure 8. GPR56 keeps OPCs in a proliferative state.
(a) GPR56 is mainly expressed in NG2+/PDGFRα+ OPCs. Its expression is downregulated beginning at the immature O4+ OL stage. The shaded area depicts the developmental stages where GPR56 expression is detected. (b) Model of GPR56 function in OPCs. GPR56, on binding to its unknown ligand, promotes OPC proliferation by activating RhoA.

References

    1. Baumann N. & Pham-Dinh D. Biology of oligodendrocyte and myelin in the mammalian central nervous system. Physiol. Rev. 81, 871–927 (2001). - PubMed
    1. Emery B. Regulation of oligodendrocyte differentiation and myelination. Science 330, 779–782 (2010). - PubMed
    1. Colognato H. & Tzvetanova I. D. Glia unglued: how signals from the extracellular matrix regulate the development of myelinating glia. Dev. Neurobiol. 71, 924–955 (2011). - PMC - PubMed
    1. Chun S. J., Rasband M. N., Sidman R. L., Habib A. A. & Vartanian T. Integrin-linked kinase is required for laminin-2-induced oligodendrocyte cell spreading and CNS myelination. J. Cell Biol. 163, 397–408 (2003). - PMC - PubMed
    1. Relucio J., Tzvetanova I. D., Ao W., Lindquist S. & Colognato H. Laminin alters fyn regulatory mechanisms and promotes oligodendrocyte development. J. Neurosci. 29, 11794–11806 (2009). - PMC - PubMed

Publication types

MeSH terms

Supplementary concepts