. 2015 Jan 21:6:6122.
doi: 10.1038/ncomms7122.

The adhesion GPCR Gpr56 regulates oligodendrocyte development via interactions with Gα12/13 and RhoA

Affiliations

The adhesion GPCR Gpr56 regulates oligodendrocyte development via interactions with Gα12/13 and RhoA

Sarah D Ackerman et al. Nat Commun. .

Abstract

In the vertebrate central nervous system, myelinating oligodendrocytes are postmitotic and derive from proliferative oligodendrocyte precursor cells (OPCs). The molecular mechanisms that govern oligodendrocyte development are incompletely understood, but recent studies implicate the adhesion class of G protein-coupled receptors (aGPCRs) as important regulators of myelination. Here, we use zebrafish and mouse models to dissect the function of the aGPCR Gpr56 in oligodendrocyte development. We show that gpr56 is expressed during early stages of oligodendrocyte development. In addition, we observe a significant reduction of mature oligodendrocyte number and myelinated axons in gpr56 zebrafish mutants. This reduction results from decreased OPC proliferation, rather than increased cell death or altered neural precursor differentiation potential. Finally, we show that these functions are mediated by Gα12/13 proteins and Rho activation. Together, our data establish Gpr56 as a regulator of oligodendrocyte development.


Figures
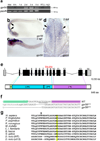
Figure 1
Figure 1. gpr56 expression and mutant generation in zebrafish
(a) Representative image of gpr56 expression assessed by RT-PCR from fertilization through larval development (three technical replicates). From left to right: Mat (maternal expression), 8h (8 hours post-fertilization), 1d (days post-fertilization) to 5d, RT (−) control, and H20 control..(b-c) Whole-mount in situ hybridization (WISH) of zebrafish larvae at (b) 1 and (c) 2 dpf shows robust gpr56 expression within the central nervous system (black arrows in b) during larval development (lateral views shown, anterior to the left, dorsal is up, two technical replicates performed). (d) Cross-section through the spinal cord (white dashed line in c depicts approximate location) of gpr56 WISH embryo at 2 dpf shows gpr56 expression in the spinal cord midline (white arrow) and in bands consistent with neural precursors (black arrows). (e) Diagram of the zebrafish gpr56 gene (top) and protein (bottom) structures. TALENs used to generate gpr56 zebrafish mutants targeted between the 8th and 9th exons (text in red). Gpr56 contains a signal sequence (ss), GPCR Autoproteolysis-Inducing Domain (GAIN), GPCR Proteolytic Site (GPS), and the canonical 7-Transmembrane Domain (7TM). (f) Recovered mutant alleles of gpr56stl13 representing a 6 bp deletion and stl14 representing a 26 bp deletion. (g) Amino acid sequence alignment of the GPS motif from representative species showing perfect conservation of the Trp residue that is deleted in the gpr56stl13/stl13 allele (highlighted yellow). Mutation of the second, highly conserved Trp residue within the GPS causes BFPP (black arrowhead).
Figure 2
Figure 2. Oligodendrocyte development is impaired in gpr56 zebrafish mutants
(a–b) Representative fluorescent images of (a) control (gpr56stl13/+) and (b) gpr56stl13/13 larvae at 28 hpf expressing Tg(sox10(−7.2):memGFP) to mark OPCs. (c) Quantification of OPC number (sox10+; white arrows) in control (N=20) and gpr56stl13/stl13 (N =19) larvae. (d-f) Representative WISH images of the spinal cord of (e) gpr56stl13/stl13 (N=19) and (d) control embryos (gpr56+/+ and gpr56stl13/+, N=22) showing nkx2.2a expression to mark pro-OLs. (f) Quantification of pro-OL number (nkx2.2a+) (p<5.223×10⁻⁶). (g-j) mbp expression (CNS marked by white arrow, hindbrain) in (h) gpr56stl13/13 (N= 20/27), (i) gpr56stl14/stl14(N=14/19) and (j) MZgpr56stl/13/stl13(5/5) larvae compared to (g) WT controls at 4 dpf (N=13/13). (a-f) All images and quantification thereof were taken from segments 5–6 for consistency. For (a,b,d,e) lateral views are shown, anterior to the left, dorsal is up; for (g-j) dorsal views are shown, anterior to the left. (a-b) Scale bar, 50 µm. (d-e) Scale bar, 100 µm. (g-j) Scale bar, 200 µm. Student’s t-test used to test for statistical significance and error bars shown as ± s.d. A minimum of two technical replicates were performed for each marker. NS, not significant.
Figure 3
Figure 3. gpr56 mutant spinal cord axons are hypomyelinated
(a) Schematic representation of a 5 dpf zebrafish. Larvae were cut between segments 5 and 6 (red dashed line) and prepared for TEM. Axis shows orientation of the embryo (D, dorsal; V, ventral; A, anterior; P, posterior) (b) Diagram of a 5 dpf zebrafish cross-section, dorsal is up (D), ventral is down (V). In this image, the spinal cord is in orange and includes neuronal cell bodies (blue) and myelinated axons (green). Ventral region used for quantification is boxed in green, dorsal region used for quantification boxed in magenta. Muscle in purple. (c-k) Representative TEM images from the ventral spinal cord of WT (c-e N=6), gpr56stl13/stl13 mutant larvae (f-h, N=5) and gpr56stl14/stl14 mutant larvae (i-k, N=4) at 5 dpf. Higher magnifications of c, f, and i are shown in d-e, g-h, and j-k, respectively. (c-d, f-g, i-j) Myelinated axons are shaded green, unmyelinated large caliber axons (≥ 500 nm) are shaded orange. (e, h, k) Images from panels d, g, and j without pseudocolor. (l) Quantification of the percent of myelinated axons in the ventral spinal cord of gpr56stl13/stl13 (p<.019) and gpr56stl14/stl14 (p<.039) compared to WT controls. (m) Quantification of the total number of axonsin the ventral spinal cord of gpr56stl13/stl13 (p<.5) and gpr56stl14/stl14 (p<.78) compared to WT controls. (n-o) We also did not observe a significant difference in the number of myelin wraps per myelinated axon in mutants compared to control on the large caliber Mauthner axon (m) or on smaller caliber myelinated axons. (c,f,i) Scale bar, 1 µm. (d-e, g-h, j-k) Scale bar, 500 nm. (l-o) Quantification performed on a stereotyped 14 µm2 region (b) in the ventral spinal cord. Student’s t-test used to test for statistical significance and error bars shown as ± s.d. NS, not significant. Data represents two technical replicates.
Figure 4
Figure 4. Loss of Gpr56 does not affect neural precursor differentiation capacity
Quantification of the percent of (a) GFAP+ astrocytes, (b) Nestin+ neural progenitors, (c) Tuj1+ neurons and (d) O4+ oligodendrocytes (per field of view) differentiated from neural precursors harvested from WT (N=3), Gpr56+/− (N=4), and Gpr56−/− (N=5) animals at postnatal day 3 (P3). Representative fluorescent images from each genotype shown to the right of each summary graph. Two-way ANOVA used to test for statistical significance and error bars shown as ± s.d. Data was acquired from two technical replicates.
Figure 5
Figure 5. gpr56 mutant OPCs form premature associations with axons and are less proliferative than controls
(a-b) Representative stills from in vivo time-lapse imaging of the spinal cord (white bracket at 16h) from segments 5–7 of (a) controls (gpr56stl13/+, N=6) and (b) gpr56stl13/stl13 mutants (N=7) expressing tg(sox10(−7.2):mRFP) to visualize OPC behavior over time (three technical replicates performed). Embryos were imaged from 30 hpf to 46 hpf to encompass the transition of OPCs (white arrowheads) into pro-OLs (light green arrowheads). White arrows denote sox10 expressing neural crest cells, and orange arrows mark the posterior lateral line nerve, which is part of the peripheral nervous system and is marked by the presence of migrating Schwann cell precursors. (c) Quantification of the number of pro-OL associated axons over time in gpr56 mutants compared to controls at 30 hpf (p<.039), 38 hpf (p<.28),and 46 hpf (p=.004). (d-f) Representative TEM images of the ventral spinal cord of a WT (d, N=3) and gpr56stl13/stl13 (e-f, N=4) embryo at 3 dpf (two technical replicates performed). (e) Additional non-Mauthner myelinated axons (shaded blue and numbered) were observed in gpr56stl13/stl13 embryos (p<.048) compared to controls. Mauthner axon shaded orange. (f) Image shows a higher magnification of panel e (green box). (g) Raw counts of non-Mauthner myelinated axons in control and gpr56stl13/stl13 embryos at 3 dpf. (h-j) Representative fluorescent images of the spinal cord from segments 5–7 of (h) control (gpr56stl13/+, N=31) and (i) gpr56stl13/stl13 mutant (N=34) embryos at 32 hpf (two technical replicates performed). Embryos expressing tg(sox10 (−7.2):mRFP) were fixed and stained with pH3 to assay proliferation. (j) Quantification of the number of proliferating OPCs in (i) gpr56stl13/stl13 mutants compared to (h) controls (p<.0004) (k-m) Quantification of dying cells (acridine orange +, one technical replicate per timepoint) in gpr56stl13/stl13 mutants and controls (WT and gpr56stl13/+) at 32 hpf (control: N=13, gpr56stl13/stl13: N=20), 2 dpf (control: N=21, gpr56stl13/stl13 N=12) and 3 dpf (control: N=19, gpr56stl13/stl13: N=20). (a-b, h-i) Scale, 50 µm. (d-e) Scale, 1 µm. (f) Scale, 500 nm. Student’s t-test used to test for statistical significance and error bars shown as ± s.d.
Figure 6
Figure 6. Overexpression of gpr56 causes increased OPC number and inhibits myelination
(a-d) WISH shows nkx2.2a expression in the spinal cord of injected WT larvae at 2.5 dpf. Lateral views are shown, dorsal is up. (e-f) Quantification of the number of nkx2.2a+ pro-OLs (black arrowheads) in WT embryos injected with 50 pg of synthetic gpr56 mRNA (N=30) in the anterior (b, segments 5–6, p<8.7×10⁻⁷) and posterior (d, segments 15–30, p<.01) spinal cord compared to injected controls (a, c, N=31). (g-j) Representative images of a (h, j) gpr56 injected WT larva (N=19/31) compared to a (g, i) control-injected embryo (N=33/35) showing mbp expression by WISH. g-h, lateral views shown, anterior on right. i-j, dorsal views shown, anterior on right. Black arrows, hindbrain. Black arrowheads, dorsal oligodendrocytes. White arrows, cranial nerves. (k) Cartoon of zebrafish larva in cross-section modified from Fig. 3b. White box represents regions shown in l-m, o-p. Green box represents region shown in r-u. (l-m, o-p) Representative images of spinal cord cross-sections from 2.5 dpf (l-m) and 5 dpf (o-p) WT embryos injected with control (l, o) or 50 pg gpr56 synthetic mRNA (m, p). 2.5 dpf: Scale, 500 nm. 5 dpf: Scale, 4 µm. (n, q) Quantification of the number of oligodendrocyte lineage cell-bodies (shaded purple) in gpr56 injected embryos (N=4) compared to controls (N=4) at 2.5 dpf (p<.037) and 5 dpf (p<.15, N=4 for controls and N=5 for gpr56 injected embryos). Neuronal cell bodies shaded green. (r-u) Representative TEM images of the spinal cord in cross-section from 5 dpf control (r-s) and gpr56 injected (t-u) embryos. Scale, 1 µm. Quantification of total axon number (v), % myelinated axons (shaded blue, w, p<.05) and myelin thickness on the large caliber Mauthner axon (shaded orange, x, p<.008) in gpr56 OE embryos at 5 dpf relative to controls. SC, spinal cord. Student’s t-test used to test for statistical significance and error bars shown as ± s.d. Two technical replicates were performed for each overexpression experiment.
Figure 7
Figure 7. Manipulation of Gα12/13 and RhoA signaling influences CNS mbp expression in gpr56 mutants
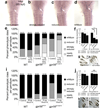
(a–d) Injection of morpholinos (3MO) targeting Gα12/13 signaling (gna12-MO, gna13a-MO, and gna13b-MO, 1 ng each), constitutively active rhoa synthetic mRNA (10 pg), or phenol-red control yielded embryos with (d) WT, (c) reduced, (b) strongly reduced, or (a) nearly absent CNS mbp expression at 65 hpf by WISH (dorsal view shown, anterior is up, white arrows denote CNS mbp expression). We scored mbp expression as follows: 3 = WT, 2 = reduced, 1 = strongly reduced, 0 = nearly absent. (e) Phenotypic distribution by genotype and treatment (1 ng 3MO or control-injected). (f) Quantification of CNS mbp score by genotype and treatment (1 ng 3 MO or control-injected). (f) Respective p values: control WT versus control heterozygote: p< 0.077; control WT versus control mutant: p<.0004; 3MO-injected WT versus 3MO-injected heterozygote: p< 1.33×10−05; 3MO-injected WT versus 3MO-injected mutant: p< 2.59×10⁻⁶). (i) Phenotypic distribution by genotype and treatment (10 pg consitutively active RhoA (Rhov14) or control-injected) (j) Quantification of CNS mbp score by genotype and treatment (10 pg consitutively active RhoA (Rhov14) or control-injected). Respective p-values: control WT versus control mutant: p<.0009; OE WT versus OE mutant: p<.343. (g-h, k-l) All analyzed injected embryos were morphologically normal. Student’s t-test used to test for statistical significance and error bars are shown as ± s.d. Two technical replicates were performed for the 3MO and the OE experiment. NS, not significant.
Figure 8
Figure 8. Gpr56 promotes OPC proliferation through inhibiting differentiation
Model of Gpr56 function in OPCs. In WT OPCs, Gpr56 couples to Gα12/13 and activates RhoA, which prevents terminal differentiation and indirectly promotes OPC proliferation (dashed arrow) by maintaining the OPC in an immature, proliferative state. OPC proliferation is directly regulated via interactions between neuron-secreted PDGF-A and OPC bound PDGFRα. In Gpr56 (stl13/stl13) mutant OPCs, impaired autoproteolytic cleavage reduces Gpr56 signaling capacity, leading to loss of RhoA activation. Reduced RhoA signaling alleviates RhoA inhibition on terminal differentiation (green arrow), which indirectly causes a decrease in OPC proliferation (red dashed lines) as OPCs differentiate at the expense of proliferation.

References

    1. Nave KA, Trapp BD. Axon-Glial Signaling and the Glial Support of Axon Function. Annu Rev Neurosci. 2008;31:535–561. - PubMed
    1. Fünfschilling U, et al. Glycolytic oligodendrocytes maintain myelin and long-term axonal integrity. Nature. 2012;485:517–522. - PMC - PubMed
    1. Lee Y, et al. Oligodendroglia metabolically support axons and contribute to neurodegeneration. Nature. 2012;487:443–448. - PMC - PubMed
    1. Snaidero N, et al. Myelin Membrane Wrapping of CNS Axons by PI(3,4,5)P3-Dependent Polarized Growth at the Inner Tongue. Cell. 2014;156:277–290. - PMC - PubMed
    1. Runia TF, van Pelt-Gravesteijn ED, Hintzen RQ. Recent gains in clinical multiple sclerosis research. CNS Neurol Disord Drug Targets. 2012;11:497–505. - PubMed

Publication types

MeSH terms

Substances