Clinical Trial
. 2015 Jan 21;10(1):e0114017.
doi: 10.1371/journal.pone.0114017. eCollection 2015.

Experimentally-derived fibroblast gene signatures identify molecular pathways associated with distinct subsets of systemic sclerosis patients in three independent cohorts

Affiliations
Clinical Trial

Experimentally-derived fibroblast gene signatures identify molecular pathways associated with distinct subsets of systemic sclerosis patients in three independent cohorts

Michael E Johnson et al. PLoS One. .

Abstract

Genome-wide expression profiling in systemic sclerosis (SSc) has identified four 'intrinsic' subsets of disease (fibroproliferative, inflammatory, limited, and normal-like), each of which shows deregulation of distinct signaling pathways; however, the full set of pathways contributing to this differential gene expression has not been fully elucidated. Here we examine experimentally derived gene expression signatures in dermal fibroblasts for thirteen different signaling pathways implicated in SSc pathogenesis. These data show distinct and overlapping sets of genes induced by each pathway, allowing for a better understanding of the molecular relationship between profibrotic and immune signaling networks. Pathway-specific gene signatures were analyzed across a compendium of microarray datasets consisting of skin biopsies from three independent cohorts representing 80 SSc patients, 4 morphea, and 26 controls. IFNα signaling showed a strong association with early disease, while TGFβ signaling spanned the fibroproliferative and inflammatory subsets, was associated with worse MRSS, and was higher in lesional than non-lesional skin. The fibroproliferative subset was most strongly associated with PDGF signaling, while the inflammatory subset demonstrated strong activation of innate immune pathways including TLR signaling upstream of NF-κB. The limited and normal-like subsets did not show associations with fibrotic and inflammatory mediators such as TGFβ and TNFα. The normal-like subset showed high expression of genes associated with lipid signaling, which was absent in the inflammatory and limited subsets. Together, these data suggest a model by which IFNα is involved in early disease pathology, and disease severity is associated with active TGFβ signaling.


Conflict of interest statement

Competing Interests: MLW and MH have filed patents for gene expression biomarkers in SSc. Molecular signatures for diagnosing scleroderma (PCT/US2009/004089) and Gene expression signature in skin predicts response to mycophenolate mofetil (PCT/US2012/027020). MLW is the Scientific Founder of Celdara Medical, LLC. There are no further patents or products to declare from the work contained herein. This does not alter the authors’ adherence to all the PLOS ONE policies on sharing data and materials.

Figures

Figure 1
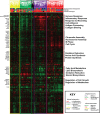
Figure 1. Hierarchical clustering recreates intrinsic subsets.
Hierarchical clustering of the ComBat-merged MPH dataset recreates clear normal-like, fibroproliferative, inflammatory, and limited subsets. Clustering was performed on 2316 probes covering 2189 genes at an FDR of 0.65%, chosen based upon their consistent expression within an individual patient, along with high variance between patients. The array tree is color coded to indicate new intrinsic subset designations (yellow = limited, green = normal-like, purple = inflammatory, red = fibroproliferative, and black = unassigned). Below the array tree, hash marks are used to indicate the original subset designation (TOP: green = normal-like, red = fibroproliferative, purple = inflammatory, yellow = limited, black = unassigned), the dataset of origin (MIDDLE: blue = Milano, green = Pendergrass, red = Hinchcliff), and the clinical diagnosis (BOTTOM: green = normal, red = diffuse scleroderma, yellow = limited scleroderma, black = morphea or eosinophilic fasciitis). Black bars indicate genes that clustered together hierarchically, with the most highly represented GO terms listed alongside each cluster.
Figure 2
Figure 2. Dosage response and induction of reporter genes following stimulation with PDGF and RZN.
RZN and PDGF concentrations were optimized for use in microarray treatment experiments by qRT-PCR using reporter genes CD36 and thrombospondin (THBD), respectively. NHDFs were treated with A) 0, 1, 10, 50, and 100 μM RZN or C) 0, 10, 30, 50, and 100 μg/mL PDGF for 24 h. Levels of CD36 and THBD were analyzed by qRT-PCR, and normalized to 18S rRNA. NHDFs were treated with B) 10 μM RZN and D) 30 ng/mL PDGF for 0, 0, 0, 2, 4, 8, 12, and 24 h. Error bars indicate the standard deviation across three or more replicates; all time points were statistically significant relative to controls (p < 0.05).
Figure 3
Figure 3. Clustering of pathway-regulated genes signatures reveals co-regulated and pathway specific modules.
A total of 2136 probes covering 2081 genes were identified which show ≥ 2-fold average change in gene expression at 12–24 h in one or more of the six different pathways examined (IL-4, IL-13, S1P, TGFβ, PDGF, and RZN). Gene expression data from each of the eight time points (0, 0, 0, 2, 4, 8, 12, and 24 h) from each time course are shown. Black bars indicate genes that clustered together hierarchically, with the most highly represented GO terms listed alongside each cluster.
Figure 4
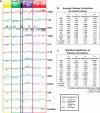
Figure 4. Correlations between pathway-specific gene signatures and patient gene expression profiles.
Pearson correlations were performed between each of the thirteen pathway-specific gene signatures and the corresponding probes in the MPH dataset. A. Pathway gene signatures are defined as all probes exhibiting ≥ 2-fold average change in gene expression across all 12 and 24 h time points for a given treatment (Table 2). Correlations were repeated across each of the 329 arrays and aligned using the array dendogram from Fig. 1. Boxes representing each of the four intrinsic subsets (normal-like = green, fibroproliferative = red, inflammatory = purple, limited = yellow) are shown; arrays not clustering with any defined subset are indicated in black. B. Average Pearson’s correlations for each pathway across each of the intrinsic subsets are provided. C. P values quantifying the enrichment of pathway signatures within individual subsets were calculated based upon the average Pearson’s correlation, with statistically significant correlations highlighted in bold.

References

    1. LeRoy EC, Black C, Fleischmajer R, Jablonska S, Krieg T, et al. (1988) Scleroderma (systemic sclerosis): classification, subsets and pathogenesis. J Rheumatol 15: 202 - PubMed
    1. Pendergrass SA, Lemaire R, Francis IP, Mahoney JM, Lafyatis R, et al. (2012) Intrinsic Gene Expression Subsets of Diffuse Cutaneous Systemic Sclerosis Are Stable in Serial Skin Biopsies. J Invest Dermatol 132: 1363–1373. 10.1038/jid.2011.472 - DOI - PMC - PubMed
    1. Sargent JL, Milano A, Bhattacharyya S, Varga J, Connolly MK, et al. (2009) A TGFβ-responsive gene signature is associated with a subset of diffuse scleroderma with increased disease severity. J Invest Dermatol 130: 694–705. 10.1038/jid.2009.318 - DOI - PMC - PubMed
    1. Greenblatt MB, Sargent JL, Farina G, Tsang K, Lafyatis R, et al. (2012) Interspecies Comparison of Human and Murine Scleroderma Reveals IL-13 and CCL2 as Disease Subset-Specific Targets. Am J Path 180: 1080–1094. 10.1016/j.ajpath.2011.11.024 - DOI - PMC - PubMed
    1. Chung L, Fiorentino D, BenBarak M, Adler A, Mariano M, et al. (2009) Molecular Framework for Response to Imatinib Mesylate in Systemic Sclerosis. Arth Rheum 60: 584–591. 10.1002/art.24221 - DOI - PMC - PubMed

Publication types