. 2015 Feb;125(2):846-58.
doi: 10.1172/JCI73688. Epub 2015 Jan 20.

Neonatal ghrelin programs development of hypothalamic feeding circuits

Neonatal ghrelin programs development of hypothalamic feeding circuits

Sophie M Steculorum et al. J Clin Invest. 2015 Feb.

Abstract

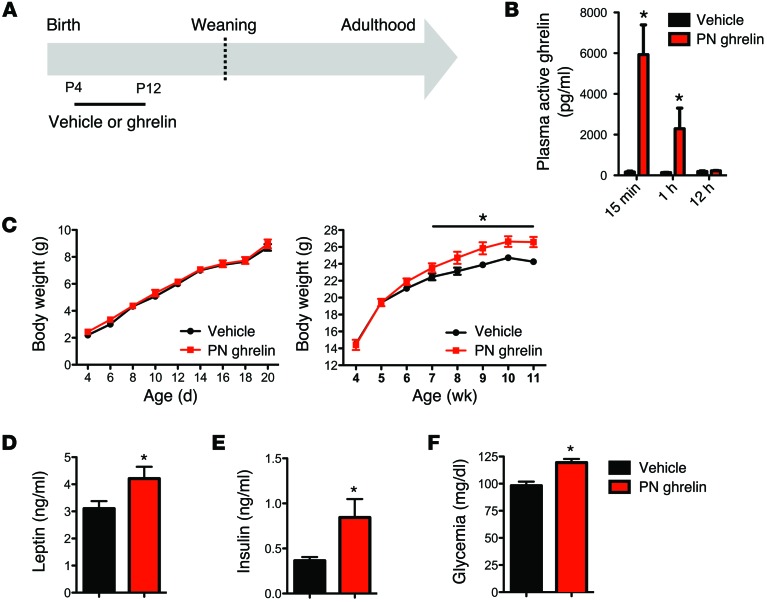
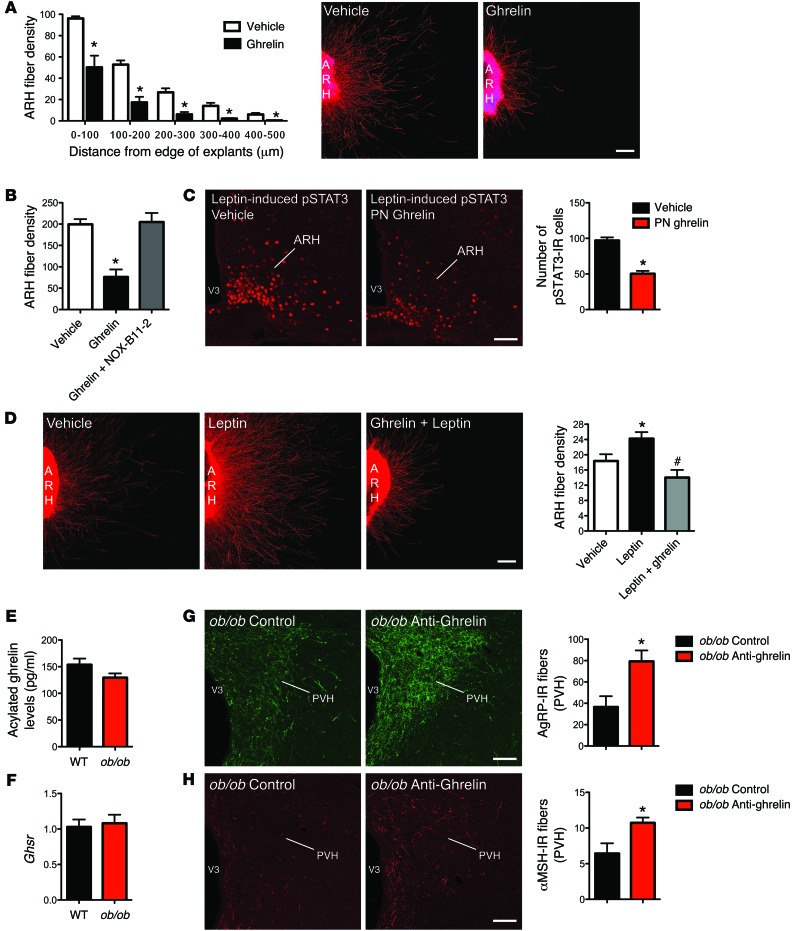
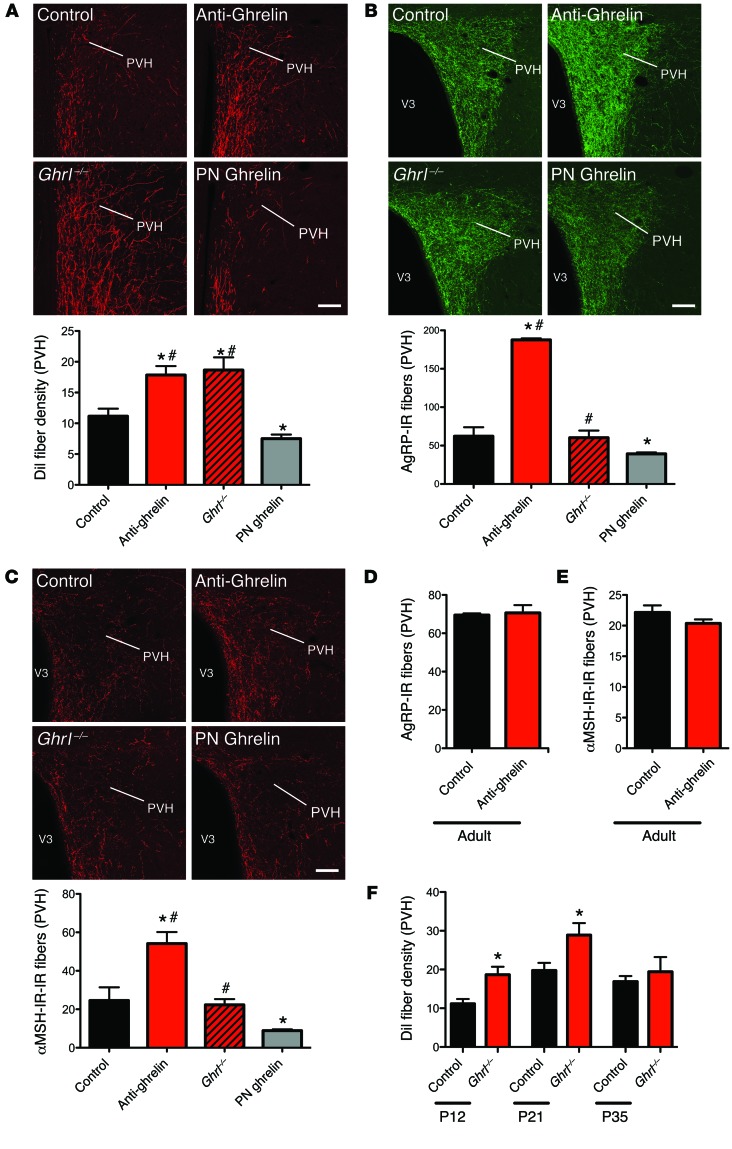
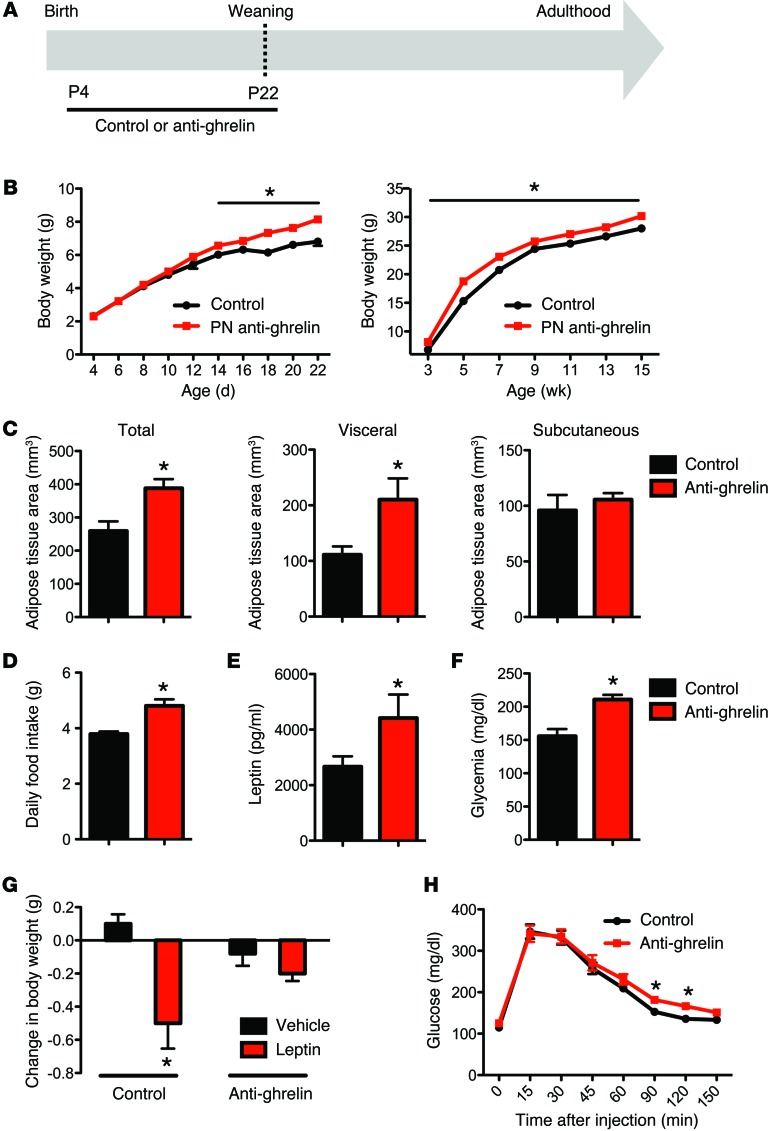
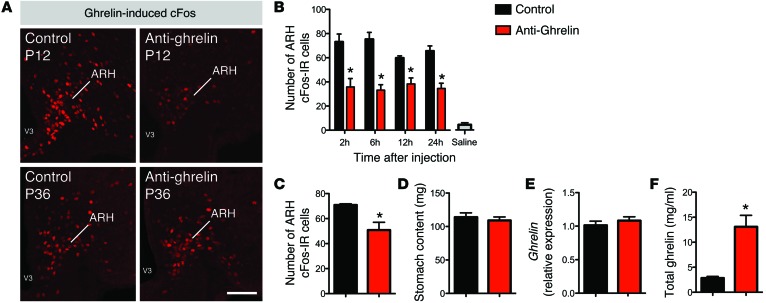
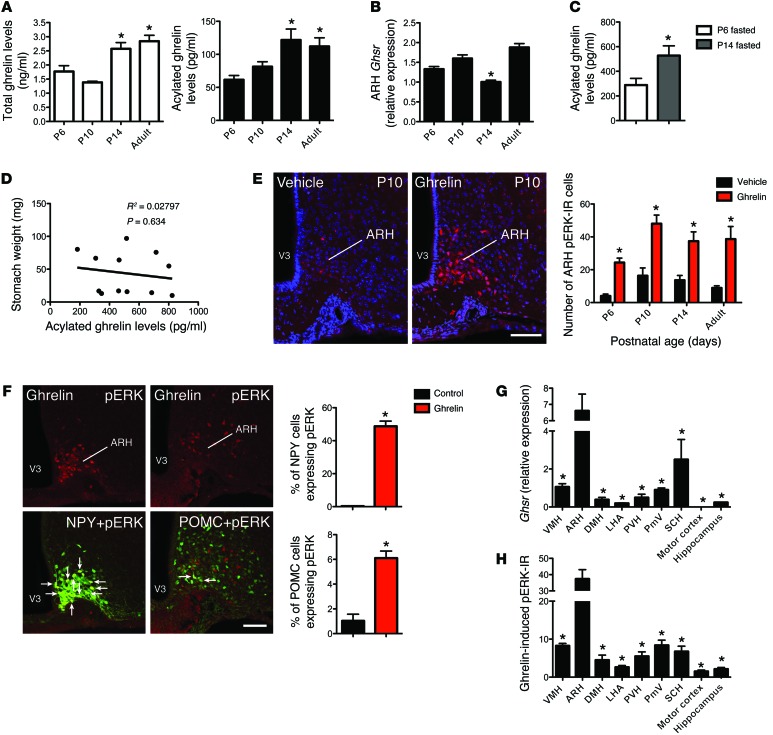
A complex neural network regulates body weight and energy balance, and dysfunction in the communication between the gut and this neural network is associated with metabolic diseases, such as obesity. The stomach-derived hormone ghrelin stimulates appetite through interactions with neurons in the arcuate nucleus of the hypothalamus (ARH). Here, we evaluated the physiological and neurobiological contribution of ghrelin during development by specifically blocking ghrelin action during early postnatal development in mice. Ghrelin blockade in neonatal mice resulted in enhanced ARH neural projections and long-term metabolic effects, including increased body weight, visceral fat, and blood glucose levels and decreased leptin sensitivity. In addition, chronic administration of ghrelin during postnatal life impaired the normal development of ARH projections and caused metabolic dysfunction. Consistent with these observations, direct exposure of postnatal ARH neuronal explants to ghrelin blunted axonal growth and blocked the neurotrophic effect of the adipocyte-derived hormone leptin. Moreover, chronic ghrelin exposure in neonatal mice also attenuated leptin-induced STAT3 signaling in ARH neurons. Collectively, these data reveal that ghrelin plays an inhibitory role in the development of hypothalamic neural circuits and suggest that proper expression of ghrelin during neonatal life is pivotal for lifelong metabolic regulation.


Figures

Figure 6
Figure 6. Chronic neonatal hyperghrelinemia causes metabolic disturbances.
(A) Schematic representation of the experimental design used to increase ghrelin levels during neonatal life. Starting at P4, pups were treated daily with i.p. injections of ghrelin (2 mg/kg) (PN ghrelin) or vehicle (control), for a total of 8 days. (B) Acylated ghrelin levels in P10 mice injected with vehicle (0.9% NaCl) or ghrelin (2 mg/kg) (n = 4 for vehicle; n = 6 for PN ghrelin). Values are shown as the mean ± SEM. *P < 0.05 vs. control. (C) Pre- and postweaning growth curves (body weights) of mice neonatally injected with control or ghrelin (n = 5 for vehicle; n = 7 for PN ghrelin). (D) Plasma leptin and (E) insulin levels at 90 days of age in mice neonatally injected with control or ghrelin (n = 4 for control; n = 5 for PN ghrelin). (F) Fasting glucose levels in P80 mice neonatally injected with control or ghrelin (n = 5 for control; n = 7 for PN ghrelin). Values are shown as the mean ± SEM. *P < 0.05 vs. vehicle. Statistical significance was determined using 2-tailed Student’s t tests (DF) and a 2-way ANOVA followed by Bonferroni’s post-hoc test (B and C).
Figure 5
Figure 5. Ghrelin blocks axonal growth from neonatal ARH neurons.
(A) Quantification and photomicrographs of βIII-tubulin–immunopositive fibers, a marker of neurites, from isolated organotypic cultures of neonatal ARH incubated for 48 hours with vehicle or ghrelin (100 ng/ml) (n = 6 cases per group). (B) Quantification of βIII-tubulin–immunopositive fibers from isolated cultures of neonatal ARH incubated for 48 hours with vehicle, ghrelin, or ghrelin and NOX-B11-2 (n = 8 for ghrelin, and ghrelin + NOX-B11-2; n = 11 for vehicle). (C) Photomicrographs and quantification of the number of leptin-induced pSTAT3-IR cells in the ARH of P10 pups injected with ghrelin (2 mg/kg) or vehicle from P4 to P10 (n = 4 for vehicle; n = 6 for PN ghrelin). (D) Images and quantification of the overall density of βIII-tubulin–immunopositive fibers from isolated organotypic cultures of neonatal ARH incubated for 48 hours with vehicle, leptin (100 ng/ml), or leptin + ghrelin (n = 9 for leptin; n = 15 for leptin + ghrelin; n = 19 for vehicle). (E) Circulating acylated ghrelin level of P10 WT and leptin-deficient (ob/ob) mice (n = 9 for WT; n = 12 for ob/ob). (F) Relative expression of Ghsr mRNA in the hypothalamus of P12 WT and ob/ob mice (n = 6 per group). (G and H) Confocal images and quantification of AgRP-IR fibers (G) and α-MSH-IR fibers (H) in the PVH of P12 ob/ob mice neonatally injected with the control or anti-ghrelin compound (n = 4 per group). Values are shown as the mean ± SEM. V3, third ventricle. *P < 0.05 vs. vehicle; #P < 0.05 vs. leptin. Statistical significance was determined using 2-tailed Student’s t tests (C and EH) and a 2-way ANOVA followed by Bonferroni’s post-hoc test (A, B, and D). Scale bars: 100 μm (A and D); 150 μm (C, G, and H).
Figure 4
Figure 4. Neonatal ghrelin influences the normal developmental pattern of ARH neural projections.
(A) Confocal images and quantification of the density of arcuate DiI-labeled fibers innervating the PVH in P12 mouse pups injected with the control, anti-ghrelin compound, or ghrelin, and ghrelin knockout (Ghrl–/–) pups (n = 5 for control; n = 4 for Ghrl–/–; n = 6 for anti-ghrelin and PN ghrelin). (B and C) Confocal images and quantification of AgRP-IR fibers (B) and α-MSH-IR fibers (C) at 100–120 days of age in the PVH of mice neonatally injected with the control or anti-ghrelin compound, mice neonatally injected with ghrelin, and Ghrl–/– mice (n = 6 for control, Ghrl–/–, and PN ghrelin; n = 7 for anti-ghrelin). (D and E) Quantification of AgRP-IR (D) and α-MSH-IR (E) fibers at 100–120 days of age in the PVH of mice injected with control or anti-ghrelin during adult life (n = 3 per group). (F) Quantification of the density of arcuate DiI-labeled fibers innervating the PVH in P12, P21, and P35 control and ghrelin knockout (Ghrl–/–) mice (n = 5 for control; n = 4 for P12 Ghrl–/–; n = 6 for P21 and P35 Ghrl–/–).Values are shown as the mean ± SEM. V3, third ventricle. *P < 0.05 vs. control; #P < 0.05 vs. PN ghrelin. Statistical significance was determined using 2-tailed Student’s t tests (D and E) and a 2-way ANOVA followed by Bonferroni’s post-hoc test (A, B, C, and F). Scale bars: 150 μm.
Figure 3
Figure 3. Neonatal ghrelin blockade causes metabolic disturbances.
(A) Schematic representation of the experimental design used to specifically block ghrelin action during neonatal life. Starting at P4, pups were treated daily with i.p. injections of the anti-ghrelin compound NOX-B11-2 (15 mg/kg) or an inactive control, for a total of 18 days. (B) Pre- and post-weaning growth curves (body weights) of mice neonatally injected with control or anti-ghrelin compound (n = 8 for control; n = 10 for anti-ghrelin). (C) Body adiposity assessed by MRI at 120 days of age in animals neonatally injected with control or anti-ghrelin (n = 3 for control; n = 4 for anti-ghrelin). (D) The daily food intake of P90 mice neonatally injected with control or anti-ghrelin (n = 6 for control; n = 8 for anti-ghrelin). (E) Plasma leptin and (F) blood glucose levels at 70 days of age in mice neonatally injected with control or anti-ghrelin (n = 6 for control; n = 8 for anti-ghrelin). (G) Leptin sensitivity at 100 days of age in mice neonatally injected with control or anti-ghrelin (n = 5 per group). (H) Glucose tolerance test of P80–P100 mice neonatally injected with control or anti-ghrelin (n = 12 per group). Values are shown as the mean ± SEM. PN, postnatal. *P < 0.05 vs. control or vehicle. Statistical significance was determined using 2-tailed Student’s t tests (CG) and a 2-way ANOVA followed by Bonferroni’s post-hoc test (B and H).
Figure 2
Figure 2. Effects of the anti-ghrelin compound.
(A) Representative images of ghrelin-induced cFos IR (marker of cellular activation) from P12 and P36 mice neonatally injected with control or anti-ghrelin. (B) Quantitative comparisons of ghrelin-induced cFos IR in the ARH of P12 mice 2, 6, 12, and 24 hours after i.p. administration of control or anti-ghrelin (n = 3 for control; n = 4 for saline and anti-ghrelin). The gray bar shows the number of cFos-IR cells in saline-treated animals. (C) Number of cFos-IR cells of P21 mice neonatally injected with control or anti-ghrelin 2 hours after i.p. administration of ghrelin (2 mg/kg) (n = 3 per group). (D) Stomach content of P14 pups injected with the control or anti-ghrelin compound (n = 7 for control; n = 8 for anti-ghrelin). (E) Relative expression of ghrelin mRNA in the stomachs of P14 pups injected with control or anti-ghrelin (n = 7 per group). (F) Total plasma ghrelin levels of P14 pups injected with control or anti-ghrelin (n = 7 per group). Values are shown as the mean ± SEM. *P < 0.05 vs. control. Statistical significance was determined using 2-tailed Student’s t tests (CF) and a 2-way ANOVA followed by Bonferroni’s post-hoc test (B). Scale bar: 120 μm.
Figure 1
Figure 1. Ghrelin signaling in neonatal ARH neurons.
(A) Total plasma ghrelin levels and acylated ghrelin levels of P6, P10, P14, and adult mice (n = 6 for P10; n = 5 for P6 and P14; n = 4 for adult). (B) Relative expression of Ghsr mRNA in the ARH of P6, P10, P14, and adult mice (n = 6 for P10; n = 5 for P6 and P14; n = 4 for adult). (C) Circulating acylated ghrelin levels of P6 and P14 mice after a 4-hour fasting (n = 6 per group). (D) Correlation between stomach weight and circulating acylated ghrelin levels in P14 mice (n = 12 per group). (E) Confocal images and quantitative comparisons of pERK+ cells after administration of ghrelin or vehicle alone in P6, P10, P14, and adult mice (n = 5 for P10 and P14; n = 4 for P6 and adult). (F) Confocal images and quantitative comparisons of pERK+ cells after administration of ghrelin or vehicle alone in NPY- and POMC-GFP pups on P10 (n = 4 for vehicle; n = 5 for ghrelin). Arrows point to double-labeled cells. (G) Relative expression of Ghsr mRNA in the brains of P14 mice (n = 4 per group). (H) Quantitative comparisons of pERK+ cells in the brains of P14 mice after administration of ghrelin (n = 4). Values are shown as the mean ± SEM. PmV, ventral premammillary nucleus; SCH, suprachiasmatic nucleus; VMH, ventromedial nucleus; V3, third ventricle. *P < 0.05 vs. P6 and P10 (A); vs. P6, P10, and adult (B); vs. P6 fasted (C); vs. vehicle (E and F); and vs. ARH (G and H). Statistical significance was determined using 2-tailed Student’s t tests (C and F) and a 2-way ANOVA followed by Bonferroni’s post-hoc test (A, B, E, G, and H). Scale bars: 120 μm.

Comment in

References

    1. Elmquist JK, Maratos-Flier E, Saper CB, Flier JS. Unraveling the central nervous system pathways underlying responses to leptin. Nat Neurosci. 1998;1(6):445–450. doi: 10.1038/2164. - DOI - PubMed
    1. Nogueiras R, Tschoep MH, Zigman JM. Central nervous system regulation of energy metabolism: ghrelin versus leptin. Ann N Y Acad Sci. 2008;1126:14–19. doi: 10.1196/annals.1433.054. - DOI - PMC - PubMed
    1. Zhang Y, Proenca R, Maffel M, Barone M, Leopold L, Friedman JM. Position cloning of the mouse obese gene and its human homologue. Nature. 1994;372(6505):425. doi: 10.1038/372425a0. - DOI - PubMed
    1. Kojima M, Hosoda H, Date Y, Nakazato M, Matsuo H, Kangawa K. Ghrelin is a growth-hormone-releasing acylated peptide from stomach. Nature. 1999;402(6762):656–660. doi: 10.1038/45230. - DOI - PubMed
    1. Nakazato M, et al. A role for ghrelin in the central regulation of feeding. Nature. 2001;409(6817):194–198. doi: 10.1038/35051587. - DOI - PubMed

Publication types