. 2015 Apr;40(4):309-13.
doi: 10.1097/RLU.0000000000000670.

Initial experience using 99mTc-MIBI SPECT/CT for the differentiation of oncocytoma from renal cell carcinoma

Affiliations

Initial experience using 99mTc-MIBI SPECT/CT for the differentiation of oncocytoma from renal cell carcinoma

Steven P Rowe et al. Clin Nucl Med. 2015 Apr.

Abstract

Purpose: The differentiation of oncocytoma from renal cell carcinoma (RCC) remains a challenge with currently available cross-sectional imaging techniques. As a result, a large number of patients harboring a benign oncocytoma undergo unnecessary surgical resection. In this study, we explored the utility of 99mTc-MIBI SPECT/CT for the differentiation of these tumors based on the hypothesis that the large number of mitochondria in oncocytomas would lead to increased 99mTc-MIBI uptake.

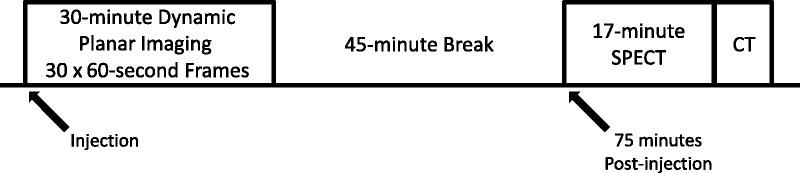
Patients and methods: In total, 6 patients (3 with oncocytoma and 3 with RCC) were imaged with 99mTc-MIBI SPECT/CT. Relative quantification was performed by measuring tumor-to-normal renal parenchyma background ratios.

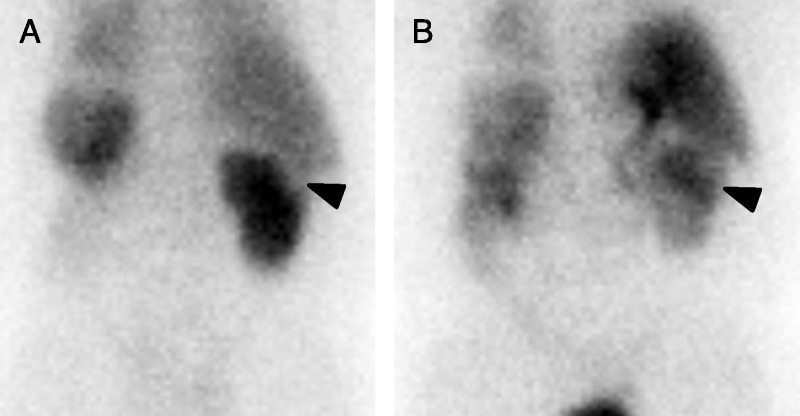
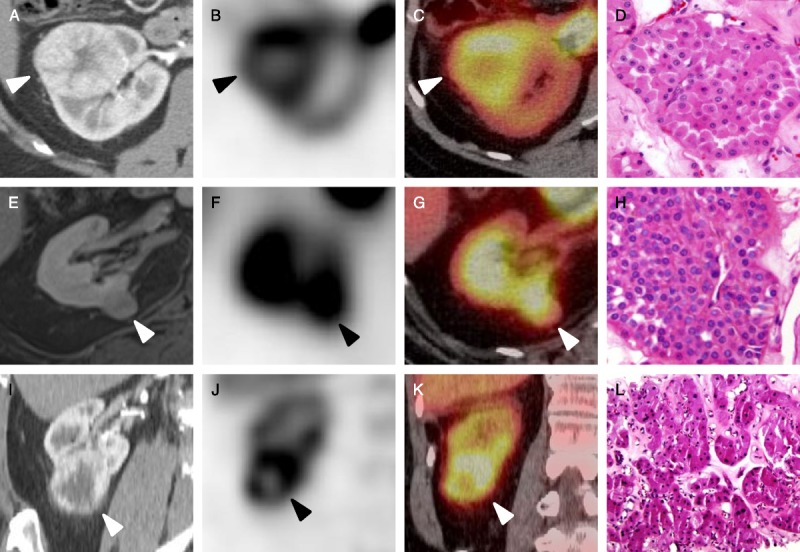
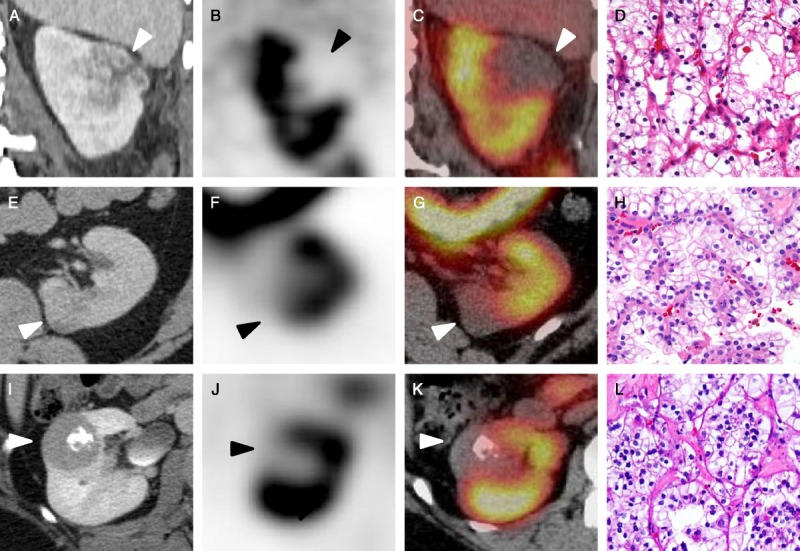
Results: All 3 oncocytomas demonstrated radiotracer uptake near or above the normal renal parenchymal uptake (range of uptake ratios, 0.85-1.78). In contrast, the 3 RCCs were profoundly photopenic relative to renal background (range of uptake ratios, 0.21-0.31).

Conclusions: 99mTc-MIBI SPECT/CT appears to be of value in scintigraphically distinguishing benign renal oncocytoma from RCC.


Conflict of interest statement

Conflicts of interest and sources of funding: Supported by the Buerger Family Scholar Fund and a grant from the National Kidney Foundation of Maryland.

Figures

FIGURE 1
FIGURE 1
Line-block diagram of the imaging protocol used to obtain the planar, SPECT, and SPECT/CT images.
FIGURE 2
FIGURE 2
A, One-minute postinjection posterior dynamic planar image of patient 1 demonstrating a subtle photopenic defect in the cortex of the upper pole of the right kidney at the site of the patient’s known oncocytoma (arrowhead). The patient was status post-left nephrectomy, hence the lack of visualization of the left kidney. B, Thirty-minute postinjection posterior dynamic planar image of the same patient. There has been fill-in of the large right upper pole oncocytoma (arrowhead) with relative retention of radiotracer in the mass higher than that in the surrounding normal renal parenchyma.
FIGURE 3
FIGURE 3
Representative images of the oncocytomas included in this study. A, Axial contrast-enhanced CT, axial SPECT (B), and axial SPECT/CT fusion images of a right upper pole oncocytoma (C) with a representative histologic image (D, hematoxylin and eosin stain [HE] ×20) (patient 1, white and black arrowheads). E, Axial contrast-enhanced T1-weighted MRI, axial SPECT (F), and axial SPECT/CT fusion images of a right medial interpolar oncocytoma (G) with an accompanying histologic image (H, HE ×20) (patient 2, white and black arrowheads). I, Coronal contrast-enhanced CT, coronal SPECT (J), and coronal SPECT/CT fusion images of a right lower pole oncocytoma (K) with a corresponding histologic image (L, HE ×20) (patient 3, white and black arrowheads).
FIGURE 4
FIGURE 4
Representative images of the RCCs included in this study. A, Coronal contrast-enhanced CT, coronal SPECT (B), and coronal SPECT/CT fusion images of a left upper pole Fuhrman grade III clear cell RCC (C) with a representative histologic image (D, HE ×20) (patient 4, white and black arrowheads). E, Axial contrast-enhanced CT, axial SPECT (F), and axial SPECT/CT fusion images of a medial left lower pole unclassified RCC (G) with a corresponding histologic image (H, HE ×20) (patient 5, white and black arrowheads). I, Axial contrast-enhanced CT, axial SPECT (J), and axial SPECT/CT fusion images of an Xp11 translocation RCC (K) with a histologic image (L, HE ×20) (patient 6, white and black arrowheads).

References

    1. Gill IS, Aron M, Gervais DA, et al. Clinical practice. Small renal mass. N Engl J Med. 2010; 362: 624– 634. - PubMed
    1. Hollingsworth JM, Miller DC, Daignault S, et al. Rising incidence of small renal masses: a need to reassess treatment effect. J Natl Cancer Inst. 2006; 98: 1331– 1334. - PubMed
    1. Frank I, Blue ML, Cheville JC, et al. Solid renal tumors: an analysis of pathological features related to tumor size. J Urol. 2003; 170: 2217– 2220. - PubMed
    1. Pierorazio PM, Hyams ES, Tsai S, et al. Multiphasic enhancement patterns of small renal masses (≤4 cm) on preoperative computed tomography: utility for distinguishing subtypes of renal cell carcinoma, angiomyolipoma, and oncoctyoma. Urology. 2013; 81: 1265– 1271. - PMC - PubMed
    1. Pedrosa I, Sun MR, Spencer M, et al. MR imaging of renal masses: correlation with findings at surgery and pathologic analysis. Radiographics. 2008; 28: 985– 1003. - PubMed

Publication types

Substances

Supplementary concepts