. 2015 Apr 9;125(15):2359-69.
doi: 10.1182/blood-2014-10-609073. Epub 2015 Jan 21.

Mapping interactions between complement C3 and regulators using mutations in atypical hemolytic uremic syndrome

Affiliations

Mapping interactions between complement C3 and regulators using mutations in atypical hemolytic uremic syndrome

Elizabeth C Schramm et al. Blood. .

Abstract

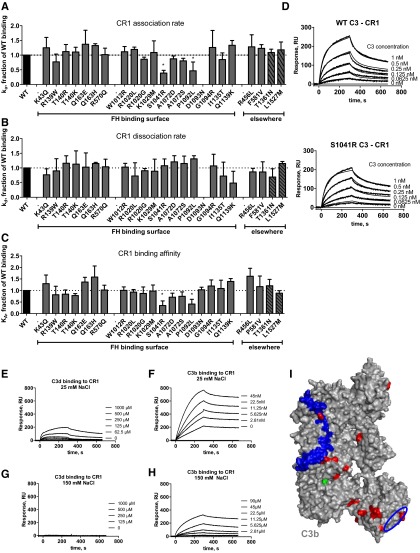
The pathogenesis of atypical hemolytic uremic syndrome (aHUS) is strongly linked to dysregulation of the alternative pathway of the complement system. Mutations in complement genes have been identified in about two-thirds of cases, with 5% to 15% being in C3. In this study, 23 aHUS-associated genetic changes in C3 were characterized relative to their interaction with the control proteins factor H (FH), membrane cofactor protein (MCP; CD46), and complement receptor 1 (CR1; CD35). In surface plasmon resonance experiments, 17 mutant recombinant proteins demonstrated a defect in binding to FH and/or MCP, whereas 2 demonstrated reduced binding to CR1. In the majority of cases, decreased binding affinity translated to a decrease in proteolytic inactivation (known as cofactor activity) of C3b via FH and MCP. These results were used to map the putative binding regions of C3b involved in the interaction with MCP and CR1 and interrogated relative to known FH binding sites. Seventy-six percent of patients with C3 mutations had low C3 levels that correlated with disease severity. This study expands our knowledge of the functional consequences of aHUS-associated C3 mutations relative to the interaction of C3 with complement regulatory proteins mediating cofactor activity.


Figures

Figure 1
Figure 1
Role of complement in aHUS and localization of the aHUS mutations in C3. (A) Role of complement alternative pathway in the physiopathology of aHUS. The alternative complement pathway is continuously activated by the spontaneous transformation of the biologically inactive central complement component C3 into a biologically active form C3(H2O) to serve as a first line of defense against pathogens. C3(H2O) interacts with factor B to form the fluid phase complex C3(H2O)Bb, which has a C3 convertase activity, ie, it is able to cleave native C3 into biologically active fragments C3a (with proinflammatory activity) and C3b (which binds covalently to the cell surface). On the surface of pathogens, the complement cascade proceeds, but on healthy host cells (including the endothelial cells represented here) deposited C3b is rapidly inactivated by regulatory molecules, including MCP, FH, and FI. In case of FB binding and C3 convertase formation, it is dissociated by FH and DAF. These regulatory proteins protect healthy cells from complement overactivation and thereby prevent excessive host tissue damage. In case of mutations of the complement regulators FH, MCP, or FI, complement regulation may become inefficient. When mutations in the components of the C3 convertase (C3 and FB) are present, they may induce a formation of an overactive C3 convertase or a convertase, which is resistant to regulation. In both cases, the complement cascade is be activated on the glomerular endothelial cell surface, leading to endothelial damage, thrombosis, erythrocyte lysis–aHUS. (B) Mapping of the aHUS mutations on the C3 gene and protein. The individual exons and protein domains are indicated. Genetic changes indicated in bold are functionally characterized in this study. Rare variants are indicated in italics. Mutations marked with * are recurrent, being found in 2 or more unrelated patients from different cohorts. (C) Mapping of the aHUS mutations on the surface of C3b and C3d (in gray) in a complex with FH domains CCP1-4 and CCP19-20 (in cyan). Mutations are colored red and rare polymorphisms are green. The genetic changes characterized here are given in bold. The model is reconstructed using the structures of C3b-FH 1-4 and C3d-FH 19-20. (D) Side view of the C3b molecule with mapped aHUS mutations. This surface holds the binding site of the substrate molecule C3, which enters into the convertase to be cleaved. Not visible on C and D are 2 polymorphisms (indicated with dashed arrows) that are located on the surface, opposite to the FH binding site. Further, one mutation (S1597R/M) is buried in the interior of the protein, near the surface and opposite the FH binding site (indicated also with a dashed arrow). The numbering of the mutated residues is according to the mature protein sequence, lacking the 22-amino-acid signal peptide. (E) Summary of the genetic changes in C3 found in aHUS and characterized in this study.
Figure 2
Figure 2
Influence of the mutations on FH binding. Kinetic analyses were performed by SPR with immobilized FH or FH CCP19-20. The running buffer was composed of 10 mM N-2-hydroxyethylpiperazine-N′-2-ethanesulfonic acid (HEPES; pH 7.4), 0.005% Tween-20, and 25 mM NaCl. The recombinant C3 proteins were injected for 300 seconds at 30 μL/min, followed by dissociation of 300 seconds. The chip was regenerated by injection of 0.5 M NaCl. The results are presented as a fraction of WT binding. (A) Association rate constants for FH binding. (B) Dissociation rate constants for FH binding. (C) Affinity for FH binding. (D) Example of SPR sensorograms and kinetic fits for FH binding. (E) Affinity for FH CCP19-20 binding. The black arrows represent mutant proteins for which the binding was low and kinetic constants could not be calculated. *P < .05; **P < .005, t test.
Figure 3
Figure 3
Influence of the mutations on MCP binding. Kinetic analyses were performed by SPR with recombinant soluble MCP on the chip. The running buffer was composed of 10 mM HEPES (pH 7.4), 0.005% Tween-20, and 25 mM NaCl. The recombinant C3 proteins were injected for 300 seconds at 30 μL/min, followed by dissociation of 300 seconds. The chip was regenerated by injection of 0.5 M NaCl. The results are presented as a fraction of WT binding. (A) Association rate constants for MCP binding. (B) Dissociation rate constants for MCP binding. (C) Affinity for MCP binding. (D) Example of SPR sensorograms and kinetic fits for MCP binding. (E) Model of the putative MCP binding site, obtained by molecular modeling and based on the structures of FH CCP1-4 and MCP. MCP CCP1-4 are indicated in cyan. Mutations are mapped in red. *P < .05; **P < .005, t test.
Figure 4
Figure 4
Influence of the mutations on CR1 binding. Kinetic analyses were performed by SPR with recombinant soluble CR1 immobilized on the chip. The running buffer was composed of 10 mM HEPES (pH 7.4), 0.005% Tween-20, and 25 mM NaCl. The recombinant C3 proteins were injected for 300 seconds at 30 μL/min, followed by dissociation of 300 seconds. The chip was regenerated by injection of 0.5 M NaCl. The results are presented as a fraction of WT binding. (A) Association rate constant for CR1 binding. (B) Dissociation rate constant for CR1 binding. (C) Affinity for CR1 binding. (D) Example of SPR sensorograms and kinetic fit for MCP binding. (E) SPR analysis of the binding of C3d to CR1 in low ionic strength buffer. (F) C3b binding to CR1 in the same buffer. (G) Lack of binding of C3d to immobilized CR1 in normal ionic strength buffer. (H) The binding of C3b to immobilized CR1 in the same buffer. (I) Location of the putative CR1 binding site on C3b, comprising residues 727 to 767 of the α′NT region in blue and the suggested second binding site in the TED domain in a blue circle. Mutations are mapped in red. *P < .05; **P < .005, t test.
Figure 5
Figure 5
Functional evaluation of the C3 mutations: cofactor activity. The cofactor activity of FH or MCP toward the cleavage of the recombinant mutant C3 proteins by FI was assessed by western blot. The appearance of the α41 band indicates the cleavage. (A) Representative image for FH. (B) Representative image for MCP. (C) Representative image for CR1. (D). Example for the quantification of the western blot for CR1. (E) Two-dimensional plot representing the fraction of cofactor activity remaining relative to WT for MCP vs FH for each mutation. The dashed lines indicate the cofactor activity in case of WT, and the solid lines represent the 25% confidence limits below which the decrease was considered relevant for the disease. (F) Two-dimensional plot representing the fraction of WT binding for MCP vs FH for each mutation as shown in Figures 2 and 3. The dashed lines indicate the WT binding, and the solid lines represent the 25% confidence limits below which the decrease of the binding was considered relevant for the disease.
Figure 6
Figure 6
Functional evaluation of the C3 mutations: complement activation on endothelial cells. (A) Resting or (B) cytokine-activated HUVECs were incubated with different sera, and the C3 deposition was evaluated by flow cytometery. Sera from healthy donors are represented in gray (filled area under 3 different histograms, corresponding to 3 different donors); sera from aHUS patients with C3 mutations: R139W, violet; A1072D, red; or FH depleted serum as a positive control shown in blue. The black line represents a no serum control. (C) The capacity of purified FH to control the enhanced C3 deposition from FH depleted serum or patients sera on cytokines activated HUVECs was measured by flow cytometry. The percent decrease in the C3 deposition in the presence of FH compared with the serum alone is plotted vs the FH concentration used.
Figure 7
Figure 7
Correlation of the C3 levels of the aHUS patients with C3 mutations with the renal outcome. (A) Data from the French cohort. C3 levels of the patients who developed ESRD up to 1 year after the onset (n = 17) were compared with the rest of the patients (n = 13). Dashed line represents the cutoff for the lower normal range for the C3 levels in the French cohort (660 mg/L). Mean ± standard deviation was 704.9 ± 326.4 for the group of no ESRD 1 year after the onset and 501.7 ± 142.3 for the ESRD group. (B) Combined data from all identified cases in the literature. C3 levels for patients with C3 mutations and with ESRD (n = 26) or without ESRD (n = 41). Lower dashed line represents the cutoff for the lower normal range for the C3 levels as measured in plasma in the French normal population (660 mg/L). Higher dashed line is the cutoff for the lower normal range for the C3 levels in the Italian cohort (830 mg/L), measured in serum. Between these 2 levels are encompassed the lower normal ranges of the other cohorts. Mean ± standard deviation was 765.8 ± 264.8 for the group of no ESRD and 604.9 ± 270.5 for the ESRD group.

Comment in

References

    1. Ricklin D, Hajishengallis G, Yang K, Lambris JD. Complement: a key system for immune surveillance and homeostasis. Nat Immunol. 2010;11(9):785–797. - PMC - PubMed
    1. Roumenina LT, Loirat C, Dragon-Durey MA, Halbwachs-Mecarelli L, Sautes-Fridman C, Fremeaux-Bacchi V. Alternative complement pathway assessment in patients with atypical HUS. J Immunol Methods. 2011;365(1-2):8–26. - PubMed
    1. Pangburn MK, Schreiber RD, Müller-Eberhard HJ. Formation of the initial C3 convertase of the alternative complement pathway. Acquisition of C3b-like activities by spontaneous hydrolysis of the putative thioester in native C3. J Exp Med. 1981;154(3):856–867. - PMC - PubMed
    1. Farries TC, Seya T, Harrison RA, Atkinson JP. Competition for binding sites on C3b by CR1, CR2, MCP, factor B and factor H. Complement Inflamm. 1990;7(1):30–41. - PubMed
    1. Oran AE, Isenman DE. Identification of residues within the 727-767 segment of human complement component C3 important for its interaction with factor H and with complement receptor 1 (CR1, CD35). J Biol Chem. 1999;274(8):5120–5130. - PubMed

Publication types

LinkOut - more resources