

The population genetics of wild chimpanzees in Cameroon and Nigeria suggests a positive role for selection in the evolution of chimpanzee subspecies
- PMID: 25608610
- PMCID: PMC4314757
- DOI: 10.1186/s12862-014-0276-y
The population genetics of wild chimpanzees in Cameroon and Nigeria suggests a positive role for selection in the evolution of chimpanzee subspecies
Abstract
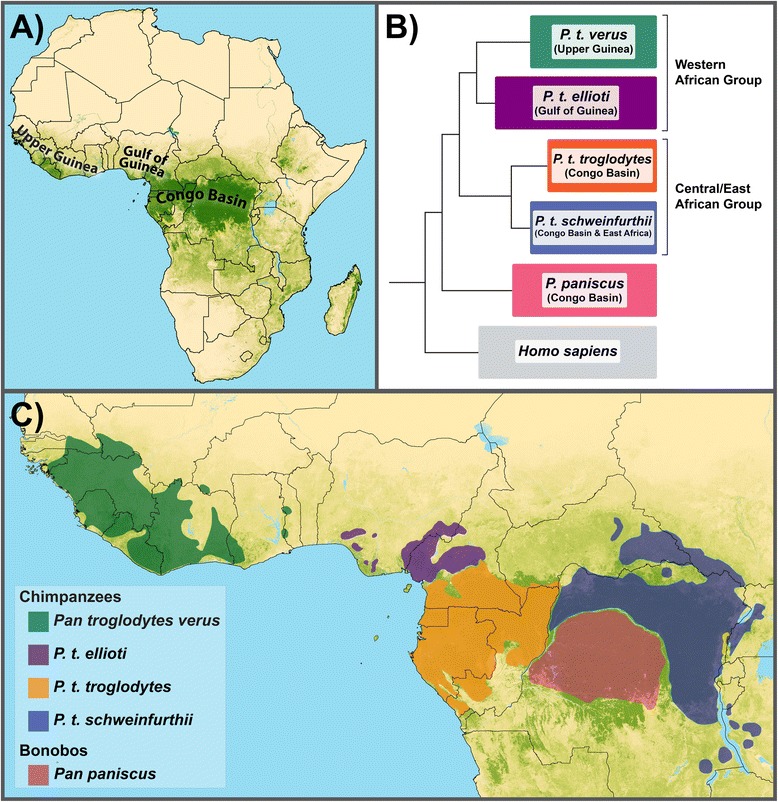
Background: Chimpanzees (Pan troglodytes) can be divided into four subspecies. Substantial phylogenetic evidence suggests that these subspecies can be grouped into two distinct lineages: a western African group that includes P. t. verus and P. t. ellioti and a central/eastern African group that includes P. t. troglodytes and P. t. schweinfurthii. The geographic division of these two lineages occurs in Cameroon, where the rages of P. t. ellioti and P. t. troglodytes appear to converge at the Sanaga River. Remarkably, few population genetic studies have included wild chimpanzees from this region.
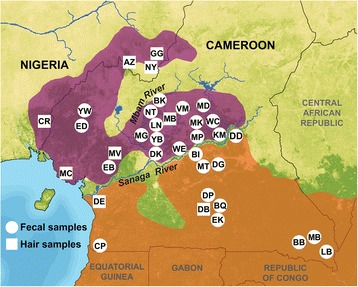
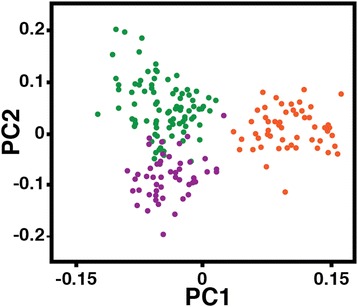
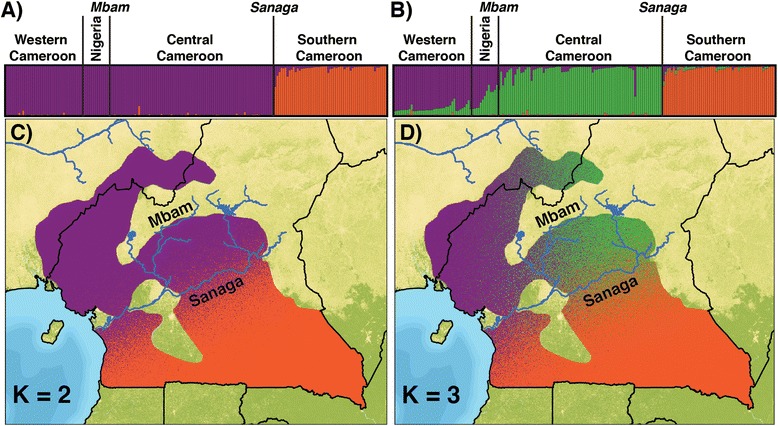
Results: We analyzed microsatellite genotypes of 187 wild, unrelated chimpanzees, and mitochondrial control region sequencing data from 604 chimpanzees. We found that chimpanzees in Cameroon and eastern Nigeria comprise at least two, and likely three populations. Both the mtDNA and microsatellite data suggest that there is a primary separation of P. t. troglodytes in southern Cameroon from P. t. ellioti north and west of the Sanaga River. These two populations split ~200-250 thousand years ago (kya), but have exchanged one migrant per generation since separating. In addition, P. t. ellioti consists of two populations that split from one another ~4 kya. One population is located in the rainforests of western Cameroon and eastern Nigeria, whereas the second population appears to be confined to a savannah-woodland mosaic in central Cameroon.
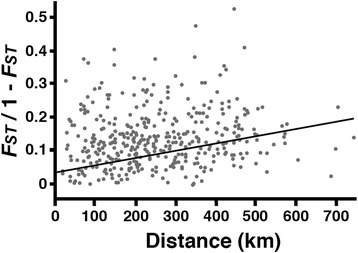
Conclusions: Our findings suggest that there are as many as three genetically distinct populations of chimpanzees in Cameroon and eastern Nigeria. P. t. troglodytes in southern Cameroon comprises one population that is separated from two populations of P. t. ellioti in western and central Cameroon, respectively. P. t. ellioti and P. t. troglodytes appear to be characterized by a pattern of isolation-with-migration, and thus, we propose that neutral processes alone can not explain the differentiation of P. t. ellioti and P. t. troglodytes.
Figures

References
-
- Caldecott JO, Miles L. World Atlas of Great Apes and their Conservation. Berkeley: University of California Press, in association with UNEP-WCMC, Cambridge, UK; 2005. United Nations Environment Programme., World Conservation Monitoring Centre.
-
- Lambert JE. Seasonality, fallback strategies, and natural selection: A chimpanzee and cercopithecoid model for interpreting the evolution of hominin diet. In: Ungar PS, editor. Evolution of the human diet: The known, the unknown, and the unknowable. Oxford; New York: Oxford University Press; 2007. pp. 324–43.
-
- Stumpf R. Chimpanzees and Bonobos, Diveristy within and between species. In: Campbell CJ, Fuentes A, MacKinnon KC, Panger M, Bearder SK, editors. Primates in perspective. New York: Oxford University Press; 2007. pp. 321–44.
Publication types
MeSH terms
Substances
Grants and funding
LinkOut - more resources
Full Text Sources
Other Literature Sources
