Review
. 2014 Apr 22;14(1):14.
doi: 10.1186/1470-7330-14-14.

Imaging of malignancies of the biliary tract- an update

Review

Imaging of malignancies of the biliary tract- an update

Tiffany Priyanthi Hennedige et al. Cancer Imaging. .

Abstract

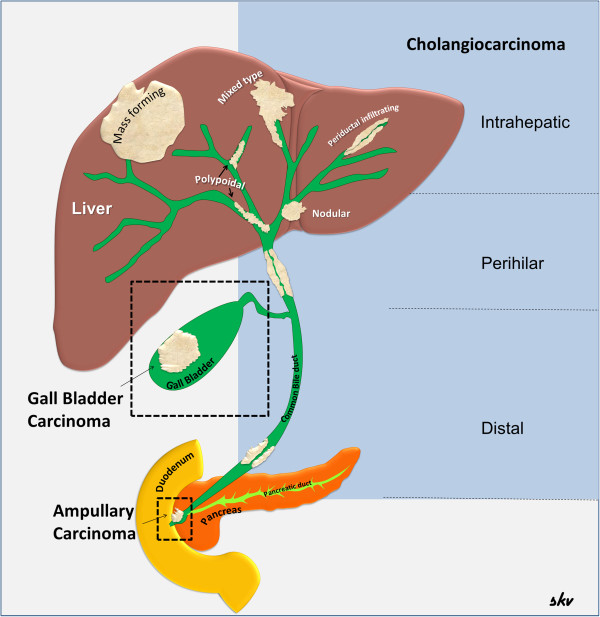
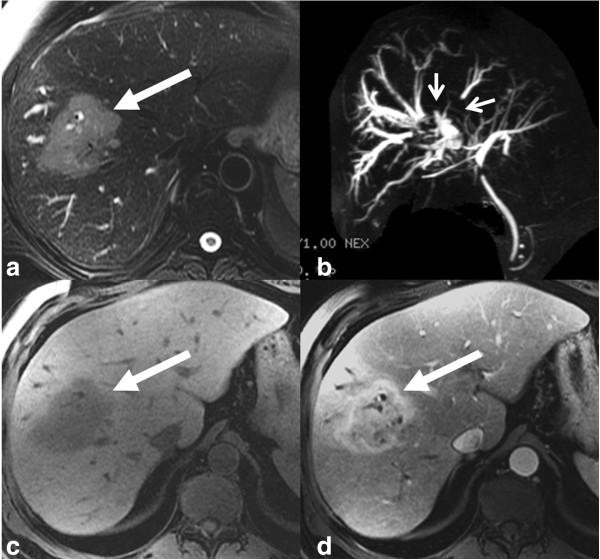
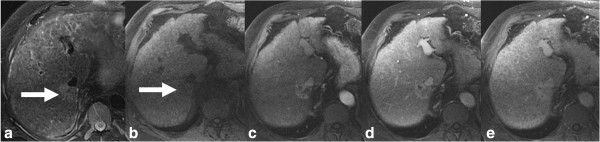
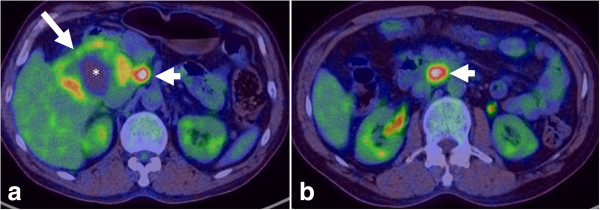
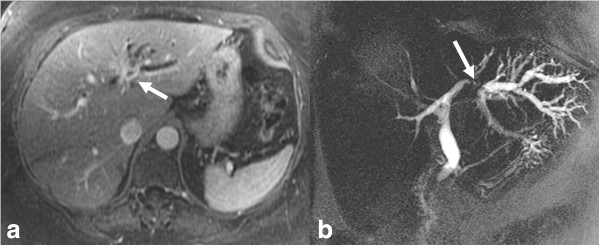
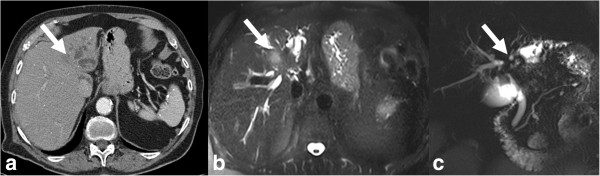
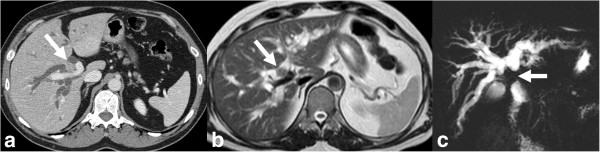
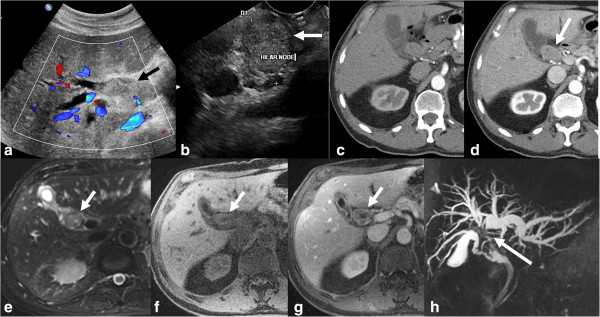
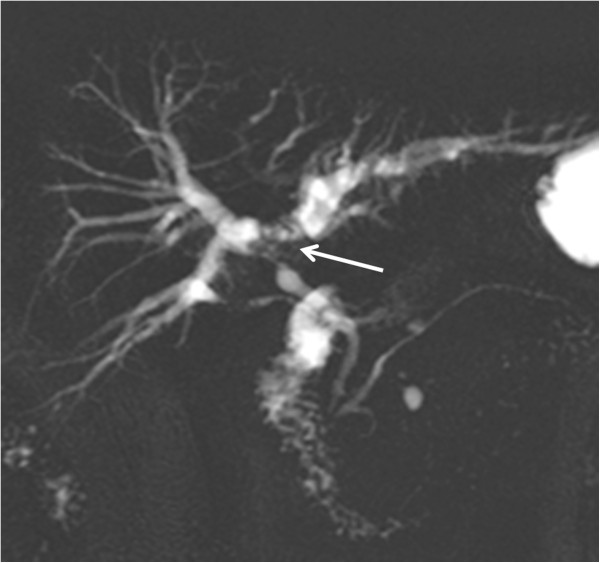
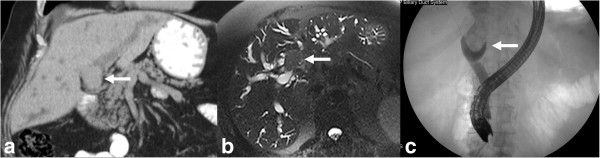
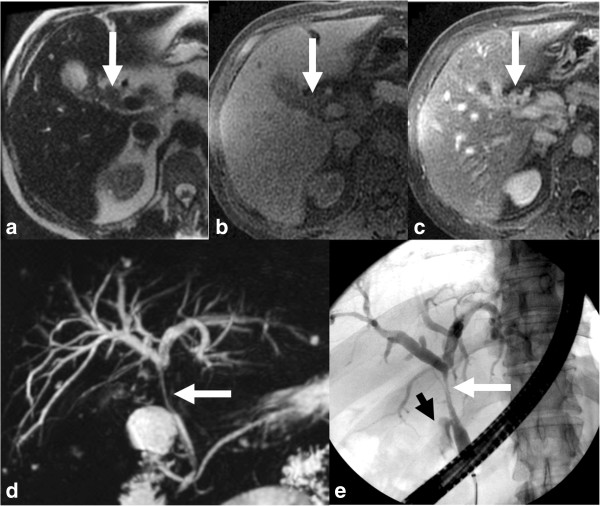
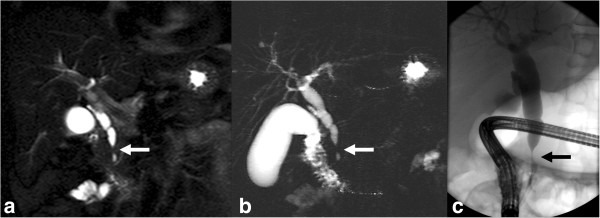
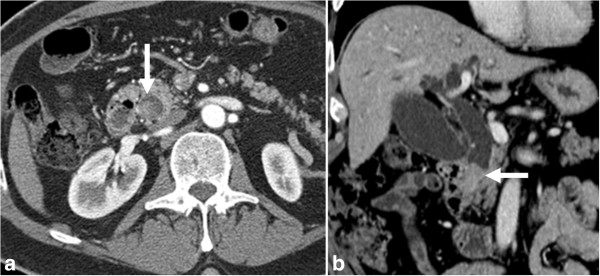
Malignancies of the biliary tract include cholangiocarcinoma, gallbladder cancers and carcinoma of the ampulla of Vater. Biliary tract adenocarcinomas are the second most common primary hepatobiliary cancer. Due to their slow growing nature, non-specific and late symptomatology, these malignancies are often diagnosed in advanced stages with poor prognosis. Apart from incidental discovery of gall bladder carcinoma upon cholecystectomy, early stage biliary tract cancers are now detected with computed tomography (CT) and magnetic resonance imaging (MRI) with magnetic resonance cholangiopancreatography (MRCP). Accurate characterization and staging of these indolent cancers will determine outcome as majority of the patients' are inoperable at the time of presentation. Ultrasound is useful for initial evaluation of the biliary tract and gallbladder masses and in determining the next suitable modality for further evaluation. Multimodality imaging plays an integral role in the management of the biliary tract malignancies. The imaging techniques most useful are MRI with MRCP, endoscopic retrograde cholangiopancreatography (ERCP), endoscopic ultrasound (EUS) and positron emission tomography (PET). In this review we will discuss epidemiology and the role of imaging in detection, characterization and management of the biliary tract malignancies under the three broad categories of cholangiocarcinomas (intra- and extrahepatic), gallbladder cancers and ampullary carcinomas.


Figures

Figure 1
Figure 1
Malignancies of the biliary tract. Diagram showing the biliary tract and the various malignancies arising from the tract. The cholangiocarcinomas are illustrated according to current classification into anatomical and morphological subtypes.
Figure 2
Figure 2
Examples of intrahepatic cholangiocarcinoma (iCCA) on ultrasound in two different patients. Mass forming iCCA may present as a well-defined hypoechoic mass (arrow, a) or as an ill-defined heterogeneous isoechoic mass (arrowheads, b).
Figure 3
Figure 3
CT and MRI appearances of mass forming type of iCCA. Top row: non contrast enhanced (a), post contrast enhanced arterial phase (b), portal venous phase (c) and delayed phase (d) CT images. Bottom row: post contrast enhanced MRI images in arterial phase (e), portal venous phase (f), delayed phase (g), and 20-minute delay post Gd-EOB-DTPA image (h). The mass is iso- to hypodense to liver and shows similar contrast enhancement characteristics on both CT and MRI with peripheral rim like arterial phase enhancement with centripetal enhancement in the portal venous and delayed phases without any washout. In the hepatobiliary phase there is no uptake of Gd-EOB-DTPA by the mass suggesting a non-hepatocellular tumor.
Figure 4
Figure 4
Polypoid type iCCA. Axial T2 sections (a, b) and MRCP (c) demonstrating an isointense filling defect (white arrow) in the right hepatic duct and extending into the common hepatic duct with dilation of intrahepatic ducts. Post contrast enhanced T1-weighted images (d-f) shows the mildly enhancing filling defect representing intraductal papillary neoplasm which extended from just under hepatic capsule filling right hepatic ducts to 3 cm below the confluence of right and left hepatic ducts.
Figure 5
Figure 5
Mixed type iCCA. T2-weighted axial (a), MRCP (b), T1-weighted axial (c) and post contrast T1-weighted axial (d) images demonstrating a predominantly periductal thickening (stricturing iCCA) and also mass forming (arrow) in the right lobe liver. Note the separation of the right intrahepatic ducts on MRCP (arrowheads).
Figure 6
Figure 6
Cirrhosis of liver with iCCA. T2-weighted axial (a), T1-weighted axial (b) and post gadolinium enhanced T1-weighted axial arterial phase (c), portal venous phase (d) and delayed phase (e) images showing iCCA as an iso- to hyperintense lesion (arrow) in posterior right lobe with typical arterial phase rim like enhancement and progressive central enhancement through delayed phase without any washout. The liver parenchyma is heterogeneous and nodular consistent with cirrhosis.
Figure 7
Figure 7
PET-CT of iCCA. Axial PET-CT images showing a large FDG-avid iCCA (arrow) with central photopenia (*) indicating necrosis/fibrosis with FDG-avid portal lymph node (a, arrow head) and aortocaval lymph node (b, arrow head) consistent with lymph node metastases.
Figure 8
Figure 8
Infiltrating pCCA. Axial post contrast enhanced T1-weighted MR image (a) and MRCP (b) images demonstrating an enhancing stricture involving the left hepatic duct (arrow) with upstream dilatation of the left hepatic ducts.
Figure 9
Figure 9
Peripheral cholangiocarcinoma with involvement of confluence. Infiltrating pCCA of the left hepatic duct (arrow) isodense to liver parenchyma on axial contrast enhanced CT (a) with dilation of the left hepatic ducts. The ductal thickening is hyperintense (arrow) on T2-weighted MRI image (b) with extension to the confluence causing mild dilatation of the right hepatic ducts demonstrated better on MRCP (c).
Figure 10
Figure 10
CCA of common hepatic duct with involvement of confluence. Contrast enhanced CT (a), T2-weighted MRI (b) and MRCP (c) images demonstrating thickened and enhancing common hepatic duct (arrow) with involvement of the confluence and upstream dilatation of the intrahepatic ducts. The ductal thickening appears hypointense (arrow) to the surrounding dilated bile ducts on T2-weighted MRI image (b). The involvement of the confluence is demonstrated better on MRCP.
Figure 11
Figure 11
CCA of common hepatic duct with involvement of confluence. Ultrasound with color flow overlay (a) showing an echogenic mass (arrow) filling the common hepatic duct with upstream dilatation of the intrahepatic ducts. EUS image (b) showing a hilar lymph node and was sampled positive for carcinoma. Contrast enhanced CT in arterial phase (c) and portal venous phase (d) showing enhancing mass (arrow) within the duct and no major vascular involvement. The ductal mass is hyperintense on T2-weighted image (e) and hypointense on T1-weighted image (f) and shows concentric post contrast enhancement (g). MRCP (h) shows the confluence invasion and non- visualization of the common hepatic duct.
Figure 12
Figure 12
MRCP of a classical Klatskin’s tumor. The confluence, proximal hepatic ducts and proximal common hepatic duct are strictured (arrow). The common bile duct is of normal caliber.
Figure 13
Figure 13
Hilar CCA presenting as an intraluminal mass with biliary obstruction. The mass is isodense (arrow) on the coronal non-contrast enhanced CT (a) and hypointense on axial T2-weighted image (b) with upstream dilatation of the intrahepatic ducts. ERCP (c) shows a filling defect (arrow) representing the mass extending into the common bile duct with no filling of the intrahepatic ducts.
Figure 14
Figure 14
Perihilar CCA arising from the cystic duct and proximal gall bladder (arrows) with invasion of common hepatic duct. The pCCA is mildly hyperintense on T2-weighted image (a), hypointense on T1-weighted image (b) and shows post contrast enhancement (c). Both MRCP (d) and ERCP (e) demonstrate the stricture of the common hepatic duct till the confluence above and cystic duct insertion below. The gall bladder is not visualized on ERCP and the irregularity of the proximal cystic duct (arrowhead) is due to the tumor.
Figure 15
Figure 15
Distal CCA. Common bile duct stricture due to grade 4 invasive carcinoma. Coronal T2-weighted image (a) and MRCP (b) image showing a short segmental narrowing (arrow) with proximal dilatation. ERCP (c) showing a short segmental stricture representing the invasive CCA.
Figure 16
Figure 16
Distal CCA presenting as a polypoid mass with obstructive jaundice. Contrast enhanced CT axial (a) and coronal reconstruction (b) showing a soft tissue density filling defect in distal common bile duct (arrow) representing the invasive grade 3 adenocarcinoma.
Figure 17
Figure 17
Gall bladder carcinoma. Contrast enhanced axial CT image (a) and coronal reformat (b) showing hypodense thickening of the gall bladder wall representing the carcinoma (arrow) with involvement of the adjacent liver. The thickening covers more than half of gall bladder lumen (*).
Figure 18
Figure 18
Gall bladder carcinoma. The gallbladder and gall bladder fossa is replaced by a large heterogeneous mass of mixed echogenicity on ultrasound (a, b) and heterogeneous hypodense mass (*) on contrast enhanced CT with enhancement of the fibrous stromal component (arrow) of gallbladder carcinoma during the portal venous (c) and delayed phases (d).
Figure 19
Figure 19
Gall bladder carcinoma arising from the fundus of the gall bladder (arrow) seen as an iso to hyperintense mass on T2-weighted (a) and hypointense mass on T1-weighted (b) images and shows enhancement on post gadolinium enhanced image (c).
Figure 20
Figure 20
Ampullary carcinoma. Contrast enhanced axial CT (a) and coronal reformat (b) showing a small polypoid mass (arrow) representing carcinoma in the ampulla of the bile duct.

References

    1. Cleary SP, Dawson LA, Knox JJ, Gallinger S. Cancer of the gallbladder and extrahepatic bile ducts. Curr Probl Surg. 2007;44:396–482. doi: 10.1067/j.cpsurg.2007.04.006. - DOI - PubMed
    1. Craig JR, Peters RL, Edmondson HA. Atlas of Tumor Pathology. 2nd series. Fascicle 26. Washington, D.C: Armed Forces Institute of Pathology; 1989. Tumors of the liver and intrahepatic bile ducts.
    1. Mukhopadhyay S, Landas SK. Putative precursors of gallbladder dysplasia: a review of 400 routinely resected specimens. Arch Pathol Lab Med. 2005;129:386–390. - PubMed
    1. Adsay NV, Klimstra DS. In: Surgical pathology of the GI tract, liver, biliary tract and pancreas. 2. Odze RD, Goldblum JR, editor. Philadelphia, PA: Saunders Elsevier; 2009. Benign and malignant tumors of the gallbladder and extrahepatic biliary tree; pp. 845–875.
    1. Katabi N. Neoplasia of gallbladder and biliary epithelium. Arch Pathol Lab Med. 2010;134:1621–1627. - PubMed

MeSH terms

LinkOut - more resources