. 2015 Mar 21;15(6):1488-96.
doi: 10.1039/c4lc01370k.

A lateral electrophoretic flow diagnostic assay

Affiliations

A lateral electrophoretic flow diagnostic assay

Robert Lin et al. Lab Chip. .

Abstract

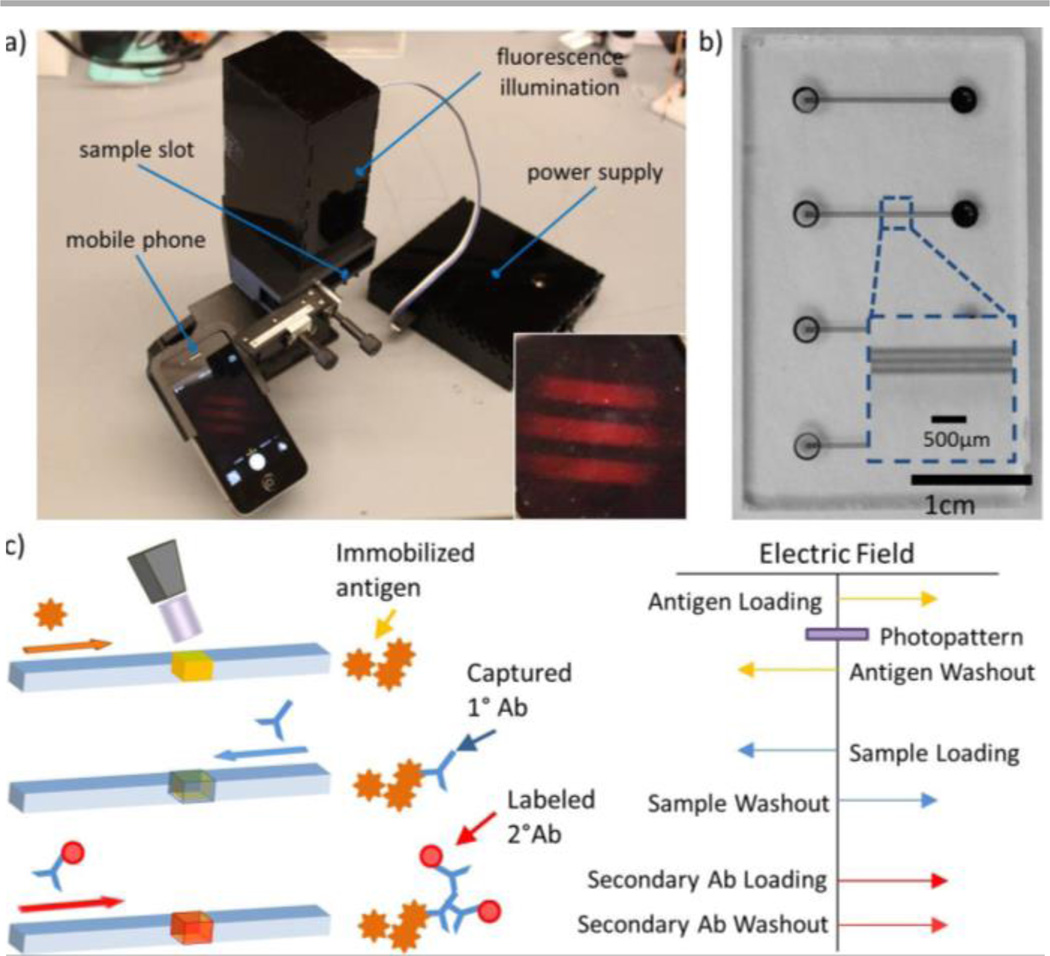
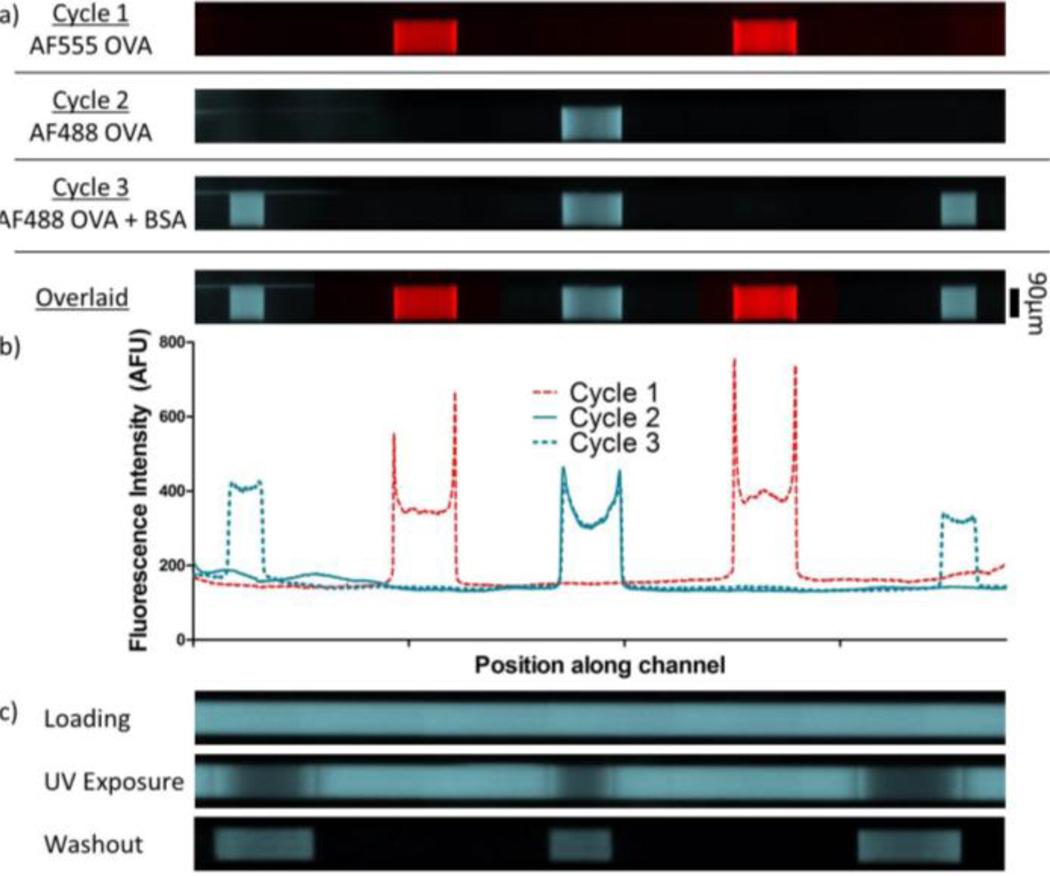
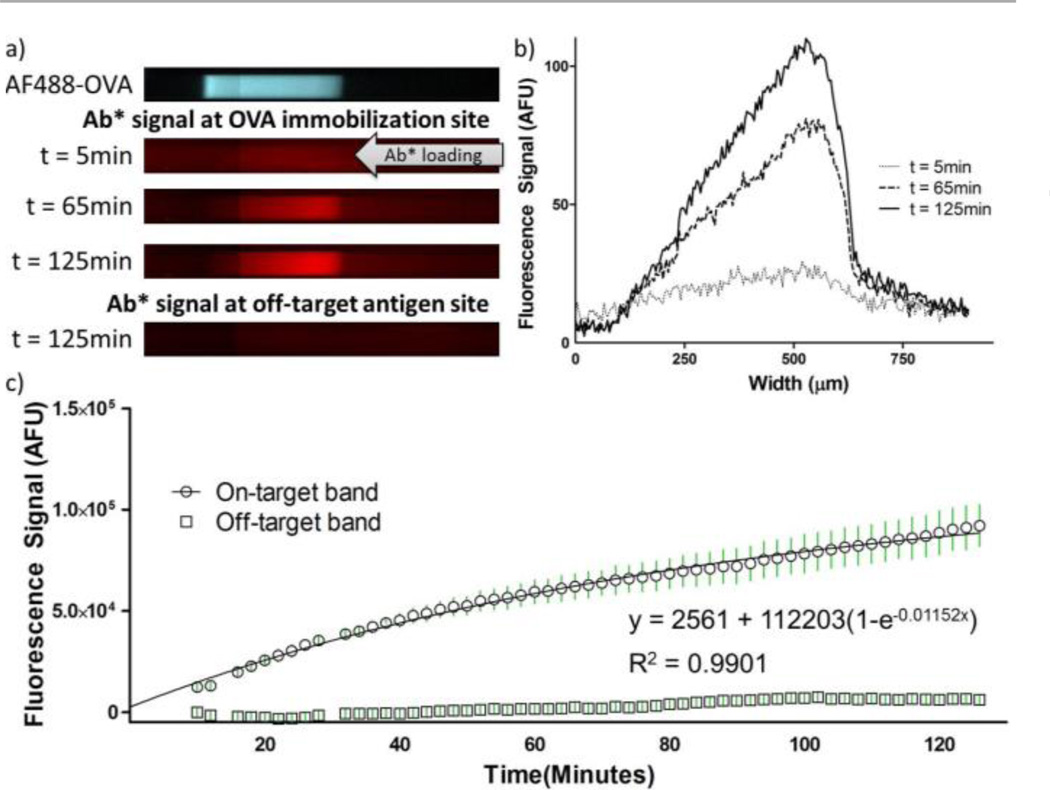
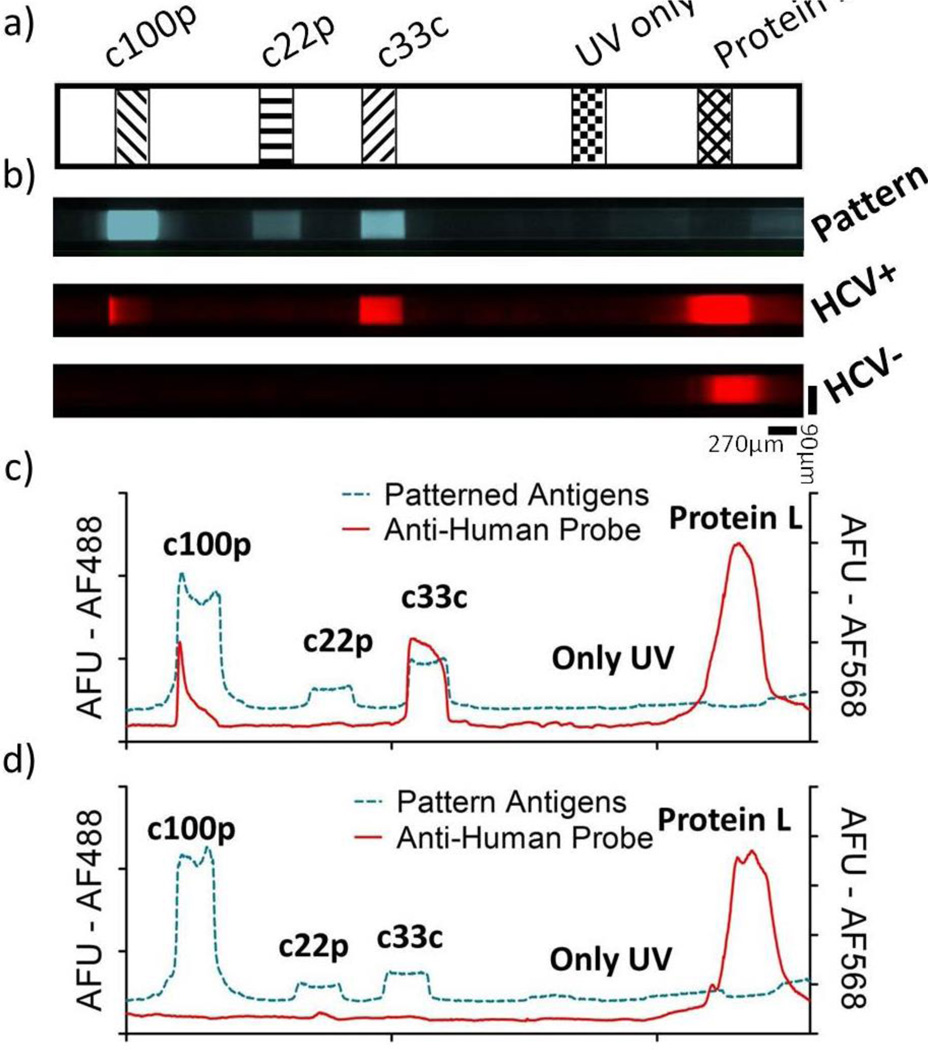
Immunochromatographic assays are a cornerstone tool in disease screening. To complement existing lateral flow assays (based on wicking flow) we introduce a lateral flow format that employs directed electrophoretic transport. The format is termed a "lateral e-flow assay" and is designed to support multiplexed detection using immobilized reaction volumes of capture antigen. To fabricate the lateral e-flow device, we employ mask-based UV photopatterning to selectively immobilize unmodified capture antigen along the microchannel in a barcode-like pattern. The channel-filling polyacrylamide hydrogel incorporates a photoactive moiety (benzophenone) to immobilize capture antigen to the hydrogel without a priori antigen modification. We report a heterogeneous sandwich assay using low-power electrophoresis to drive biospecimen through the capture antigen barcode. Fluorescence barcode readout is collected via a low-resource appropriate imaging system (CellScope). We characterize lateral e-flow assay performance and demonstrate a serum assay for antibodies to the hepatitis C virus (HCV). In a pilot study, the lateral e-flow assay positively identifies HCV+ human sera in 60 min. The lateral e-flow assay provides a flexible format for conducting multiplexed immunoassays relevant to confirmatory diagnosis in near-patient settings.


Figures

Fig. 1
Fig. 1. Lateral e-flow assay concept
a) Photograph of the fluorescence-enabled CellScope with an iPhone 4S as the imaging modality. (Phone shows actual image of chip inside the CellScope) Inset: enlarged view of phone screen, showing fluorescence image. b) Photograph of microfluidic chip with 4 (devices) well-pairs each connected by 3 microfluidic channels. Inset: zoomed-in image of 3 parallel microfluidic channels. c) Conceptual schematic of e-flow assay implementation. Antigen is immobilized onto the PA gel using photopatterning and sample is introduced to capture primary antibodies. Labeled secondary antibodies are used to identify captured primary antibodies and provide signal amplification.
Fig. 2
Fig. 2. Fabrication of multiplexed antigen barcode for lateral e-flow assay device
a) Cycle 1: two bands of OVA-AF555 were concurrently photo-patterned. Cycle 2: a single band of OVA-AF488 was photo-patterned. Cycle 3: two BSA-AF488 bands were photo-patterned. Overlaid composite image reports all 5 immobilized bands. b) Fluorescence signal traces show reduced levels at the center of immobilized bands, attributed to photo-bleaching. c) Fluorescence micrograph reveals significant photo-bleaching after UV exposure.
Fig. 3
Fig. 3. Direct immunoassay for target antibody detection via covalently immobilized protein partner
a) Micrograph of immobilized OVA-AF488 and time course of on-target signal during loading of dilute (~70pM) antibody sample. Off-target BSA band at t = 125 min. b) Line plots of signals at the patterned OVA band at times = 5, 65 minutes and 125 minutes, E = 300 V/cm. c) Captured antibody fluorescence signal at capture OVA location (open circle) with exponential fit (solid line). Signal plotted is the average of 3 parallel channels with vertical green line showing 1 standard deviation of the measured signal. Signal is the sum of pixel values over a 180µm region of interest (ROI) minus the sum of pixel values over a channel region of same ROI with no immobilized proteins.
Fig. 4
Fig. 4. Signal-to-noise ratio (SNR) increases over time and can be used to guide device design
a) SNR increases over the time course of sample loading. b) Barcode design can be optimized based on immobilized protein band size that leads to maximum SNR. Peak SNR is observed by measuring the first 180um of band width.
Fig. 5
Fig. 5. Human Serum HCV lateral e-flow assay
a) HCV barcode assay comprised of 3 HCV antigen bands (c100p, c22p, c33c), negative control (UV only) and positive control (Protein L) bands. Fluorescence micrographs show HCV barcode pattern (HCV antigens labelled with AlexaFluor 488, UV only and Protein L are not labelled). Lateral e-flow assay readouts for HCV+ and HCV− human sera. b) Corresponding fluorescence traces for HCV+ and HCV− sera results.
Fig. 6
Fig. 6. Mobile imaging device for diagnostic data acquisition
a) Schematic showing the light path inside the customized fluorescence CellScope. b) Lateral e-flow readouts using fluorescence-enabled CellScope. The RGB image acquired from the smartphone was split into 3 separate spectral channels. Lateral e-flow assays and samples correspond to Fig. 5a.

References

    1. Self CH, Cook DB. Current Opinion in Biotechnology. 1996;7:60–65. - PubMed
    1. Lequin RM. Clinical Chemistry. 2005;51:2415–2418. - PubMed
    1. Posthuma-Trumpie G, Korf J, Amerongen A. Anal Bioanal Chem. 2009;393:569–582. - PubMed
    1. Yager P, Edwards T, Fu E, Helton K, Nelson K, Tam MR, Weigl BH. Nature. 2006;442:412–418. - PubMed
    1. Fiorini GS, Chiu DT. Biotechniques. 2005;38:429–446. - PubMed

Publication types

MeSH terms