. 2015 Jan 22;16(1):9.
doi: 10.1186/s13059-015-0580-x.

Quantification of cell identity from single-cell gene expression profiles

Affiliations

Quantification of cell identity from single-cell gene expression profiles

Idan Efroni et al. Genome Biol. .

Abstract

The definition of cell identity is a central problem in biology. While single-cell RNA-seq provides a wealth of information regarding cell states, better methods are needed to map their identity, especially during developmental transitions. Here, we use repositories of cell type-specific transcriptomes to quantify identities from single-cell RNA-seq profiles, accurately classifying cells from Arabidopsis root tips and human glioblastoma tumors. We apply our approach to single cells captured from regenerating roots following tip excision. Our technique exposes a previously uncharacterized transient collapse of identity distant from the injury site, demonstrating the biological relevance of a quantitative cell identity index.


Figures
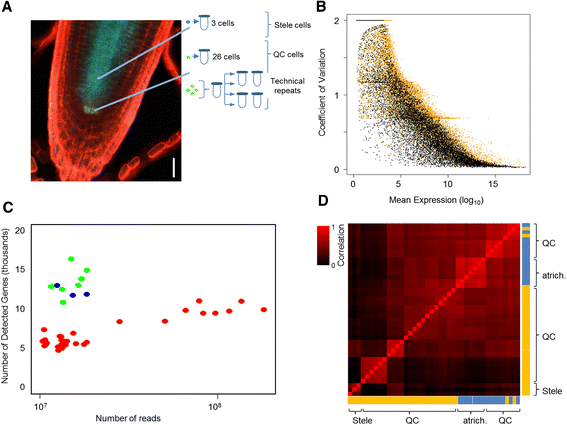
Figure 1
Figure 1
Characterization of single-cell profiles from the Arabidopsis root. (A) Confocal image showing the markers used and cell types collected in this study. WOX5:GFP marks the QC, and WOL:CRE-GR 35S:lox-CFP is a lineage marker for the stele. (B) Noise (coefficient of variation) in the technical repeats (black) and in four individual QC cells from the same batch (orange). (C) Number of genes detected as a function of sequencing depth for different cell types. Red, QC; blue, stele; green, atrichoblasts. (D) Hierarchical clustering of a cross-correlation matrix between the single cell profiles. Batches are color coded (blue [10]; orange, this study) to show batch effects.
Figure 2
Figure 2
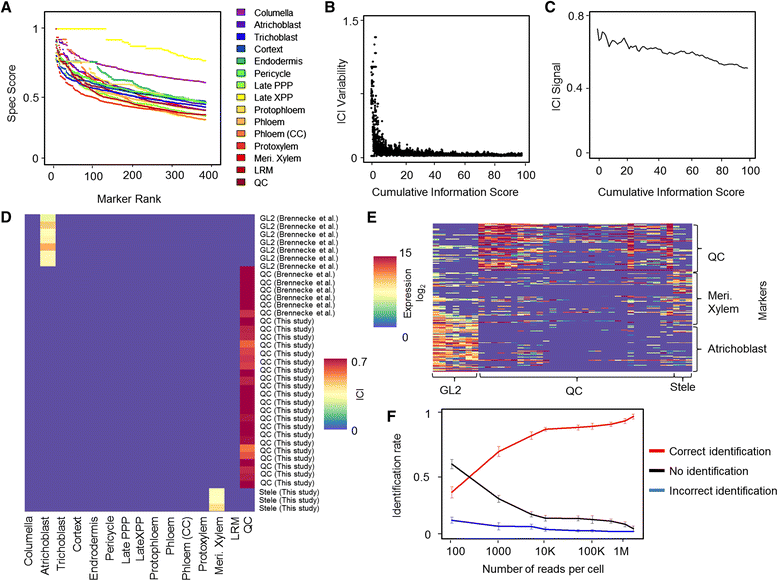
Information-based index of cell identity robustly assigns cell type to single cells. (A) Spec score with increasing marker set sizes in different root tissues measuring level of transcript uniqueness in each cell type. CC, Companion Cell; LRM, Lateral Root Meristem; PPP, Phloem-Pole Pericycle; XPP, Xylem-Pole Pericycle. (B) ICI variability as a function of the number of markers used. Variability is measured as the Euclidean distance between ICI vectors for cumulative information threshold i and i + 1. (C) ICI signal for the 30 plant cells used in the study as a function of the number of markers. (D) ICI output for the single cells used in this study, showing the predicted identity in the heatmap and the cell type marked by the reporter used to collect the cells. (E) Expression of selected markers for atrichoblast, stele, and QC in the single cells. Note the overall tendency of marker specificity and substantial noise from either technical or biological sources. (F) Proportion of cell identities called correct (red), unidentifiable (black), or incorrect (blue) at varying sequencing depths.
Figure 3
Figure 3
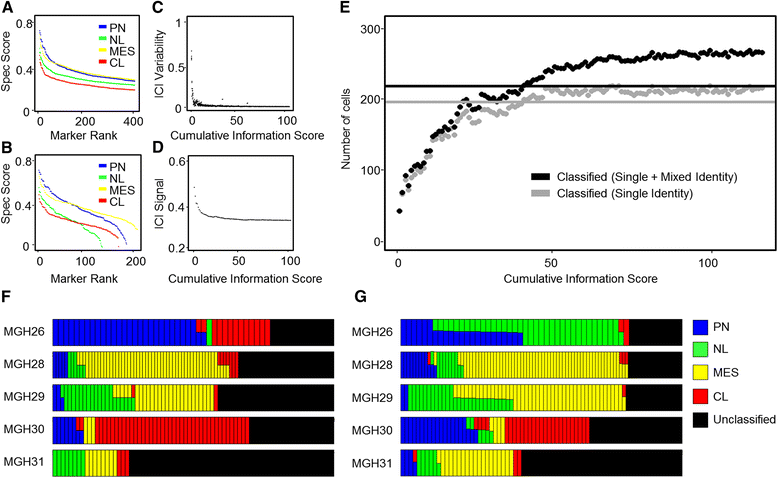
Marker analysis and identity scores of cells from glioblastoma tumors. (A,B) Spec scores for the glioblastoma markers identified by our algorithm (A) and for the TCGA markers previously published [34] ordered by rank. Tumor subtypes are: CL, classical; MES, mesenchymal; NL, neural; PN, proneural. (C,D) ICI variability (C) and ICI signal (D) for the glioblastoma cells. (E) Number of classified cells in all five tumors as a function of the marker information threshold. Black indicates all classified cells including mixed identities. Gray indicates cells classified as a single identity. Lines indicate number of cells classified in a previously applied algorithm [24]. (F,G) Identity calls for individual cells from each subtype in each of the five tumors, using the algorithm and markers in a previous analysis [24] (F), and using the ICI method with a cumulative information threshold of 110 (G). Each column represents a single cell, and the color-coded bars represent relative identities.
Figure 4
Figure 4
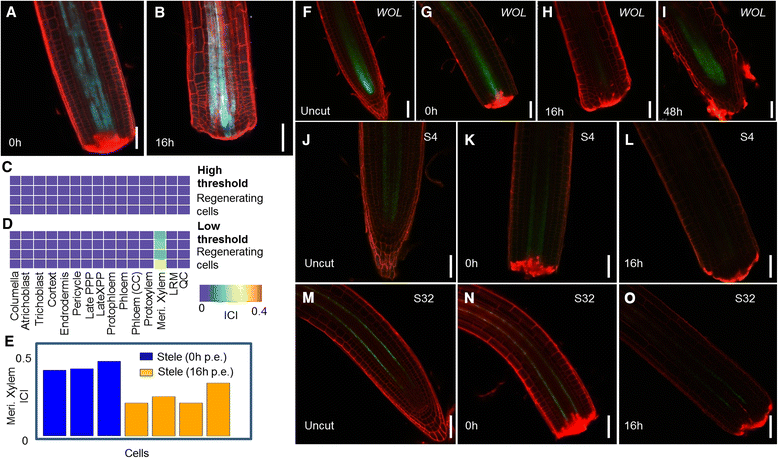
Quantitative loss of identity in regenerating root vascular cells. (A,B) Induced WOL:CRE-GR 35S:lox-CFP roots, immediately after (A) and 16 hours (B) following root tip excision. (C,D) Significant ICIs (P < 0.05 (C) and P < 0.2 (D)) for the four cells isolated from the regenerating root shown in (B). CC, Companion Cell; LRM, Lateral Root Meristem; PPP, Phloem Pole Pericycle; XPP, Xylem Pole Pericycle. (E) Meristematic xylem ICIs for stele cells. (F-O) Confocal images of WOL:GFP (F-I), S4 (J-L) and S32 (M-O) plants before (F,J,M), immediately after (G,K,N), and at 16 (H,L,O) and 48 (I) hours post-tip excision. Note that expression of vascular markers is greatly diminished at 16 hours.

References

    1. Tang F, Barbacioru C, Wang Y, Nordman E, Lee C, Xu N, et al. mRNA-Seq whole-transcriptome analysis of a single cell. Nat Methods. 2009;6:377–82. doi: 10.1038/nmeth.1315. - DOI - PubMed
    1. Ramsköld D, Luo S, Wang Y-C, Li R, Deng Q, Faridani OR, et al. Full-length mRNA-Seq from single-cell levels of RNA and individual circulating tumor cells. Nat Biotechnol. 2012;30:777–82. doi: 10.1038/nbt.2282. - DOI - PMC - PubMed
    1. Hashimshony T, Wagner F, Sher N, Yanai I. CEL-Seq: single-cell RNA-Seq by multiplexed linear amplification. Cell Rep. 2012;2:666–73. doi: 10.1016/j.celrep.2012.08.003. - DOI - PubMed
    1. Islam S, Kjällquist U, Moliner A, Zajac P, Fan J-B, Lönnerberg P, et al. Characterization of the single-cell transcriptional landscape by highly multiplex RNA-seq. Genome Res. 2011;21:1160–7. doi: 10.1101/gr.110882.110. - DOI - PMC - PubMed
    1. Guo G, Huss M, Tong GQ, Wang C, Li Sun L, Clarke ND, et al. Resolution of cell fate decisions revealed by single-cell gene expression analysis from zygote to blastocyst. Dev Cell. 2010;18:675–85. doi: 10.1016/j.devcel.2010.02.012. - DOI - PubMed

Publication types

Substances