. 2015 Jan 22:6:6135.
doi: 10.1038/ncomms7135.

A proteomic approach reveals integrin activation state-dependent control of microtubule cortical targeting

Affiliations

A proteomic approach reveals integrin activation state-dependent control of microtubule cortical targeting

Adam Byron et al. Nat Commun. .

Abstract

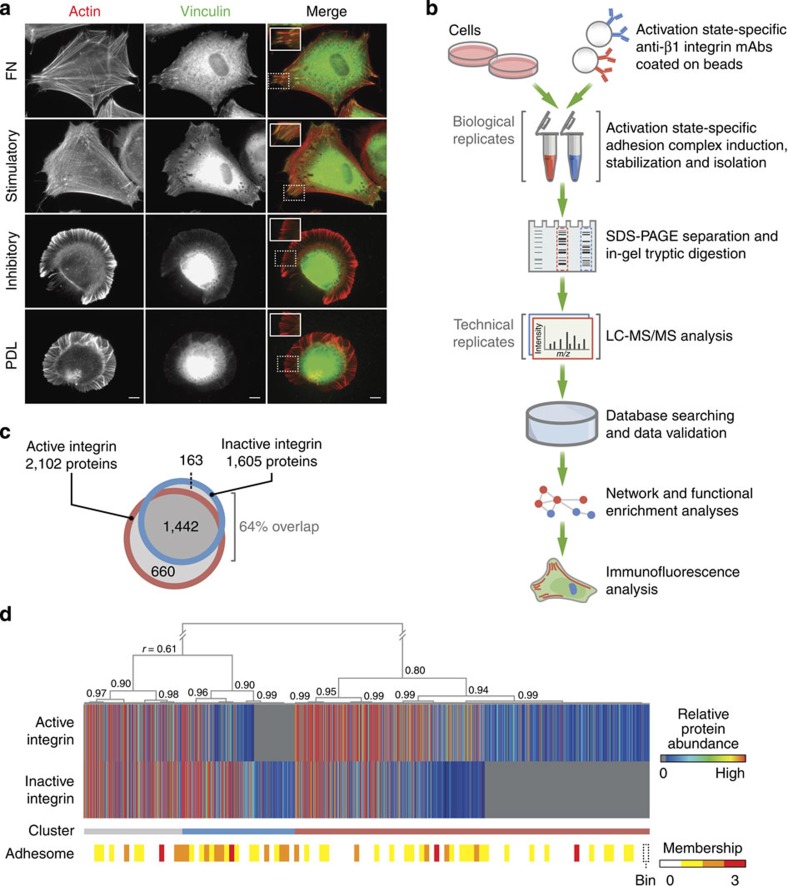
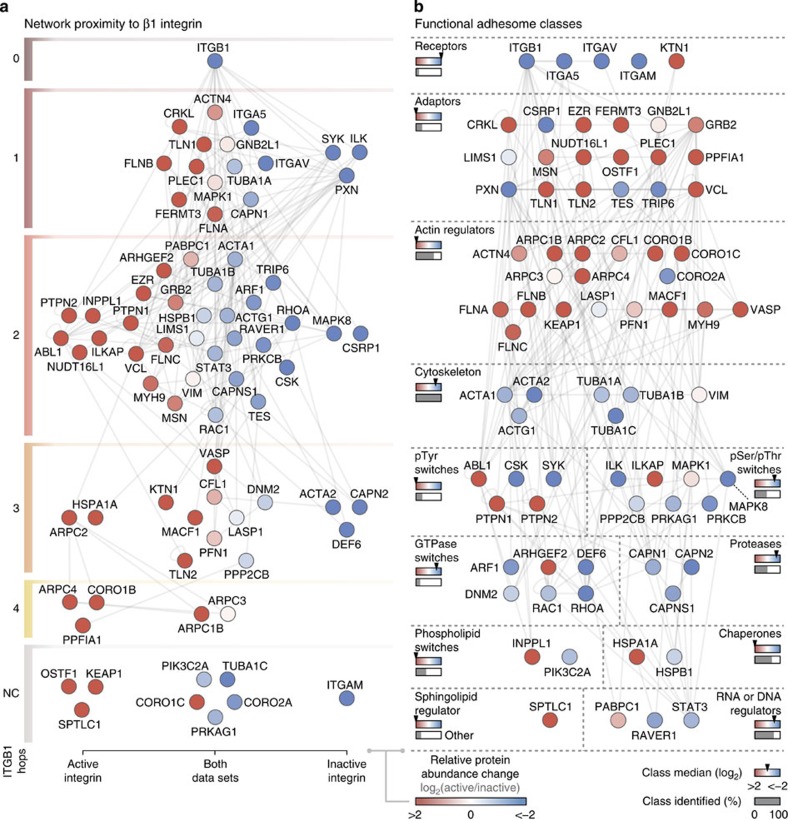
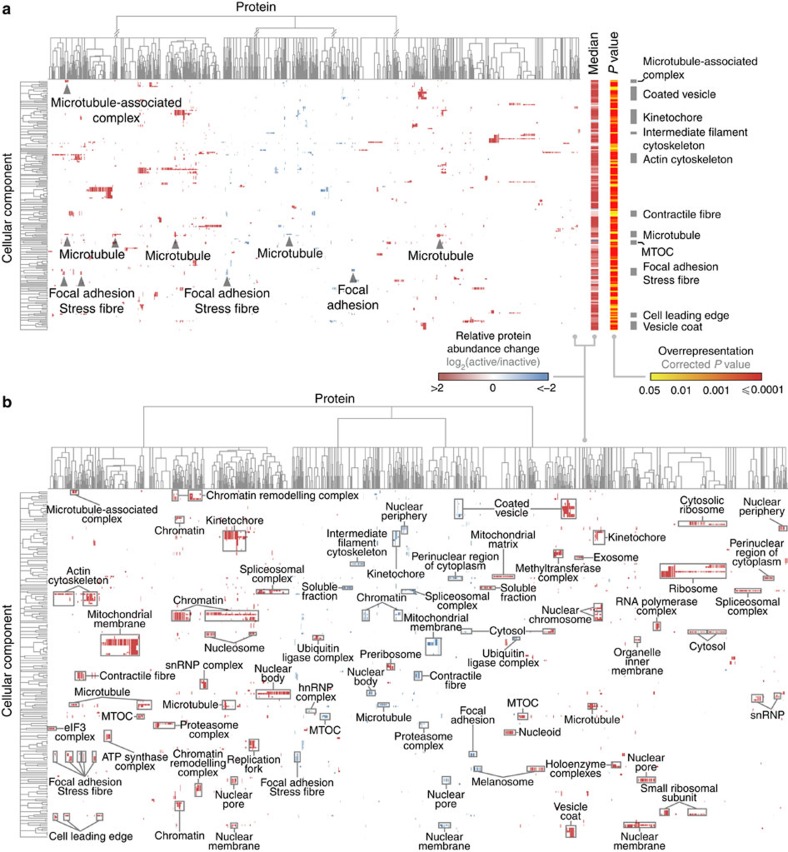
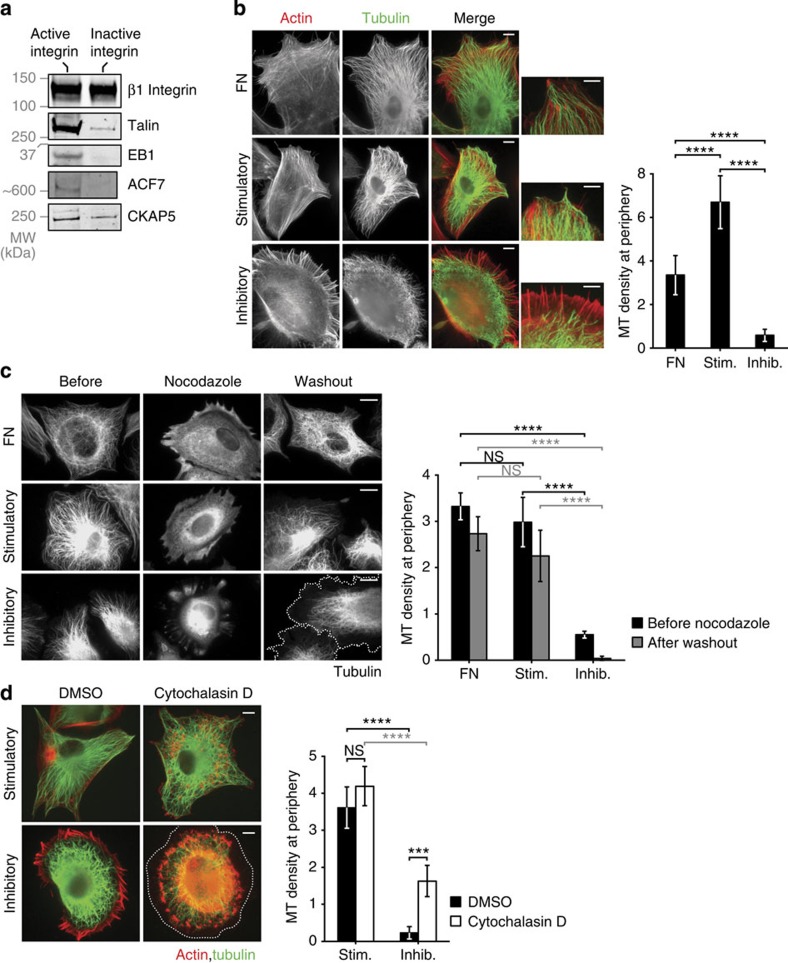
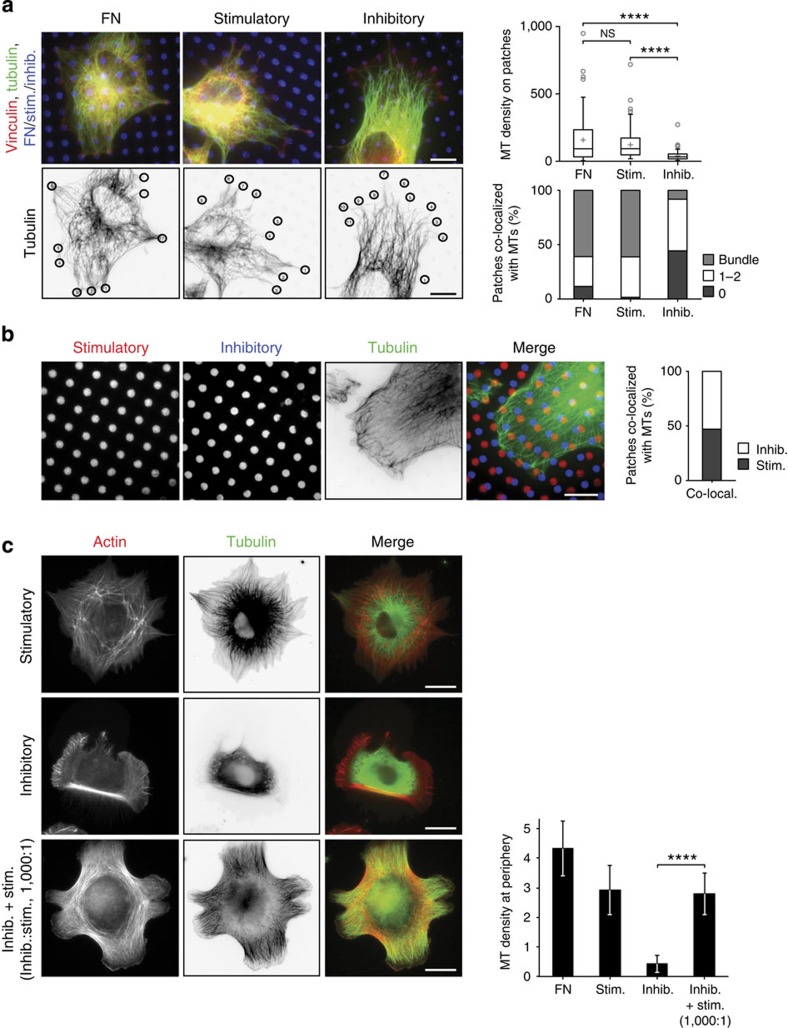
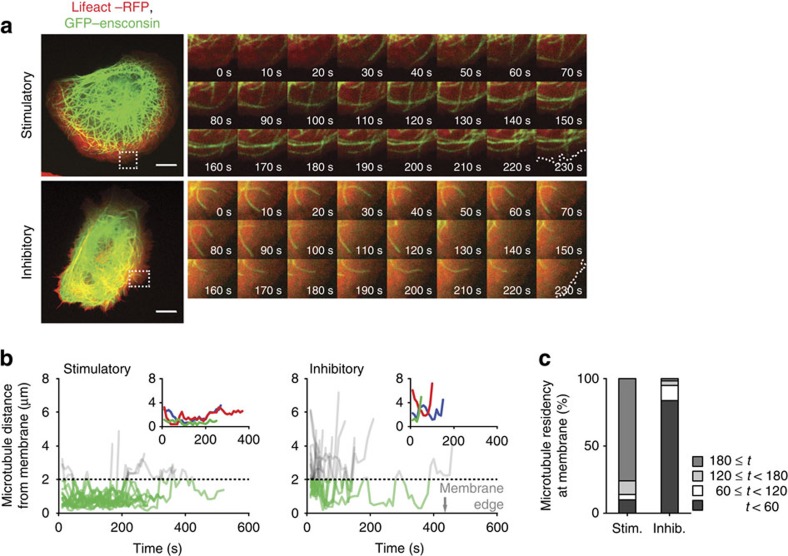
Integrin activation, which is regulated by allosteric changes in receptor conformation, enables cellular responses to the chemical, mechanical and topological features of the extracellular microenvironment. A global view of how activation state converts the molecular composition of the region proximal to integrins into functional readouts is, however, lacking. Here, using conformation-specific monoclonal antibodies, we report the isolation of integrin activation state-dependent complexes and their characterization by mass spectrometry. Quantitative comparisons, integrating network, clustering, pathway and image analyses, define multiple functional protein modules enriched in a conformation-specific manner. Notably, active integrin complexes are specifically enriched for proteins associated with microtubule-based functions. Visualization of microtubules on micropatterned surfaces and live cell imaging demonstrate that active integrins establish an environment that stabilizes microtubules at the cell periphery. These data provide a resource for the interrogation of the global molecular connections that link integrin activation to adhesion signalling.


Figures

Figure 1
Figure 1. Proteomic analysis of integrin activation state-dependent adhesion complexes.
(a) Immunofluorescence microscopy revealed the morphology of HFF cells spread on stimulatory and inhibitory anti-β1 integrin mAbs compared with those spread on FN and PDL. Cells were stained for actin (red) and vinculin (green). Scale bar, 10 μm. Inset images correspond to areas highlighted in white dotted boxes. (b) Workflow for the isolation and proteomic analysis of integrin activation state-dependent adhesion complexes from K562 cells using paramagnetic beads coated with activation state-specific anti-β1 integrin mAbs. The mAb-coated beads recruited integrins and associated proteins in live cells, and complexes were then stabilized with crosslinker and crosslinks cleaved under reducing conditions during extraction. Proteins were then separated by SDS–PAGE, and the whole lane was cut into 30 slices, which were subjected to in-gel trypsin digestion for analysis by MS. MS data for each adhesion complex isolation were acquired in technical duplicate, from duplicate biological isolations. (c) The distribution of proteins identified in active and inactive integrin data sets illustrated as a Venn diagram. (d) Hierarchical clustering analysis of the quantitative MS data. Pearson correlation coefficients (r) are indicated at dendrogram nodes; a threshold of r≥0.80 was used to identify clusters of distinct protein enrichment (red, active integrin; blue, inactive integrin; grey, unenriched). Accompanying heat bar (bottom) indicates the distribution of reported adhesome components. Bin, 20 proteins.
Figure 2
Figure 2. Analysis of the activation state-dependent adhesome network.
(a) The interaction network of adhesome components identified by MS was arranged according to the number of reported protein interactions (hops) from β1 integrin (ITGB1). Proteins were clustered by their detection in active (left), inactive (right) or both (middle) integrin data sets. NC, not connected. (b) The identified adhesome network was arranged according to functional class. Arrowheads on coloured bars indicate median protein enrichment for each class; grey bars indicate proportion of reported adhesome class identified by MS. Sphingolipid regulator quantification was derived from ‘other’ adhesome class. ‘Channel’ and ‘E3 ligase’ adhesome classes were not represented (0% identified). Nodes (proteins) are coloured according to their enrichment in active (red) or inactive (blue) integrin complexes (log2 transformed). Gene symbols are shown for clarity (see Supplementary Table 1 for protein names).
Figure 3
Figure 3. Functional enrichment map of the adhesion complex landscape.
(a) Overrepresented cellular component terms from proteins identified by MS were hierarchically clustered according to protein enrichment in active (red) or inactive (blue) integrin complexes. This identified clusters of similarly enriched proteins associated with a similar set of functional terms. Arrowheads indicate clusters of proteins assigned focal adhesion and microtubule-associated terms. Accompanying heat bars (right) indicate median protein enrichment (log2 transformed) and false discovery rate-corrected P value (all <0.05; log10 scale) for each cellular component term. Grey bars (right) highlight focal adhesion and cytoskeleton terms. (b) Additional annotation of the cellular component terms on the functional enrichment map in a revealed the range and specificity of cellular localizations reported for proteins enriched in active and inactive integrin complexes. Clusters containing at least eight proteins were labelled in addition to the cell adhesion terms highlighted in a. MTOC, microtubule-organizing centre; snRNP, small nuclear ribonucleoprotein.
Figure 4
Figure 4. Microtubule (MT) morphology and dynamics are dictated by integrin activation state.
(a) Enrichment of talin and three +TIPs, EB1, ACF7 and CKAP5, in complexes associated with active β1 integrin shown by western blotting (see Supplementary Fig. 10 for original blots). (b) HFFs spread on FN, stimulatory and inhibitory anti-β1 integrin mAbs stained for actin (red) and α-tubulin (green), with corresponding high-power images highlighting the difference in the location of MTs at the cell periphery in cells spread on the inhibitory mAb. MT density was calculated by counting the number of MTs within a 5 × 2 μm region of the cell periphery. Results are mean±s.d. (n=9, 10 and 8 cells for FN, stimulatory and inhibitory, respectively). (c) HFFs spread on FN, stimulatory and inhibitory mAbs for 1 h before treatment with 10 μM nocodazole for 45 min and subsequent washout for a further 45 min to examine MT regrowth. Cells were stained for tubulin; dotted line in bottom-right image indicates cell periphery. MT density was measured as in b. Results are mean±s.d. (n=3, 3 and 4 cells for FN, stimulatory and inhibitory, respectively). (d) HFFs spread on stimulatory and inhibitory mAbs for 1 h before addition of 20 μM cytochalasin D or dimethylsulphoxide (DMSO) vehicle control for a further 1 h. Cells were stained for actin (red) and α-tubulin (green); dotted line in bottom-right image indicates cell periphery. MT density was measured as in b. Results are mean±s.d. (n=5 and 5 DMSO-treated cells and 5 and 7 cytochalasin D-treated cells for stimulatory and inhibitory, respectively). Scale bars, 10 μm. ***P<0.001, ****P<0.0001; one-way analysis of variance with Tukey’s post hoc correction in b, two-way analysis of variance with Tukey’s post hoc correction in c and d (see Supplementary Table 4 for statistics source data). Inhib., inhibitory; MW, molecular weight; NS, nonsignificant; Stim., stimulatory.
Figure 5
Figure 5. Active integrin stabilizes microtubules (MTs) at the cell cortex.
(a) MT targeting was assessed using engineered micropatterns coated with FN, stimulatory and inhibitory mAbs. HFFs spread on micropatterns were stained for vinculin (red), α-tubulin (green) and ligand (blue) (upper image panel). MT density in areas of the cell periphery corresponding to ligand-coated patches (black circles in lower image panel) was quantified by measuring fluorescence intensity in the tubulin channel (upper graph). Results are mean±s.d. (n=95, 125 and 97 patches for FN, stimulatory and inhibitory, respectively). The same regions were also categorized as containing no MTs, 1–2 MTs or several MTs bundled together, which was expressed as a percentage of n patches (lower graph). (b) HFFs spread on micropatterns with alternating patches of stimulatory (red) and inhibitory (blue) mAbs were stained for α-tubulin (green). Patches of stimulatory or inhibitory mAb at the cell periphery targeted by MTs were expressed as a percentage of n patches (n=864 patches). (c) HFFs spread on stimulatory, inhibitory and a mixture of both mAbs (1,000:1, inhibitory:stimulatory molar ratio) were stained for actin (red) and α-tubulin (green). MT density was measured as in Fig. 4b. Results are mean±s.d. (n=9, 12, 11 and 10 cells for FN, stimulatory, inhibitory and inhibitory plus stimulatory, respectively). Scale bars, 10 μm. ****P<0.0001; Kruskal–Wallis test with Dunn’s post hoc correction in a, two-tailed unpaired t test with Welch’s correction in c (see Supplementary Table 4 for statistics source data). Co-local., co-localized; Inhib., inhibitory; NS, nonsignificant; Stim., stimulatory.
Figure 6
Figure 6. Active integrin creates an environment that stabilizes microtubules at the cell cortex.
(a) U2OS cells expressing Lifeact–RFP (red) and GFP–ensconsin (green) to visualize actin and microtubules, respectively, were spread on stimulatory and inhibitory mAbs, and microtubule dynamics were tracked by live confocal microscopy. Scale bars, 10 μm. Sequences of images (right panels) correspond to areas highlighted in white dotted boxes (left panels) recorded over a period of 230 s (one image acquired every 10 s; see Supplementary Movies 1 and 2). White dotted line in final image of each sequence indicates the cell periphery as defined by the actin channel. (b) The distance between microtubule tips and the cell edge over the lifetime of each microtubule in the field of view (n=15 microtubules for both stimulatory and inhibitory). Microtubules within 2 μm of the cell periphery are shown in green. Inset graphs display traces from three individual microtubules. (c) The length of time (t, s) each quantified microtubule remained within 2 μm of the cell periphery in cells plated on stimulatory and inhibitory mAbs was expressed as a percentage of n microtubules (n=71 and 61 microtubules for stimulatory and inhibitory, respectively). Inhib., inhibitory; Stim., stimulatory.

References

    1. Campbell I. D. & Humphries M. J. Integrin structure, activation, and interactions. Cold Spring Harb. Perspect. Biol. 3, a004994 (2011). - PMC - PubMed
    1. Wolfenson H., Lavelin I. & Geiger B. Dynamic regulation of the structure and functions of integrin adhesions. Dev. Cell 24, 447–458 (2013). - PMC - PubMed
    1. Zaidel-Bar R., Itzkovitz S., Ma’ayan A., Iyengar R. & Geiger B. Functional atlas of the integrin adhesome. Nat. Cell Biol. 9, 858–867 (2007). - PMC - PubMed
    1. Winograd-Katz S. E., Fässler R., Geiger B. & Legate K. R. The integrin adhesome: from genes and proteins to human disease. Nat. Rev. Mol. Cell Biol. 15, 273–288 (2014). - PubMed
    1. Kanchanawong P. et al. Nanoscale architecture of integrin-based cell adhesions. Nature 468, 580–584 (2010). - PMC - PubMed

Publication types

MeSH terms