. 2015 Jan 21;7(271):271ra7.
doi: 10.1126/scitranslmed.3010633.

Surface-enhanced resonance Raman scattering nanostars for high-precision cancer imaging

Affiliations

Surface-enhanced resonance Raman scattering nanostars for high-precision cancer imaging

Stefan Harmsen et al. Sci Transl Med. .

Abstract

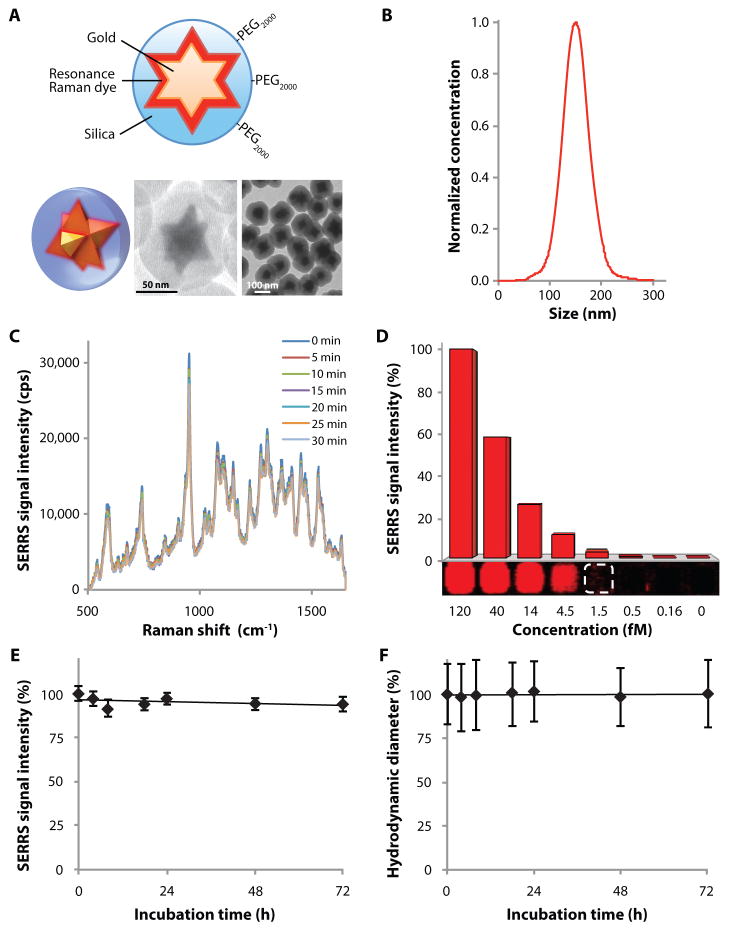
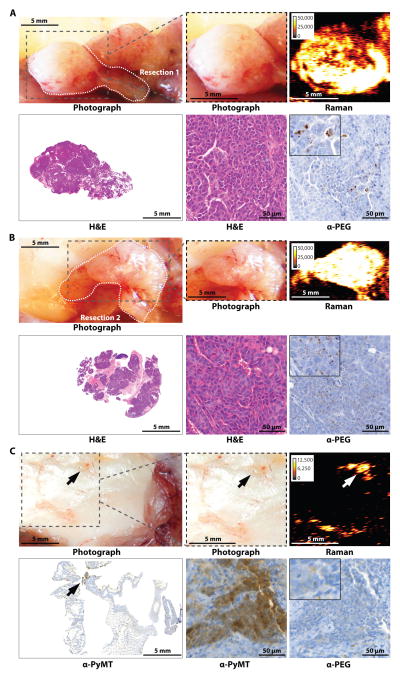
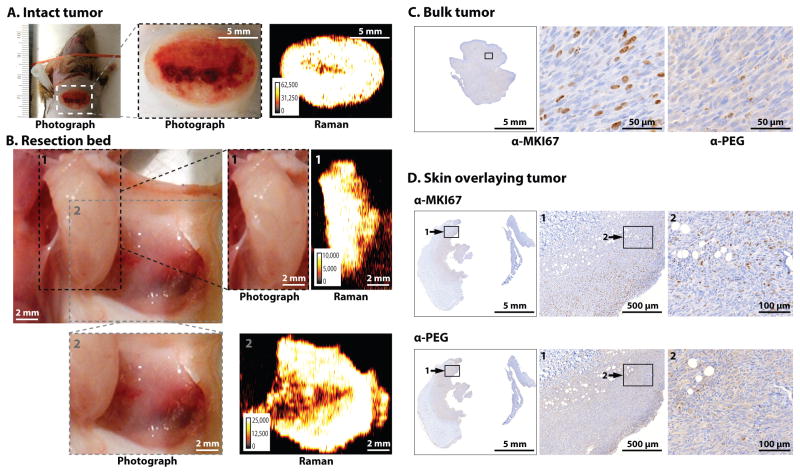
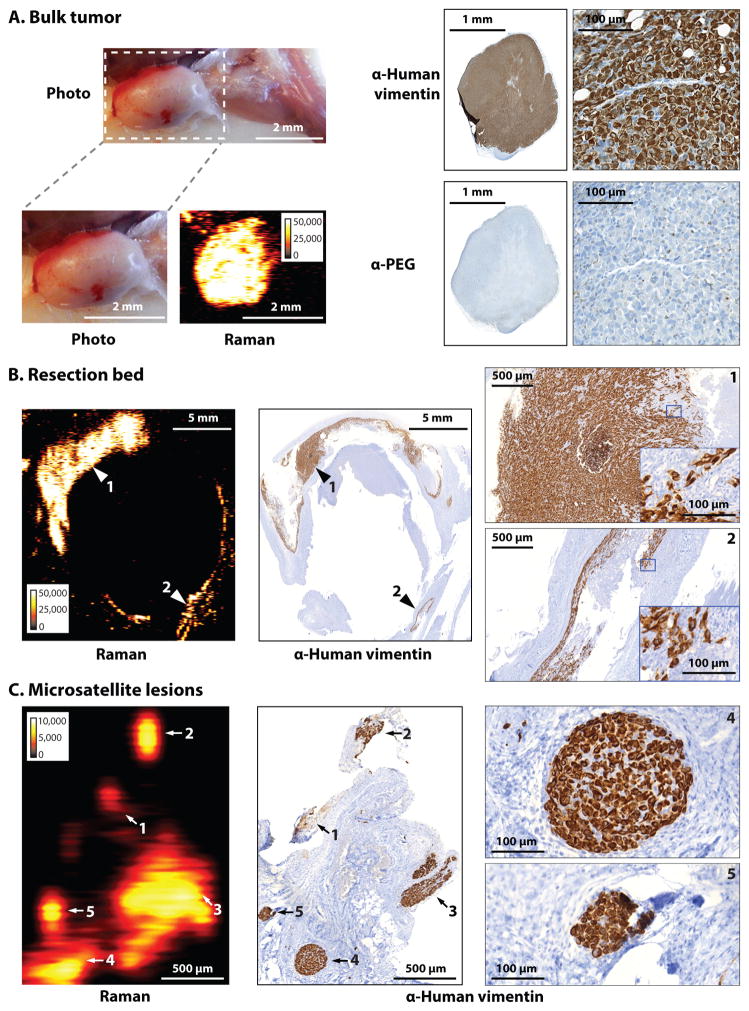
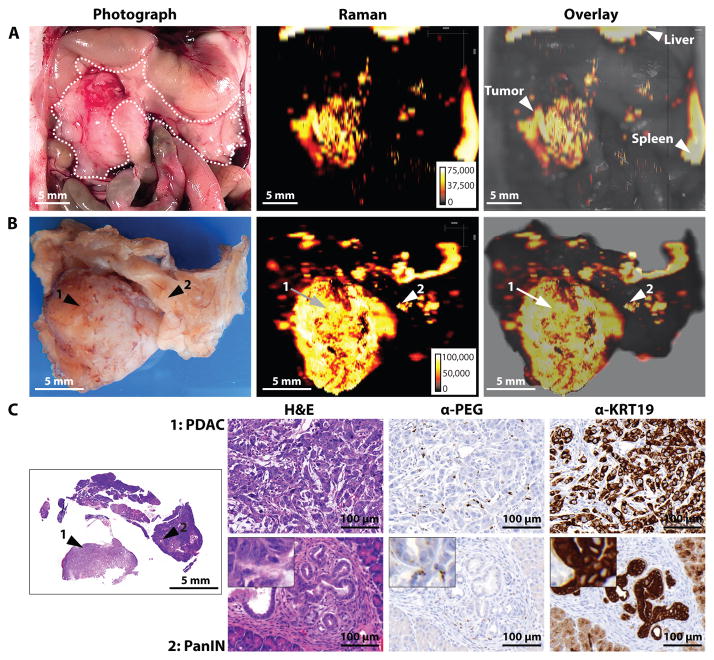
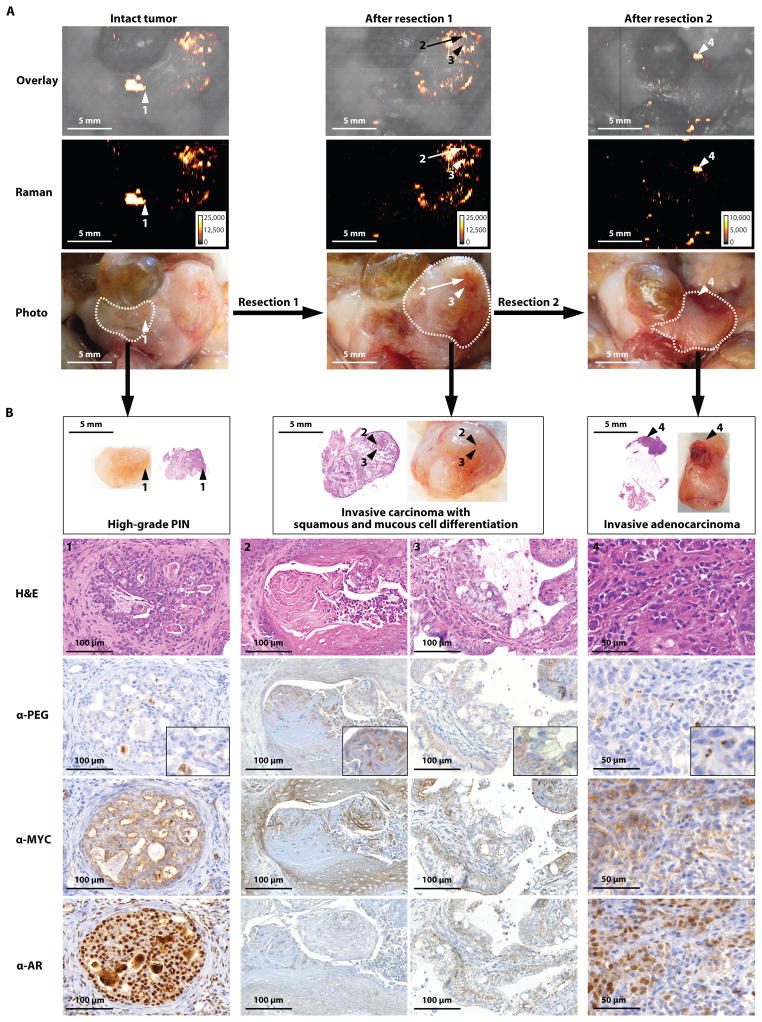
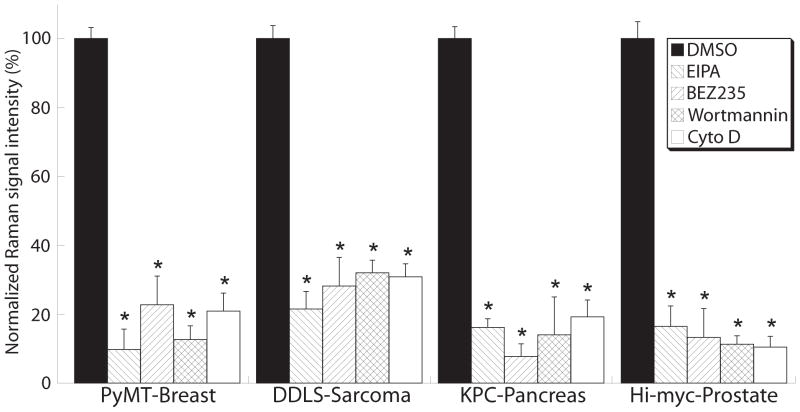
The inability to visualize the true extent of cancers represents a significant challenge in many areas of oncology. The margins of most cancer types are not well demarcated because the cancer diffusely infiltrates the surrounding tissues. Furthermore, cancers may be multifocal and characterized by the presence of microscopic satellite lesions. Such microscopic foci represent a major reason for persistence of cancer, local recurrences, and metastatic spread, and are usually impossible to visualize with currently available imaging technologies. An imaging method to reveal the true extent of tumors is desired clinically and surgically. We show the precise visualization of tumor margins, microscopic tumor invasion, and multifocal locoregional tumor spread using a new generation of surface-enhanced resonance Raman scattering (SERRS) nanoparticles, which are termed SERRS nanostars. The SERRS nanostars feature a star-shaped gold core, a Raman reporter resonant in the near-infrared spectrum, and a primer-free silication method. In genetically engineered mouse models of pancreatic cancer, breast cancer, prostate cancer, and sarcoma, and in one human sarcoma xenograft model, SERRS nanostars enabled accurate detection of macroscopic malignant lesions, as well as microscopic disease, without the need for a targeting moiety. Moreover, the sensitivity (1.5 fM limit of detection) of SERRS nanostars allowed imaging of premalignant lesions of pancreatic and prostatic neoplasias. High sensitivity and broad applicability, in conjunction with their inert gold-silica composition, render SERRS nanostars a promising imaging agent for more precise cancer imaging and resection.


Conflict of interest statement

Competing interests: S.H., M.A.W., and M.F.K. are inventors of the pending international patents PCT/US13/57636 and PCT/US13/76475 and US provisional patent 62/020,089; M.F.K. is the inventor of the pending international patent PCT/US14/17508.

Figures

Fig. 1
Fig. 1. Characterization of SERRS-nanostars
(A) Schematic and 3D representations of the SERRS-nanostar geometry. Transmission electron micrographs shown are of a single SERRS-nanostar and of a population of SERRS-nanostars. (B) SERRS-nanostar size distribution as determined by nanoparticle tracking analysis. (C) Raman spectra showing photostability of 1 nM SERRS-nanostars during continuous laser irradiation at 100 mW/cm2 for 30 min. Spectra were acquired at 5-min intervals (50 μW/cm2 laser power, 1 s acquisition time, 5× objective). (D) Limit of detection of SERRS-nanostars in solution was 1.5 fM at 100 mW/cm2, 1.5 s acquisition time, 5× objective. Data are representative of 3 separate experiments. (E and F) Serum stability of the SERRS signal intensity (E) and hydrodynamic diameter (F) of 1.0 nM PEGylated SERRS-nanostars during incubation in 50% mouse serum. Data are means ± s.e.m. (n = 3).
Fig. 2
Fig. 2. Imaging of breast cancer in the MMTV-PyMT mouse model
Images are representative of n = 6 mice. (A and B) Two adjacent tumors developed in the upper and lower right thoracic mammary glands. Gray dashed box in photograph indicates areas scanned with Raman imaging. (A) After imaging, the first tumor was resected along the white dotted line. Anti-PEG IHC staining shows presence of SERRS-nanostars in the tumor. (B) The second tumor was then also resected along the white dotted line. (C) Gray dashed box in photograph indicates resection bed after removal of tumors in (A and B). Staining for PyMT indicated residual microscopic tumor. Raman signal intensity is displayed in counts per second.
Fig. 3
Fig. 3. Imaging microscopic tumor infiltration into the skin in the ink4a/arf−/− fibrosarcoma model
Images are representative of n = 4 mice. (A) White dashed box in photograph highlights the primary tumor on the right shoulder of an ink4a/arf−/− fibrosarcoma-bearing mouse after hair removal. Despite the red discoloration, the skin overlying the tumor is intact. Images were obtained prior to surgical exposure of the tumor. (B) The photograph on the upper left shows the bulk tumor (black box 1) after the overlying skin (gray box 2) had been lifted off. Raman images of each boxed area were acquired, focusing on the bulk tumor (box 1) and the skin overlying the tumor (box 2), respectively. (C and D) Histologic analysis of the resected bulk tumor (C) and the skin overlying the tumor (D) at different magnifications of indicated regions. Antibody against the marker Ki-67 (α-MKI67) indicated cell proliferation and α-PEG stained for SERRS-nanostars. Raman signal intensity is displayed in counts per second.
Fig. 4
Fig. 4. Microscopic infiltration at tumor margins and regional satellite metastases in the human dedifferentiated liposarcoma (DDLS) mouse model
Images are representative of n = 7 mice. (A) SERRS-nanostars were detected by Raman imaging of the bulk tumor. IHC staining for human vimentin indicated the presence of tumor cells; anti-PEG, the presence of SERRS-nanostars. (B) Raman image of the resection bed acquired after surgical excision of the bulk tumor in (A); resection was guided by white light only. IHC images on the far right are magnified views of the areas indicated with arrows 1 and 2. (C) In a different mouse bearing a liposarcoma, multiple small foci of Raman signal (arrows 1 to 5) were found ~10 mm away from the margins of the bulk tumor. As confirmed by IHC, each of these five SERRS-nanostar-positive foci correlated with a separate tumor cell cluster (vimentin+) as small as 100 μm (micrometastases). Images on far right are magnified views of the metastases labeled 4 and 5. Raman signal intensity is displayed in counts per second.
Fig. 5
Fig. 5. Imaging of pancreatic ductal adenocarcinoma (PDAC) and pancreatic intraepithelial lesion (PanIN) in the KPC mouse model
Images are representative of n = 5 mice. (A) In situ photograph of the exposed upper abdomen in a mouse with a PDAC in the head of the pancreas (outlined with white dotted line). Corresponding Raman image, showing SERRS-nanostar signal in the macroscopically visible tumor in the head as well as small scattered foci of SERRS-signal in other normal appearing regions of the pancreas, are also shown. (B) Photographic and high-resolution Raman images of the excised pancreas from (A). (C) H&E staining of the whole pancreas, including PDAC (arrow 1) and PanIN (arrow 2). Histology and KRT19 staining in regions 1 and 2 confirmed lesions. Raman signal intensity is displayed in counts per second.
Fig. 6
Fig. 6. Imaging different stages and grades of prostatic neoplasia within the same prostate in the Hi-myc mouse model
Images are representative of n = 5 mice. (A) Sequential resection of the prostatic tumors with correlating Raman images. White dotted lines indicate the margins of each resection. (B) Histological staining for the tumor marker MYC, androgen receptor (AR), and PEG (indicating the presence of SERRS-nanostars) of the respective resected tumors in (A). Raman signal intensity is displayed in counts per second.
Fig. 7
Fig. 7. Macropinocytosis is a major contributor to SERRS-nanostar uptake by tumor cells
Four small-molecule inhibitors—5-(N-ethyl-N-isopropyl)amiloride (EIPA), NVP-BEZ235, wortmannin, and cytochalasin D—were applied in vitro to tumor cell lines established from primary spontaneous tumors of the MMTV-PyMT [AT-3], KPC [PCC-9], and Hi-myc [Myc-CaP] transgenic mice and DDLS-8817 liposarcoma cells. Raman images of the cells were acquired and the Raman signal from the accumulated SERRS-nanostars was quantified and normalized to the cell number. Data are means ± SD normalized to DMSO vehicle control (defined as 100%), and are representative of 3 separate experiments. *P < 0.05 versus the DMSO control; unpaired t-test.

Comment in

References

    1. Kircher MF, Hricak H, Larson SM. Molecular imaging for personalized cancer care. Mol Oncol. 2012;6:182–195. - PMC - PubMed
    1. Kircher MF, Willmann JK. Molecular body imaging: MR imaging, CT, and US. part I. principles. Radiology. 2012;263:633–643. - PMC - PubMed
    1. Kircher MF, Willmann JK. Molecular body imaging: MR imaging, CT, and US. Part II. Applications. Radiology. 2012;264:349–368. - PubMed
    1. Wang LV, Hu S. Photoacoustic tomography: in vivo imaging from organelles to organs. Science. 2012;335:1458–1462. - PMC - PubMed
    1. Gioux S, Choi HS, Frangioni JV. Image-guided surgery using invisible near-infrared light: fundamentals of clinical translation. Mol Imaging. 2010;9:237–255. - PMC - PubMed

Publication types